Now that you’ve seen how colors and images in the real world are perceived by your visual and cognitive systems, we’ll discuss how they’re represented on the computer.
Although it seems counterintuitive, all images are represented discretely, rather than continuously. This is referred to as discretization. Images are composed of a large number of tiny, discrete dots, all very close to each other. Because they’re so small and so close, we can’t distinguish these dots, and so they create the illusion of a continuous image. Consider the following image representations:
A visual image: When an image is focused in our eye, the wavelength and intensity of light are sensed by the rod and cone cells in the retina. Although these cells are extremely small and close together, they are discrete receptors.
A digital image: In a digital camera, an image, like the one in Figure A-23, is focused on a matrix of photoreceptors. These photoreceptors are very similar to the retina, although the density of receptors is much lower than the density of cones in the fovea.
A photograph: On photographic paper, the image is represented with crystals of silver salt, which are very small but discrete. In fact, you can see the grain on a traditional photograph with a good magnifying glass.
A printout: On a printed document, discretization is represented by carbon grains (for a laser printer) or by ink spots (for an inkjet printer).
A computer screen: On a computer screen, the pixels that constitute the screen surface are discrete. You can clearly see this in Figure A-24, which shows an extreme close-up of a small part of Figure A-23.

Color is also discretized:
The eye has specialized cones that each perceive a single color of light.
The digital camera has three types of photoreceptors, and each is sensitive to a specific color (red, green, or blue).
Photographic paper is made up of three layers, one for each fundamental color (red, green, and blue), and each layer is partially transparent.
Printers juxtapose colored dots, sometimes in layers with partial transparency. A printer must have at least three different ink colors but usually has more, for reasons we discuss in Figure A-39.
On a computer screen, each pixel is actually composed of three subpixels in the three fundamental colors: red, green, and blue.

No image is truly continuous, although many appear as though they are, so all representations are only approximations of reality and our perception relies strongly on the capabilities of our cognitive system.
In the previous section, we discussed five different situations in which an image is discretely represented. In the eye and the digital camera, each receptor generates a number to represent the intensity of the received signal. (Admittedly, this isn’t exactly the case with the retina, but the signal can be measured and quantified.) On photo paper, printed documents, and computer screens, the dots (or pixels) emit light according to some signal strength, which, in turn, can be represented with a number.
Using one number to represent signal strength is enough as long as we’re only dealing with grayscale images, for example, if we only consider the signal of rod cells or if we’re printing in black and white. If we introduce color, we need at least three values for each pixel or three types of cones in the retina.
An image on a computer requires one number per pixel to represent a grayscale image or (at least) three numbers per pixel to represent a color image. To keep the representation of a pixel from taking up too much space, all representations use integer numbers in a limited subrange. The subrange for pixel values is [0 to 255]. This subrange was chosen because it fits exactly into 1 byte of memory, which means a single color pixel will occupy 3 bytes.
So in a grayscale image, you have 256 possible gray levels for each pixel. In a color image, you have 256 possible values for each color, so you have 256 × 256 × 256, or 16, 777, 216 different color values. But professional photographers often prefer to use 2 bytes for each pixel, which results in the value subrange [0 to 65, 536]. Recall that 1 byte results in 28 × 256 possible values, so 2 bytes leads to 216 or 65,536 values. Whether our eyes can even distinguish such an enormous range of different values is open to debate.
Although most images can be stored in 3 bytes (one for each fundamental color), a pixel frequently uses 32 bits (or 4 bytes) because that size is more natural for a computer; it’s the size of the main processor’s registers (for most machines), and it’s a power of 2 (think binary). The extra byte may be used to represent other things, such as transparency.
Now you know that color pixels are represented by three numbers, but does this really allow you to represent all visible colors? Although this question is actually very complicated, the answer is—unfortunately—no.

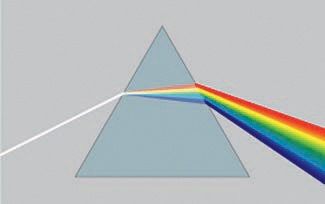
A simple (or monochromatic) color is characterized by its wavelength, and the wavelength ranges in the visible spectrum have common names. In Figure A-25, they are given in nanometers (nm). Note that these ranges are arbitrary approximations and are irregular: For instance, the range for violet is 60 nm, for yellow it’s 25 nm, and for red it’s 150 nm.
In addition, our visual perception system is not designed to distinguish between simple colors and complex colors. For example, pure light at 580 nm is yellow. But the eye cannot distinguish this pure yellow from a yellow obtained by a specific blend of red and green. Also, most colors in nature are not simple colors. You can’t find pink, brown, or purple in the rainbow. And white, black, and all shades of gray are also “colors” that appear in images because we can perceive them.
So most real colors are not monochromatic, and our perception system can’t distinguish between a monochromatic and a properly blended color anyway. The problem is that the representation using three numbers in a limited subrange does not allow us to represent all visible colors. For example, imagine these three numbers as coordinates in three-dimensional space. Because the coordinates are limited to the subrange [0 to 255], every point will lie inside a cube whose sides are 256 units long. The sides and corners of this cube have different meanings depending on the model used, as we’ll discuss in the next section. But points outside of the cube simply cannot be represented.
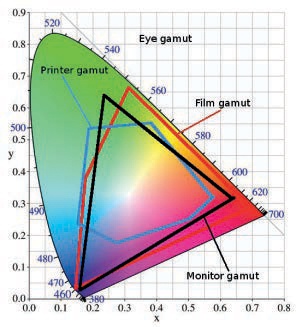
The full subset of colors that can be represented in a given system is called a (color) gamut. The Commission Internationale de l’Éclairage (CIE; the International Commission on Illumination) defined a model for the visible colors, represented in Figure A-26. Along the horseshoe curve we find the fully saturated colors of the rainbow, with blue numbers that indicate the corresponding wavelengths in nanometers [400-700]. The straight line at the bottom is the purple boundary. The content of the diagram is the whole set of visible colors based on normal human vision.
Material colors, obtained by mixing colored paints, for example, have more possibilities (a larger gamut) because black or white can be mixed with the colors. They would, therefore, require another dimension with values from black to white in the diagram.
This diagram is actually impossible to represent with complete accuracy, especially in a printed book. (It gives too much prominence to green and not enough to yellow, and the white point, located somewhere in the center, is not really white.) But the chromaticity diagram can be used to show the color gamuts of devices (also shown in Figure A-26). Some devices have a larger gamut than others, but all of them are smaller than the full visible gamut. The smallest one is that of the common inkjet printer, which is especially bad at representing vivid colors. The black triangle corresponds to cathode ray tube (CRT) monitors, but the gamut of a liquid crystal display device is very similar.
Being aware of the size of an image file is important, whether the image is stored in memory, on a disk, on a CD, or on a USB stick. Excessively large files can fill up a small storage space or slow down a processor. But even more important is to be aware of the size of the image that will be displayed on a screen, or printed, because an image file is created to be displayed.
For example, suppose we have an image that’s 1024 × 768 pixels (i.e., the size of a rather small computer screen). This image contains 786,432 pixels. If the image is grayscale (sometimes improperly called monochrome or black and white), its file size in bytes is the same as the number of pixels (around 768KB). If the image is in color, you need at least 3 bytes for each pixel, and the file size would be about 2.3MB.
On an LCD screen with a definition of 100 pixels per inch, this image displays as an approximately 10 × 8 inch rectangle. But on a laser printer with a definition of 600 pixels per inch, the image will be only 1.7 × 1.28 inches.
The definition of the representation device (such as a printer) is fundamental, and to make nice prints that are larger than a thumbnail, you must build rather large files. Modern digital cameras can capture 10 million pixels or more for a single image. A color image taken with one of these cameras is at least 30MB. At that size, only 25 photos would fit on a normal CD, and fewer than 150 would fit on a DVD. That’s also too large a file to send easily to friends and family via email.
Because of this, compressing images is necessary. There are two main compression techniques: lossless compression, where no data is lost and the image maintains its exact initial state, and lossy compression, where some data loss occurs and the resulting image is lower quality than the original.
Lossless compression reduces the image size in a meaningful way only if the image contains a large amount of redundant information. This typically occurs if the image file uses indexed representation. The number of different colors in an indexed image is limited, and these colors are stored in a colormap. The pixels are represented as indexes in this colormap, which results in an image with many identical pixels. The advantage of indexing is that the lossless compression rate is excellent, although the overall image quality is inherently worse than with direct representation. For example, Figure A-27 shows an image with a continuous color variation. Figure A-28 shows the same image after converting it to indexed mode with 256 colors (the maximum). For more information on indexing and colormaps, see Chapter 12 and Chapter 20.
Many image compression formats are available, but we cover only three here:
GIF is an indexed format with all the drawbacks that implies. It provides lossless compression, but if an image with continuous color variation is exported as a GIF, information is lost during indexing. GIF images also cannot contain continuous transparency. The format is best suited for diagrams, line drawings, and simple animations.
JPEG is a nonindexed format that uses a lossy compression technique, with a compression rate that the user can adjust. JPEG is the format of choice for photographs and is used as an output format by most digital cameras.
PNG can be used for both indexed and nonindexed images. With indexing, PNG has the same properties as GIF but with a better compression rate and the capability to represent continuous transparency. But PNG cannot represent animations. With nonindexed images, it provides lossless compression, which leads to a higher-quality final image than JPEG compression but at a lower compression rate.
File formats can have a major impact on image size and quality. Here’s some general advice for choosing the right format for an image:
If you’ve created the image yourself and it’s composed mostly of lines, text, and flat colors, use indexed PNG. Build the colormap with care.
If you create a simple animation, store it as a GIF.
If the image is a photograph, choose JPEG in most cases. But if you need to add text to the photograph, choose PNG. Do not increase the quality rate to more than 85 because doing so increases the file size without visible effect. Also, don’t convert the same image to JPEG multiple times because deterioration is cumulative.