
An image does not really exist if we can’t see it. We’re able to see things thanks to the complex and precise organ known as the eye. Our eyes produce the images we see by interpreting a small range of the electromagnetic spectrum known as the visible spectrum.
Figure A-1 is a diagram of the human eye, showing its main components. Light enters the eye through the pupil and is focused by the crystalline lens, and an image is formed in the back of the eye on the retina. The lens is flexible, and small muscles around it allow it to deform to change its focal length. This allows us to focus on objects at various distances. The diameter of the pupil is also variable, which provides a way to regulate the amount of light that enters the eye.
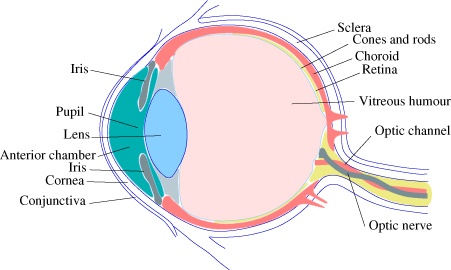
Figure A-2 shows a cross section of the retina. Its structure is a very complicated network of sensitive nerve cells. The cells that sense color and light are the rods and the cones. The main bodies of these cells are buried inside the retina. Light within the visible spectrum is received by the tail ends of the cells, shown on the far right of the cross section in Figure A-2.
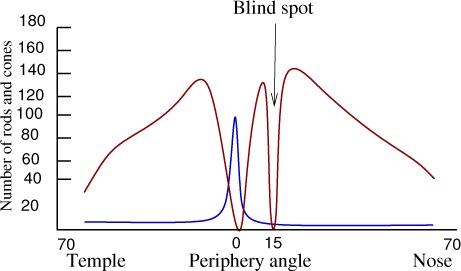
The rods in each eye number from 120 to 150 million and are located primarily on the periphery of the retina. Cones number only 6 to 7 million and are located primarily in the center of the retina, in the area called the fovea. Figure A-3 shows this variable distribution. It also shows the blind spot, which is the place in the retina where the optic nerve emerges from the eye.

You’re probably not aware of the blind spots that exist in your field of vision. Try this experiment to observe their effect: Close one eye, and look at a fixed point in front of you. Place a small object (such as your forefinger) in front of you at eye level and on the same side as your open eye (the distance between this object and your eye should be between 12 and 20 inches). Now slowly move the object toward your nose. When the angle between the fixed point in front of you and the moving object is about 15°, the object should disappear. Note that your perceptual and cognitive systems usually keep you from noticing this blind spot—your brain can reconstitute the missing information and fill in the gap.

Rods and cones differ in another very important way. Rods are quite sensitive to brightness but not to differences in wavelength. On the other hand, cones just need enough light to work, but they’re really sensitive to wavelength. Cones are divided into three categories, depending on the wavelength they’re sensitive to. As Figure A-4 shows, blue cones are most sensitive to a wavelength of around 420 nanometers (nm), which corresponds to the color blue. Green cones are most sensitive at around 534 nm, and red cones are most sensitive around 564 nm (which is actually yellow, not red). Also, blue cones represent only 1/50 of the total number; green cones represent approximately 2/5 of the total, and red cones represent approximately 3/5. The black curve in Figure A-4 illustrates the sensitivity range of rod cells.
This distribution of rods and cones has some interesting consequences:
When not enough light is available, we can’t distinguish different colors. For instance, imagine that you’re sitting in a garden just before dawn. Several cats are prowling around, and they all appear to be gray. When dawn arrives, the cats slowly regain their color—brown and orange—and the grass grows progressively greener as the sky brightens.
Only the center of the retina can perceive colors. But our cognitive system infers the colors in the periphery of our vision and adds them, so we don’t usually notice this limitation.
We have very few cones that are sensitive to blue (only 1/50 of the total), yet these cones are responsible for a relatively large range of wavelengths. This means that looking at a picture or landscape whose colors are primarily purple or blue is more tiresome for the eye, especially if the image contains a lot of fine detail. Distinguishing differences in brightness in a scene that contains a lot of blue is also more difficult.
So our perception of color results from the differences among signals sent to the brain by cones sensitive to different wavelengths of light. The color range we can see is defined by the wavelength range our cones are sensitive to. As you will see later, most colors are not defined by a single wavelength; such monochromatic colors can be generated by artificial devices, but natural colors are generally a mixture of various wavelengths. We can only sense monochromatic colors that correspond to one of the three cone types. For example, our eyes can’t distinguish a monochromatic yellow from a yellow made by combining red and green light. Because we don’t have cones specifically sensitive to yellow, the resulting signals from our red and green cones are the same regardless of whether the yellow is made from red and green light or from pure yellow light.
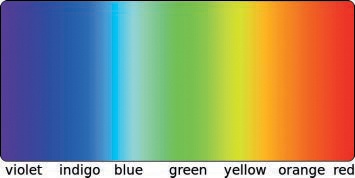
If we consider the visible spectrum as it’s traditionally represented (see Figure A-5), we might get the impression that it’s precisely bound on both sides and that it contains seven discrete colors. This overly simple view is not based on science. A more accurate illustration is shown in Figure A-6. The visible spectrum is a tiny subrange of the electromagnetic spectrum, without a blunt beginning or end. The visible spectrum has no real indigo color, and the red area is much larger than the others. The limits of the visible spectrum are fuzzy because the violet color disappears into ultraviolet, and the red color disappears into infrared. Additionally, the visible spectrum differs for some species: Birds and some insects can see ultraviolet.
Light coming from the sun is absorbed by Earth’s atmosphere at rates that vary depending on the wavelength. The visible spectrum is the segment of the electromagnetic spectrum that is best able to navigate through Earth’s atmosphere and reach its surface and the objects on it. But the atmosphere does scatter blue light more than red light, which explains why the sky looks blue to us (weather permitting).
Our perception of colors depends on a lot of factors, including our cognitive system. As we see in Figure A-6, red colors cover almost half of the visible spectrum, and red light has the longest wavelength of the visible colors. But our eye’s cones that are sensitive to the long wavelengths mainly perceive yellow. Despite this, we are normally able to distinguish a variety of different reds as well as orange and yellow.


Thus we see that our perception of colors is not simply a reception of signals emitted by the retina cells but rather a complex interpretation that occurs in the brain. When it works normally, this process allows us to differentiate colors and appreciate the effect of various color combinations.
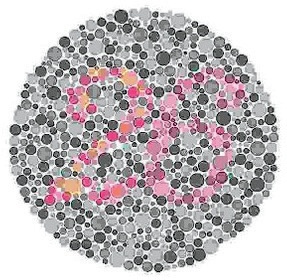
The most common abnormality of visual perception is called color blindness. You may have seen tests for color blindness before, such as those in Figure A-7 and Figure A-8.
The human eye normally contains three types of cones. But sometimes one or more of these is missing. (Many animals have only two types of cones.) If the red cones are missing, a person has a disorder called daltonism, also known as protanopia. Figure A-9 shows the colors of the rainbow as most people see them, and Figure A-10 shows how someone with protanopia sees them. This is the most frequent type of color blindness and is characterized by the dark appearance of the color red.

Missing green cones result in a disorder called deuteranopia (illustrated in Figure A-11). This type of color blindness is about as common as protanopia. Missing blue cones result in tritanopia (illustrated in Figure A-12). Tritanopia is extremely rare.


Anomalies also occur when all three types of cones are present but some of them are malformed and, as a result, inactive. Because they’re inactive, the malformed cones result in the same types of color blindness that missing cones do. There is also a very rare disorder called monochromacy, or total color blindness, which occurs when all the cones are missing or inactive. Figure A-13 shows what a rainbow would look like to someone with monochromacy.
Be aware of these abnormalities because they can affect the accessibility of images, books, and websites. For example, an image that depends entirely on the contrast between orange and green would be meaningless to a person with protanopia or deuteranopia. These two types of color blindness are present in 2% of all males, which is a significant number of people.
Whereas color blindness is a deficiency that affects a minority of the population, an optical illusion works on the majority of people. Optical illusions occur when our perception system partially fails and causes us to interpret something in a way that contradicts reality. Optical illusions are interesting for several reasons:
They provide hints that help us understand how our cognitive processes work.
They have inspired many artists to create fascinating pictures, for example, M.C. Escher, Salvador Dalí, Giuseppe Arcimboldo, and Victor Vasarely.
They are fun to create and experience and can be made with the help of GIMP.
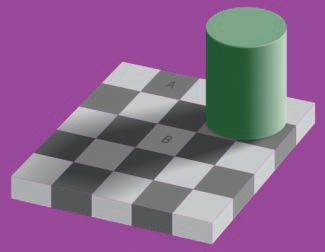
A literal optical illusion occurs when we see an image other than the one that was created. One of the best examples of this is Adelson’s checker-shadow illusion, shown in Figure A-14. The square labeled A appears to be much darker than the square labeled B, but they are actually the exact same shade of gray. We interpret the color of the second square based on the fact that it lies in the shadow of the green cylinder. The only way for most people to see the reality of the image is to create (using GIMP, of course) a parallelogram that links squares A and B and to fill in the parallelogram with the common shade of gray (see Figure A-15).

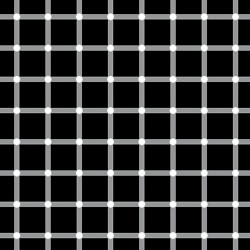
Physiological illusions occur due to excessive stimulation of some type, either of the eye itself or of the brain. For example, Figure A-16 shows the scintillating grid illusion. The intersections of the gray lines are white dots, but if you look at the center of the grid, you see black dots in distant intersections, appearing and disappearing quickly and at random. The Hermann grid is a similar illusion, but the white dots at the intersections are absent.
A third type of optical illusion is the cognitive illusion, which occurs due to unconscious inferences resulting from our assumptions about the world. Cognitive illusions can be divided into four categories.
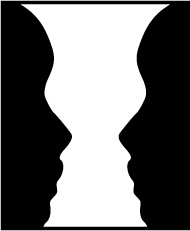
Rubin’s vase, illustrated in Figure A-17, is an example of the cognitive illusion known as an ambiguous illusion. This image can appear to be a vase or two facing profiles, depending on what the viewer perceives as the subject versus the background. The representation of a cube as a line drawing is another example of an ambiguous illusion. When you draw a simple cube, telling for certain which side is closest to the viewer and which is farthest away is impossible.
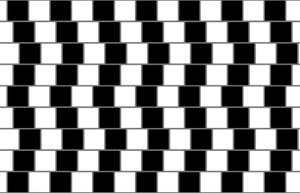
The café wall illusion, illustrated in Figure A-18, is a striking example of another type of cognitive illusion: a distorting illusion. The variable positions of the black squares create the illusion that the horizontal lines are curved, rather than parallel. To check that they are actually parallel, hold a ruler up to the image, with the zero at the top line, and move it along the lines. The distance between the lines is the same all the way across.
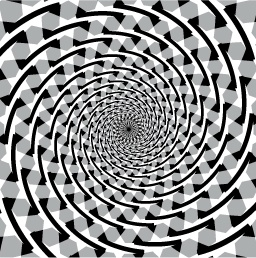
Fraser’s spiral, shown in Figure A-19, is another distorting illusion. Although it looks like a spiral, the image is actually composed of a set of concentric circles. If you’re skeptical, follow the outline of one of the circles with a pencil or place a circular object on top of the image.
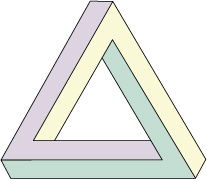
Penrose’s triangle, illustrated in Figure A-20, is an example of the cognitive illusion known as a paradox illusion. A paradox illusion appears to represent a three-dimensional solid form, but the form that it represents is actually impossible. M.C. Escher created some celebrated artwork that relied on this idea, like the impossible staircase shown in Figure A-21. The blivet, shown in Figure A-22, is another example of a paradox illusion.

