
Editing a Graph
Among the enabled channels, you can double-click one of the channel icons to make its curve editable. When a curve is editable, its keys are displayed along the graph, as shown in Figure 18.4, and its channel icon is surrounded with a border.

Moving and Adding Keys
When a curve is editable, you can select and drag its keys to change the curvature of the graph. Holding down the Alt/Opt key while dragging a key in the Timeline palette restricts the movement of the key to a vertical direction only; holding down the Ctrl/Cmd key lets you move the key only horizontally. You can also right-click on the graph and select the Add Keyframe option from the pop-up menu to add a new key to the graph.
To edit and manipulate keys in graph mode, follow these steps:
Open the Dune buggy.anme file from the Chapter 18 folder on the CD. This file includes a simple little car that is moving across a landscape, but the animation keys are rough, and we’ll use graph mode to adjust the car’s position.
Click the Graph Mode button at the top of the Timeline palette and select the Motion Graph tab. This makes several colored curves appear in the Timeline palette.
Click the channel icons to the left of the curves to disable all except the Layer Translation channel. This displays three lines, only one of which is curved. The other two are perfectly horizontal.
Double-click the Layer Translate channel icon to enter edit mode. This makes the keys appear along the curve.
Drag the Time slider to frame 39 and select the key at frame 39 that is on the middle thick line, which represents the Y axis, and drag it until the car is aligned with the background hill. Then do the same for the other new keys. Continue to add and edit the keys to match the car’s vertical position to the hill.
After the keys for the vertical position are completed, click the Layer Translate channel and double-click the Layer Z Rotation channel icon. Drag the Time slider to frame 25 and add a new key. Then drag the key upward until the rotation matches the hill. Continue to add and edit keys to match the motion of the car along the hill, as shown in Figure 18.5.
Click the Auto Zoom button to scale the Timeline palette so that the current keys are maximized in the palette. Figure 18.6 shows the resulting Timeline palette.


Changing Interpolation Type
The default interpolation type that is used on all new keys is set in the Options panel of the Preferences dialog box. You can open this dialog box using the Edit, Preferences menu.
New Feature
The ability to change the default interpolation type in the Preference dialog box is new to Anime Studio 6.
The right-click pop-up menu can also be used to change the interpolation type of the selected key. You need to right-click on a key to cause the interpolation options to appear in the pop-up menu. The various interpolation types are easy to see in graph mode. If multiple keys are selected, then selecting a new interpolation type will apply the option to all selected keys. For example, Figure 18.7 shows the graph using the Linear interpolation type.

Figure 18.8 shows the Ease In/Out interpolation type. Notice how the graph is altered to be almost a straight line as the graph approaches and leaves each key.

Figure 18.9 shows the Step interpolation type. This interpolation type keeps the current value until the next key is reached and then quickly changes to the new value, resulting in mostly straight lines.

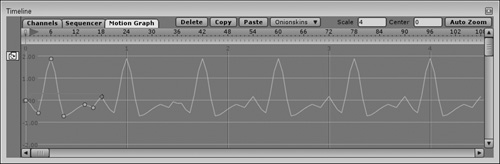
Figure 18.10 shows the Noisy interpolation type. This interpolation type jitters the animation value between keys, which results in some random motion.

Figure 18.11 shows the Cycle interpolation type. The entire motion has been scaled to the first 18 frames and then the final key has been set to cycle to frame 1. This causes the scaled keys to be repeated for the rest of the animation.
To edit and manipulate keys in graph mode, follow these steps:
Open the Dancing fruit.anme file from the Chapter 18 folder on the CD. This file includes several fruit characters on different layers.
Click the Motion Graph tab at the top of the Timeline palette and click the Enable Graph Mode option.
Select the cherry layer in the Layers palette; then double-click the Layer Translation channel in the Timeline palette. This makes the curves and the keys for this channel visible. The only key for this channel is at frame 0. Right-click this key and select the Noisy interpolation type. In the Noisy Interpolation dialog box that appears, set the Amplitude to 0.1 and the Scale to 2.
Select the banana layer in the Layers palette and double-click the Layer Z Rotation channel in the Timeline palette. Right-click the key at frame 0 and select the Noisy option. Click the OK button to accept the default values.
Select the orange layer in the Layers palette and double-click the Layer Scale channel in the Timeline palette. Right-click the key at frame 0 and select the Noisy option. Click the OK button to accept the default values.
Select the apple layer in the Layers palette, click the Settings button at the top of the Timeline palette, and enable the Layer Shear channel. Then close the Timeline Settings dialog box and double-click the Layer Shear channel in the Timeline palette. Right-click the key at frame 0 and select the Noisy option. Click the OK button to accept the default values. Figure 18.12 shows the dancing fruit.

Zooming in on the Edited Keys
When a curve is in edit mode, you can use the Auto Zoom button at the top of the Timeline palette to zoom in on the curve that you are editing. This expands the value scale so that the lowest value is positioned at the bottom of the Timeline palette and the highest key is positioned at the top of the Timeline palette, as shown in Figure 18.13.

Tip
You can also auto-zoom the edit graph by pressing the End key.