
Introduction to the Dashboard
,The biggest change and welcome addition to the Monitoring Server reports page is the Dashboard. The Dashboard is broken up into four distinct areas or panes: System Usage, Per User Call Diagnostics, Call Reliability Diagnostics, and Media Quality Diagnostics. By default, the Dashboard shows this week and a six-week view. However, a monthly view is also available by clicking a link in the upper-right corner of the screen.
Table 7.1 shows System Usage, which is the first section. Although many of the fields are self-explanatory, they are useful for at-a-glance looks at the environment. For example, the total A/V Conference minutes item is great for back-of-the-napkin ROI on savings Lync Server provides overly outsourced conferencing services. Possibly even more importantly, it gives a snapshot of how your users use Lync Server. Are they using Communicator as a soft phone? Do they use application sharing? Has overall collaboration time increased since Lync Server was implemented? This report isn’t the end-all for these answers, but it does provide an insightful view.
Table 7.1 The System Usage Section of the Dashboard


Table 7.2 shows the Per-User Call Diagnostics section. This is a great at-a-glance view of the overall health of your voice deployment. It also makes for great bragging rights in a well-planned deployment.
Table 7.2 Per-User Call Diagnostic Section of the Dashboard

Table 7.3 shows the Call Reliability Diagnostics section, which provides a deeper view into the health of your UC deployment and a window into the end-user experience. This is something new to Lync Server and is a valuable resource to administrators.
Table 7.3 Call Reliability Diagnostics Section of the Dashboard
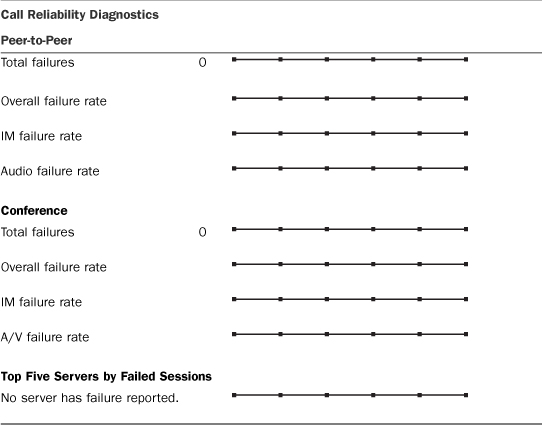
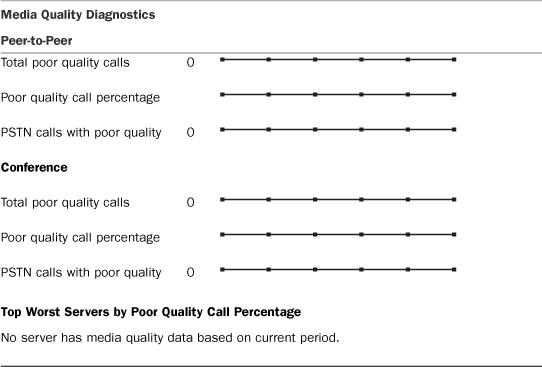
Table 7.4 shows the last section, which is Media Quality Diagnostics. This table gives information about the quality of calls in terms of total poor quality calls and percentage of poor quality calls compared to the total number of calls. It also offers the same metrics for conferences.
Table 7.4 Media Quality Diagnostics Section of the Dashboard
From the main Monitoring Server reports page, Figure 7.10, there is a plethora of reports to review. The next section summarizes each report in the order it is presented on the main page. Also, following is a full list of the available reports. You can see that they are a deeper look at the snapshots presented in the Monitoring Server reporting dashboard.
• System Usage Reports
• User Registration Report
• Peer-to-peer Activity Summary Report
• Conference Summary Report
• PSTN Conference Summary Report
• Response Group Service Usage Report
• IP Phone Inventory Report
• Per-User Diagnostics Reports
• User Activity Report
• Call Reliability Diagnostics Reports
• Call Reliability Summary Report
• Peer-to-Peer Activity Reliability Report
• Conference Reliability Report
• Top Failures Report
• Failure Distribution Report
• Media Quality Diagnostics Reports
• Media Quality Summary Report
• Server Performance Report
• Location Report
• Device Report
Figure 7.10 Monitoring Server Reports Main Page

The following list shows the reports available to an administrator from the main reports page.
• User Registration Report—Shows user registrations over time. This can be useful to determine peak login times and AD authentication requirements.
• Peer-to-Peer Activity Summary Report—Shows peer-to-peer activity including IMs, application sharing, and file transfers.
• Conference Summary Report—Measures conference metrics including Communicator conferences and PSTN conferences, the number of organizers, and the total conference minutes.
• PSTN Conference Summary Report—Contains data specific to PSTN conferences in Lync Server.
• Response Group Service Usage Report—Metrics for Response Groups including agent responses and the number of calls answered by the response group.
• IP Phone Inventory Report—Statistics about the number and type of IP phones in the Lync Server deployment. The report includes all Communicator Phone Edition devices.
• User Activity Report—This report reviews user-focused call failures for person-to-person calls and conferences. This report is useful for measuring the overall health of your conferencing deployment.
• Call Reliability Summary Report—A high-level view of failed calls, total call minutes, and other call metrics.
• Peer-to-Peer Activity Reliability Report—Contains information about failures in peer-to-peer activities, including IMs and collaboration activity.
• Conference Reliability Report—Reports on failures during IM, peer-to-peer calls, and PSTN conferences.
• Top Failures Report—A snapshot view of the top failures in the organization. This report can reveal systemic problems and configuration issues.
• Failure Distribution Report—Statistics about the failures related to the site or pool. This report is a great troubleshooting tool for finding error conditions.
• Media Quality Summary Report—Overall high-level view of media quality across the whole environment. This report should be referenced often to review the overall health of your voice deployment.
• Server Performance Report—This report breaks down media quality metrics by server. This is especially important in deployments that utilize separate mediation servers.
• Location Report—The Location Report reviews media quality statistics by location defined in Lync Server or by individual users.
• Device Report—Similar to the Location Report, the Device Report pivots media quality data by the type of device used when a failure is experienced.
Although some of the reports might initially seem similar, all of them examine the data from a different, unique angle. These reports are critical in proactively monitoring the health of your Lync Server environment. A wise administrator leverages these reports along with a monitoring platform such as Microsoft System Center Operations Manager.