
- Title Page
- Copyright Page
- Dedication
- Contents at a Glance
- Table of Contents
- About the Authors
- Acknowledgments
- We Want to Hear from You!
- Reader Services
- Introduction
- Part I. Overview
- Chapter 1. What Is Microsoft Lync Server?
- Chapter 2. What Is New in Microsoft Lync Server?
- Introducing New Management Tools
- Topology Changes
- New Enterprise Voice Features
- New Call Management Features
- Integrated Mediation Server
- New Presence Features
- New Conferencing Features
- DNS Load Balancing
- Survivable Branch Appliances
- Operating System Support
- New Lync Client Features
- Client Appearance
- The “Me” Area
- Enhanced Contacts
- Privacy Relationships
- Integration with Office and Windows 7
- Whiteboarding and Application Sharing
- Improved Meeting Join Experience
- Conferencing Attendant and Scheduling
- PSTN Dial-In Conferencing Improvements
- Video Improvements
- Manager/Admin Improvements
- Improved Phone Experience
- Summary
- Chapter 3. Feature Overview of Microsoft Lync Server
- Chapter 4. Benefits of Microsoft Lync Server 2010
- Part II. Microsoft Lync Server 2010 Server Roles
- Chapter 5. Microsoft Lync Server 2010 Front End
- Chapter 6. Microsoft Lync Server 2010 Edge
- Chapter 7. Microsoft Lync Server 2010 Monitoring
- Overview
- Installation
- Configuration
- Administration
- Troubleshooting
- Best Practices
- Summary
- Chapter 9. Director
- Part III. External Dependencies
- Chapter 10. Dependent Services
- Chapter 11. SQL
- Chapter 12. Firewall and Security Requirements
- Part IV. Administration and Management
- Chapter 13. Monitoring Microsoft Lync Server 2010
- Overview
- OpsMgr Lync Server 2010 Monitoring
- What Is New in OpsMgr R2?
- How OpsMgr Works
- OpsMgr Architecture
- How to Use OpsMgr
- OpsMgr Component Requirements
- Advanced OpsMgr Concepts
- Understanding OpsMgr Deployment Scenarios
- Multiple Configuration Groups
- Deploying Geographic-Based Configuration Groups
- Deploying Political or Security-Based Configuration Groups
- Sizing the OpsMgr Database
- Defining Capacity Limits
- Defining System Redundancy
- Monitoring Nondomain Member Considerations
- Securing OpsMgr
- Installing Operations Manager 2007 R2
- Installing Edge Component Monitoring Certificates
- Installing the Lync Server 2010 Management Pack
- Best Practices
- Summary
- Chapter 14. Backup and Restore of Microsoft Lync Server 2010
- Chapter 15. Administration of Microsoft Lync Server 2010
- Chapter 13. Monitoring Microsoft Lync Server 2010
- Part V. Migrating from Older Versions
- Part VI. Voice
- Chapter 17. PBX Integration
- Chapter 18. Enterprise Voice
- Chapter 19. Audio Conferencing
- Part VII. Integration with Other Applications
- Chapter 20. Exchange 2010 and SharePoint 2010 Integration
- Overview
- Exchange 2010 Unified Messaging
- Call Answering Rules
- Exchange 2010 Unified Messaging Architecture
- Unified Messaging Users
- UM Web Services
- Supported IP/VoIP Hardware
- Unified Messaging Protocols
- Unified Messaging Installation
- Postinstall Configuration
- Data Storage in Unified Messaging
- Exchange 2010 Outlook Web Application
- SharePoint 2010 Integration
- Best Practices
- Chapter 21. UCMA
- Chapter 20. Exchange 2010 and SharePoint 2010 Integration
- Part VIII. Clients
- Chapter 22. Microsoft Communicator Client for Macintosh
- Chapter 23. Windows, Browser, and Silverlight Clients
- Chapter 24. UC Endpoints
- Part IX. Planning for Deployment
- Chapter 25. Virtualization
- Chapter 26. Planning for Internal Non-Voice Deployment
- Chapter 27. Planning for Deploying External Services
- Chapter 28. Planning for Voice Deployment
- Index
Activity Monitor
,Undoubtedly, the Reliability and Performance Monitor is a great tool for administrators to monitor resource usage; however, an administrator should first leverage the SQL Server Activity Monitor, shown in Figure 11.19, when needing to gain insight into a SQL Server system’s performance. In SQL Server 2008, the Activity Monitor introduced a new performance dashboard with intuitive graphs and performance gauges with drill-down and filtering capabilities. The new tool’s look and feel is similar to the Reliability and Performance Monitor, but the information captured is broken down into five main sections dedicated to SQL Server performance monitoring.
Figure 11.19 The Activity Monitor
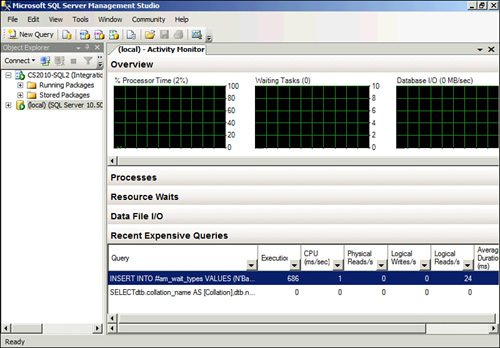
The sections are Overview, Processes, Resource Waits, Data File I/O, and Recent Expensive Queries. In SQL Server 2008 R2, right-click a SQL Server instance within Object Explorer and specify the Activity Monitor to launch the tool, as shown in Figure 11.19.
• Overview—This section shows the graphical display of Processor Time (%), Number of Waiting Tasks, Database I/O (MB/Sec), and the Number of Batch Requests/second.
• Processes—This section lists all the active users who are connected to the SQL Server database engine. This is beneficial for administrators because they can click the session IDs, run a SQL Server Profiler trace to capture all its activities, or even kill a specific process.
• Resource Waits—This section displays resource waits vertically, based on wait categories: CPU, SQLCLR, Network I/O Latch, Lock, Logging, Memory, Buffer I/O, Buffer Latch, and Compilation. From a horizontal perspective, the Wait Time, Recent Wait Time, Average Waiter Counter, and Cumulative Wait Time metrics are published for each Wait Category. Analogous to the Processes section, data can be filtered based on items within a column.
• Data File I/O—This displays disk-level I/O information related to all the data and log files of user and system databases. Administrators can use this to rapidly recognize databases that are performing badly because of disk bottlenecks.
• Recent Expensive Queries—This last section gives administrators the opportunity to capture the queries that are performing the worst and negatively influencing a SQL Server instance. Approximately 10 to 15 of the worst and most expensive queries are displayed in the performance dashboard. The actual query is displayed with augmenting metrics such as Execution in Minutes, CPU ms/sec, Physical Reads/sec, Logical Write/sec, Logical Reads/sec, Average Duration in ms, and Plan Count. It is also possible to right-click the most expensive query and show the execution plan.
-
No Comment