They can be hard to BEAR (get it?)
17.43 Plot the graph of the polar equation r = 3.
The equation r = 3 describes the set of points that are r = 3 units away from the pole. All points in the plane that are a fixed distance r from a point (in this case the pole), form a circle of radius r around that point (called the center). In other words, r = 3 is the polar equation for a circle with radius 3 that is centered at the pole.

17.44 Based on your answer to Problem 17.43, construct the polar equation of a circle with radius 5 that is centered at the pole.
All points on the circle are a distance of r = 5 from the pole, so the polar equation is r = 5.
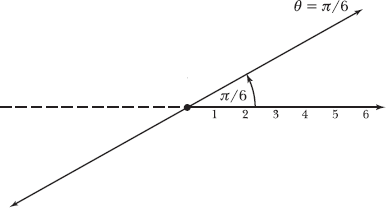
17.45 Plot the graph of polar equation ![]()
All of the points on the graph of θ = π/6 lie either on the ray that is π/6 radians from the polar axis in the counterclockwise direction or on the opposite ray. Thus, the graph is a line consisting of that ray and its opposite ray.
If r > 0, then the points have angular coordinate ![]() If r < 0, then the points have angular coordinate
If r < 0, then the points have angular coordinate ![]()
17.46 Based on your answer to Problem 17.45, express the y-axis of the rectangular coordinate system in polar form.
The y-axis of the rectangular coordinate system forms an angle measuring θ = π/2 with the positive x-axis (or polar axis). Thus, one polar equation representing the y-axis is θ = π/2. Other correct solutions include (but are not limited to): θ = 5π/2, θ = –π/2, and θ = –5π/2.
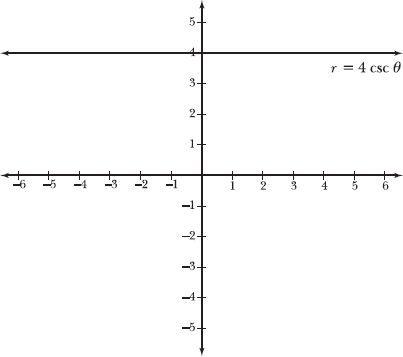
17.47 Rewrite the polar equation r = 4csc θ in rectangular form and graph it.
Rewrite the cosecant function in terms of sine.

Cross-multiply to eliminate the fraction.
rsin θ = 4
As Problem 17.30 explains, y = rsin θ.
y = 4
Thus, r = 4csc θ is equivalent to the rectangular equation y = 4, the horizontal line 4 units above the x-axis.
17.48 Graph the polar equation r = 1 + 2sin θ by constructing a table of values that includes the following values of θ.
Plug 13 different values into θ to figure out the corresponding value of r. This gives you 11 points on the graph (in polar form).
![]()
Substitute each value of θ into the equation r = 1 + 2sin θ.

Plot each of the points generated by the table of values to create the following graph, called a limaçon.
17.49 Plot the graph of the polar equation: r = 2 sin3θ.
Apply the technique demonstrated in Problem 17.48, creating the table of values that contains the following points: (0, 0), (π/6, 2), (π/3, 0), (π/2, –2), (2π/3, 0), (5π/6, 2), and (π, 0). This polar graph is called a three-petal rose curve.

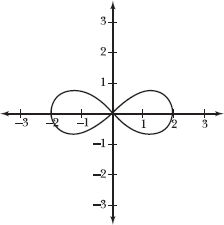
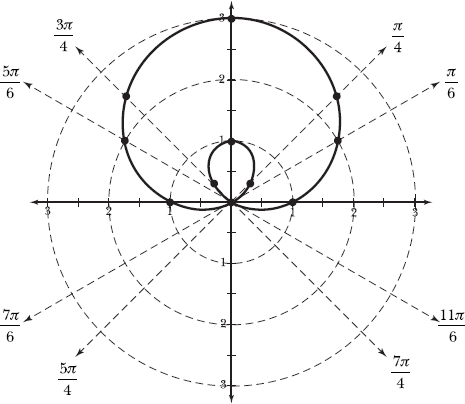
Substitute unit circle values into θ to generate the points on the graph. For example, substituting θ = π into the equation produces the following values of r.
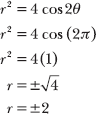
Thus, (2,π) and (–2,π) are points on the polar graph, which is called a lemniscate.