 Lync Server Logging Tool
by Tom Pacyk, Andrew Abbate, Alex Lewis
Microsoft® Lync Server 2010 Unleashed
Lync Server Logging Tool
by Tom Pacyk, Andrew Abbate, Alex Lewis
Microsoft® Lync Server 2010 Unleashed
- Title Page
- Copyright Page
- Dedication
- Contents at a Glance
- Table of Contents
- About the Authors
- Acknowledgments
- We Want to Hear from You!
- Reader Services
- Introduction
- Part I. Overview
- Chapter 1. What Is Microsoft Lync Server?
- Chapter 2. What Is New in Microsoft Lync Server?
- Introducing New Management Tools
- Topology Changes
- New Enterprise Voice Features
- New Call Management Features
- Integrated Mediation Server
- New Presence Features
- New Conferencing Features
- DNS Load Balancing
- Survivable Branch Appliances
- Operating System Support
- New Lync Client Features
- Client Appearance
- The “Me” Area
- Enhanced Contacts
- Privacy Relationships
- Integration with Office and Windows 7
- Whiteboarding and Application Sharing
- Improved Meeting Join Experience
- Conferencing Attendant and Scheduling
- PSTN Dial-In Conferencing Improvements
- Video Improvements
- Manager/Admin Improvements
- Improved Phone Experience
- Summary
- Chapter 3. Feature Overview of Microsoft Lync Server
- Chapter 4. Benefits of Microsoft Lync Server 2010
- Part II. Microsoft Lync Server 2010 Server Roles
- Chapter 5. Microsoft Lync Server 2010 Front End
- Chapter 6. Microsoft Lync Server 2010 Edge
- Chapter 7. Microsoft Lync Server 2010 Monitoring
- Overview
- Installation
- Configuration
- Administration
- Troubleshooting
- Best Practices
- Summary
- Chapter 9. Director
- Part III. External Dependencies
- Chapter 10. Dependent Services
- Chapter 11. SQL
- Chapter 12. Firewall and Security Requirements
- Part IV. Administration and Management
- Chapter 13. Monitoring Microsoft Lync Server 2010
- Overview
- OpsMgr Lync Server 2010 Monitoring
- What Is New in OpsMgr R2?
- How OpsMgr Works
- OpsMgr Architecture
- How to Use OpsMgr
- OpsMgr Component Requirements
- Advanced OpsMgr Concepts
- Understanding OpsMgr Deployment Scenarios
- Multiple Configuration Groups
- Deploying Geographic-Based Configuration Groups
- Deploying Political or Security-Based Configuration Groups
- Sizing the OpsMgr Database
- Defining Capacity Limits
- Defining System Redundancy
- Monitoring Nondomain Member Considerations
- Securing OpsMgr
- Installing Operations Manager 2007 R2
- Installing Edge Component Monitoring Certificates
- Installing the Lync Server 2010 Management Pack
- Best Practices
- Summary
- Chapter 14. Backup and Restore of Microsoft Lync Server 2010
- Chapter 15. Administration of Microsoft Lync Server 2010
- Chapter 13. Monitoring Microsoft Lync Server 2010
- Part V. Migrating from Older Versions
- Part VI. Voice
- Chapter 17. PBX Integration
- Chapter 18. Enterprise Voice
- Chapter 19. Audio Conferencing
- Part VII. Integration with Other Applications
- Chapter 20. Exchange 2010 and SharePoint 2010 Integration
- Overview
- Exchange 2010 Unified Messaging
- Call Answering Rules
- Exchange 2010 Unified Messaging Architecture
- Unified Messaging Users
- UM Web Services
- Supported IP/VoIP Hardware
- Unified Messaging Protocols
- Unified Messaging Installation
- Postinstall Configuration
- Data Storage in Unified Messaging
- Exchange 2010 Outlook Web Application
- SharePoint 2010 Integration
- Best Practices
- Chapter 21. UCMA
- Chapter 20. Exchange 2010 and SharePoint 2010 Integration
- Part VIII. Clients
- Chapter 22. Microsoft Communicator Client for Macintosh
- Chapter 23. Windows, Browser, and Silverlight Clients
- Chapter 24. UC Endpoints
- Part IX. Planning for Deployment
- Chapter 25. Virtualization
- Chapter 26. Planning for Internal Non-Voice Deployment
- Chapter 27. Planning for Deploying External Services
- Chapter 28. Planning for Voice Deployment
- Index
Lync Server Logging Tool
,When all else fails and the problem cannot be diagnosed, perform a diagnostic trace of the server traffic. Included with the installation of any Lync Server role is the Lync Server Logging Tool. This application can be found within the Start menu under the Microsoft Lync Server 2010 program group. This tool is valuable when troubleshooting Lync Server problems because it provides insight into what is happening at the protocol level.
The most common type of tracing done with this tool is to capture the SIP traffic between servers or clients to determine a potential problem. Other traditional types of tracing tools, such as Wireshark, are unable to analyze the Lync Server SIP traffic because it is encrypted using TLS security. When running the logging tool locally on a server, it is able to decrypt the TLS security so that all the SIP messaging becomes readable. Running the Lync Server Logging Tool does not disrupt the server traffic and can be done while users are actively using the system.
To get started, open the Lync Server Logging Tool (see Figure 15.5).
Figure 15.5 Lync Server Logging Tool
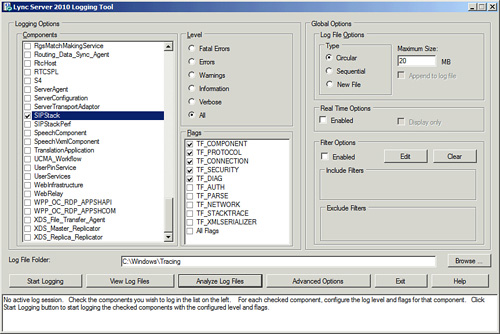
To capture the SIP traffic, perform the following steps:
1. Check the box labeled SIP Stack.
2. Click Start Logging.
3. Reproduce the issue that is driving the troubleshooting.
4. Click Stop Logging when the issue has been experienced again.
At this point, an administrator has two options. The first is to click View Log Files to display the logs in text format. This can be difficult to read and troubleshoot because SIP conversations include many lines. For a better experience, first install the Lync Server 2010 Resource Kit Tools. The Snooper tool provides a much cleaner view of a SIP conversation.
1. After the Resource Kit Tools are installed, click the Analyze Log Files button.
2. Verify that the SIP Stack is still selected and click Analyze.
3. Snooper should open automatically and display the conversation. Click the Messages tab to view the SIP conversation.
A message-by-message view of the conversation is located on the left side. Clicking any of the lines change the view in the right-side pane to display the entire SIP message selected. Error messages are highlighted in red for easy identification. A search bar, where keywords such as a username or phone number are entered, is located at the top of the window. After entering a search string and pressing Enter, the view is filtered to only display messages with that string. This kind of filtering can be useful when searching for problems with a single user because it removes all the other traffic through the server.
Figure 15.6 displays a sample SIP trace using the Snooper tool.

Note
The example traces a SIP conversation, but the Lync Server Logging Tool is capable of tracing every component of the product. When opening the tool, all the different components are displayed and can be selected. Many of the names are tough to decipher, and most only need to be traced when requested by a Microsoft support professional. In many cases, tracing the SIP Stack determines the main issue.
-
No Comment