
After you create a chart in Excel, you might want to display it in a document or presentation. You can present information in chart format in a Word document or on a PowerPoint slide in two ways:
You can insert or link to an existing chart that you create in an Excel workbook.
You can create a chart directly in the document or presentation. The data you create the chart from will be stored as part of the document or presentation, not as a separate file. You can edit the embedded chart data in Excel.
A simple way to show an externally created chart on a document page or on a slide is to display both the chart and its destination, and then drag the chart by its frame from the worksheet or chart sheet to the page or slide. The inserted chart picks up the formatting of the document or presentation.
Alternatively, you can insert an existing chart from a workbook by following these steps:
In the workbook, ensure that the chart is saved on its own chart sheet.
In Word or PowerPoint, place the insertion point where you want the chart to be.
On the Insert menu, click Object.
The Object dialog box opens.
In the Object dialog box, click Microsoft Excel Chart, and then in the lower-left corner, click From File.
The Insert As Object dialog box opens.
In the Insert as Object dialog box, navigate to and click the workbook containing the chart you want to insert.
If you want to maintain a link from the inserted chart to the source workbook, select the Link to File check box.
If you select this check box, changes to the chart in the source workbook will be reflected in the inserted chart. Otherwise, the data source for the inserted chart will be a separate copy of the original.
If you want to insert an icon linking to the source workbook, rather than inserting the chart itself, select the Display as Icon check box.
Selecting this check box inserts an icon representing the source workbook, and the source workbook name. Double-clicking the icon opens the source workbook if you also selected the Link To File check box, or a copy of the source workbook if you didn’t.
In the Insert as Object dialog box, click Insert.
The first chart sheet in the selected workbook appears in the document or slide.
Double-clicking the embedded chart opens either the original workbook (if you linked to the file) or a copy of the original workbook (if you didn’t). If the file contains other chart sheets, you can change the chart displayed in the Word document by activating that chart sheet and then closing the workbook window.


If you want to create a chart for use in only a specific document or presentation, you can create the chart directly from Word or PowerPoint (although you will still end up working in Excel). When you create a chart in a document or presentation, a sample chart is embedded in the document. The data used to plot the sample chart is stored in an Excel worksheet that is incorporated into the Word file. (You don’t have to maintain a separate Excel file.) Then you modify the sample chart data to reflect the data you want to display, format the chart in the same way that you would in Excel, and you’re done.
To create a chart directly in a document or presentation:
In a document, position the insertion point where you want the chart to appear.
Or
In a presentation, display the slide in which you want to insert the chart.
On the Insert menu, click Chart.
Or
Display the Charts tab of the Elements Gallery.
Or
On a slide that includes a content control, click the Insert Chart thumbnail.
Filter the Charts gallery to locate the type of chart you want to insert, and then click the chart thumbnail.
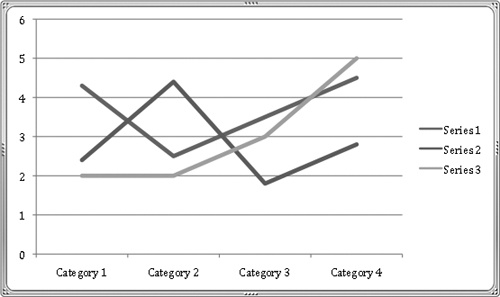
Excel starts, if it isn’t already running, and displays a generic data table depicting four categories (x-axis values) and three series (y-axis values). The title bar indicates that the data you’re viewing is linked to the chart in the Word document or PowerPoint presentation.
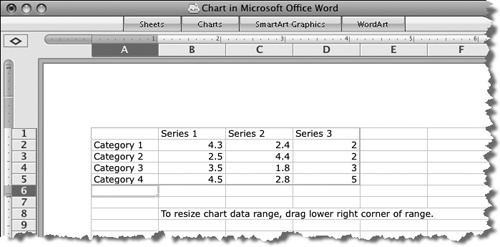
The corresponding chart appears in the document or slide, which is now behind the workbook.
Changing the data in the data table dynamically updates the chart. You can resize and arrange the workbook and document or presentation windows to see the effect on the chart of changes you make to the data in the workbook.
Closing the Chart in Microsoft Office Word or Chart in Microsoft Office PowerPoint workbook returns you to the document or slide.
To make changes to an embedded chart:
Right-click the chart, and then click Edit Data to open the workbook containing the chart data.
Right-click any chart element (legend, axes, gridlines, and other element) to display formatting options for that element.
Double-click a data series to display the Format dialog box for the data series, in which you can format the fill, line, shadow, scale, plot direction, data labels, or other settings appropriate to the chart type.
On the Charts tab of the Elements Gallery, click a different chart type to change the chart without affecting the data.
In general, you can make changes to an embedded chart in the same way you would to a chart in a workbook.