
Once you’ve created the surface model, it is time to communicate the model’s information in various formats. This includes labeling contours, creating legends for the analysis you’ve created, or adding spot labels. These exercises work through these main labeling requirements and building styles for each.
Contour Labeling
The most common requirement is to place labels on surface-generated contours. In Land Desktop, this was one of the last steps because a change to a surface required erasing and replacing all the labels. Once labels have been placed, their styles can be modified.
Placing Contour Labels
Contour labels in Civil 3D are created by special lines that understand their relationship with the surface. Everywhere one of these lines crosses a contour line, a label is applied. This label’s appearance is based on the style applied and can be a major, minor, or user-defined contour label. Each label can have styles selected independently, so using some AutoCAD selection techniques can be crucial to maintaining uniformity across a surface. In this exercise, you’ll add labels to your surface and explore the interaction of contour label lines and the labels themselves.
1. Open the SurfaceLabeling.dwg file.
2. Select the surface in the drawing to display the Tin Surface tab. On the Labels & Tables panel, select Add Labels Contour – Single.
3. Pick any spot on a green major contour to add a label.
4. On the Labels & Tables panel, select Add Labels Contour – Multiple.
5. Pick a point on the north and then a second point to the south, crossing a number of contours in the process. Press ↵ to end the picking.
6. On the Labels & Tables panel, select Add Labels Contour – Multiple – At Interval.
7. Pick a point near the middle right of the site and a second point across the site to the east.
8. Enter 200 at the command line for an interval value.
You’ve now labeled your site in three ways to get contour labels in a number of different locations. You will need additional labels in the northeast and southwest to complete the labeling, because you did not cross these contour objects with your contour label line. You can add more labels by clicking Add, but you can also use the labels created already to fill in these missing areas. By modifying the contour line labels, you can manipulate the label locations and add new labels. In this exercise, you’ll fill in the labeling to the northeast:
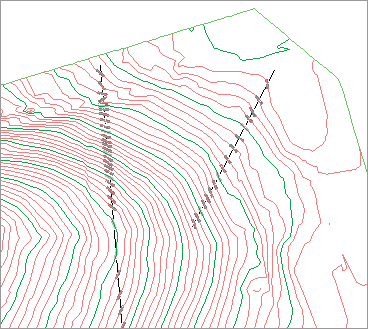
1. Zoom to the northeast portion of the site, and notice that some of the contours are labeled only along the boundary or not at all, as shown in Figure 4-49.
Figure 4-49: Contour labels applied
2. Zoom in to any contour label placed using the Contour – Single button, and pick the text. Three grips will appear. The original contour label lines are quite apparent, but in reality, every label has a hidden label line beneath it.
3. Grab the northernmost grip and drag across an adjacent contour, as shown in Figure 4-50. New labels will appear everywhere your dragged line now crosses a contour.
Figure 4-50: Grip-editing a contour label line
4. Drop the grip somewhere to create labels as desired.
By using the created label lines instead of adding new ones, you’ll find it easier to manage the layout of your labels.
Surface Point Labels
In every site, there are points that fall off the contour line but are critical. In an existing surface, this can be the low point in a pond or a driveway that has to be matched. When you’re working with commercial sites, the spot grade is the most common review element. One of the most time-consuming issues in land development is the preparation of grading plans with hundreds of individual spot grades. Every time a site grading scheme changes, these are typically updated manually, leaving lots of opportunities for error.
With Civil 3D’s surface modeling, spot labels are dynamic and react to changes in the underlying surface. By using surface labels instead of points or text callouts, you can generate a grading plan early on in the design process and begin the process of creating sheets. In this section, you’ll label surface slopes in a couple of ways, create a single spot label for critical information, and conclude by creating a grid of labels similar to many estimation software packages.
Labeling Slopes
Beyond the specific grade at any single point, most grading plans use slope labels to indicate some level of trend across a site or drainage area. Civil 3D can generate the following two slope labels:
- One-point slope labels indicate the slope of an underlying surface triangle. These work well when the surface has large triangles, typically in pad or mass grading areas.
- Two-point slope labels indicate the slope trend on the basis of two points selected and their locations on the surface. A two-point slope label works by dividing the surface elevation distance between the points by the planar distance between the pick points. This works well in existing ground surface models to indicate a general slope direction but can be deceiving in that it does not consider the terrain between the points.
In this exercise, you’ll apply both types of slope labels, and then look at a minor style modification that is commonly requested:
1. Open the SurfaceSlopeLabeling.dwg file.
2. Select the surface to display the Tin Surface tab. On the Labels & Tables panel, select Add Labels Slope.
3. At the command line, press ↵ to select a one-point label style.
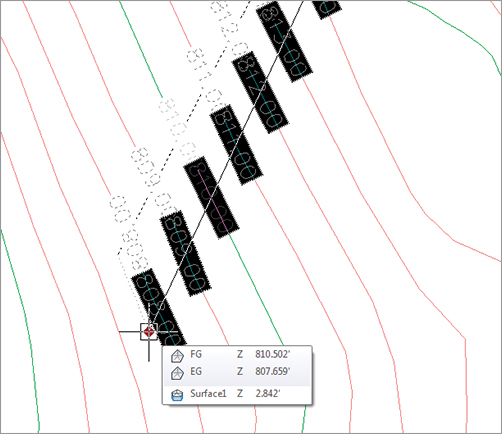
4. Zoom in on the circle drawn on the western portion of the site and use a Center snap to place a label at its center, as shown in Figure 4-51.
Figure 4-51: A one-point slope label

5. Press Esc or ↵ to exit the command.
6. Select the surface to display the Tin Surface tab. On the Labels & Tables panel, select Add Labels Slope.
7. At the command line, press T to switch to a two-point label style.
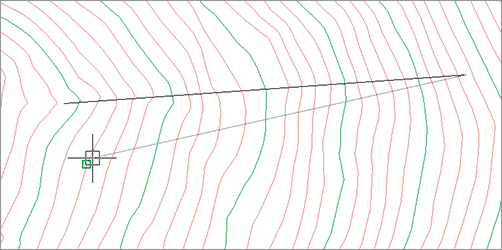
8. Pan to the southwest portion of the site, and use an Endpoint snap to pick the northern end of the line shown in Figure 4-52.
Figure 4-52: First point in a two-point slope label
9. Use an Endpoint snap to select the other end of the line to complete the label, and press Esc or ↵ to exit the command.
This second label indicates the average slope of the property. By using a two-point label, you get a better understanding of the trend, as opposed to a specific point.
Critical Points
A typical grading plan is a sea of critical points that drive the site topography. In the past, much of this labeling and point work was done by creating coordinate geometry (COGO) points and simply displaying their properties. Although this is effective, it has two distinct disadvantages. First, these points are not reflective of the design but part of the design. This makes the sheet creation a part of the grading process, not a parallel process. Second, the addition of COGO points to any drawing and project when they’re not truly needed just weighs down the design model. Point management is a mentally intensive task, and anything that can limit extraneous data is worth investigating.
Surface labels react dynamically to the surface and to the point of insertion. Moving any of these labels would update the information to reflect the surface underneath. This relationship makes it possible for one user to place labels on a grading plan while the final surface is still in flux. A change in the proposed surface is reflected in an update from the project, and an updated sheet can be on the plotter in minutes.
Surface Grid Labels
Sometimes, more than a few points are requested. Estimation software typically creates a grid of point labels that can be easily reviewed or passed to a contractor for fieldwork. In this exercise, you’ll use the volume surface you generated earlier in this chapter to create a set of surface labels that reflect this requirement:
1. Open the SurfaceVolumeGridLabels.dwg file.
2. Change to the Annotate tab, and select Labels Surface Spot Elevations On Grid.
3. Press Enter and select Volume and click OK.
4. Pick a point in the southwest of the surface to set a base point for the grid.
5. Press ↵ to set the grid rotation to 0.
6. Enter 25 at the command line to set the x spacing.
7. Enter 25 at the command line to set the y spacing.
8. Click to the northeast of the surface to set the area for the labels.
9. Verify the preview box contains the Volume surface and press ↵ at the command line to continue.
10. Wait a few moments as Civil 3D generates all the labels just specified. Your drawing should look similar to Figure 4-53.
Figure 4-53: Volume surface with grid labels

Labeling the grid is imprecise at best. Grid labeling ignores anything that might happen between the grid points, but it presents the surface data in a familiar way for engineers and contractors. By using the tools available and the underlying surface model, you can present information from one source in an almost infinite number of ways.