
Before you can analyze a surface, you have to make one. To the land development company today, this can mean pulling information from a large number of sources, including Internet sources, old drawings, and fieldwork. Working with each requires some level of knowledge about the reliability of the information and how to handle it in Civil 3D. In this section, we’ll look at how you can obtain data from a couple of free sources and bring it into your drawing, create new surfaces, and make a volume surface.
Before creating surfaces, you need to know a bit about the components that can be used as part of a surface definition:
LandXML Files These typically come from an outside source or are exported from another project. LandXML has become the lingua franca of the land development industry. These files include information about points and triangulation, making replication of the original surface a snap.
TIN Files Typically, a TIN file will come from a land development project on which you or a peer has worked. These files contain the baseline TIN information from the original surface and can be used to replicate it easily.
DEM Files Digital Elevation Model (DEM) files are the standard format files from governmental agencies and GIS systems. These files are typically very large in scale but can be great for planning purposes.
Point Files Point files work well when you’re working with large data sets where the points themselves don’t necessarily contain extra information. Examples include laser scanning or aerial surveys.
Point Groups Civil 3D point groups or survey point groups can be used to build a surface from their respective members and maintain the link between the membership in the point group and being part of the surface. In other words, if a point is removed from a group used in the creation of a surface, it is also removed from the surface.
Boundaries Boundaries are closed polylines that determine the visibility of the TIN inside the polyline. Outer boundaries are often used to eliminate stray triangulation, whereas others are used to indicate areas that could perhaps not be surveyed, such as a building pad.
Breaklines Breaklines are used for creating hard-coded triangulation paths, even when those paths violate the Delaunay algorithms for normal TIN creation. They can describe anything from the top of a ridge to the flowline of a curb section. A TIN line may not cross the path of a breakline.
Drawing Objects AutoCAD objects that have an insertion point at an elevation (e.g., text or blocks) can be used to populate a surface with points. It’s important to remember that the objects themselves are not connected to the surface in any way.
Edits Any manipulation after the surface is completed, such as adding or removing triangles or changing the datum, will be part of the edit history. These changes can be viewed in the properties of a surface and can be toggled on and off individually to make reviewing changes simple.
Working with all these elements, you can model and render almost anything you’d find in the world—and many things you wouldn’t. In the next section, you start building some surfaces.
Free Surface Information
You can find almost anything on the Internet, including information about your project site that probably includes level information you can use to build a surface. For most users, free surface information can be gathered from government entities or Google Earth. You look at both in this section.
Surfaces from Government Digital Elevation Models
One of the most common forms of free data is the Digital Elevation Model (DEM). These files have been used by the U.S. Department of the Interior’s United States Geological Survey (USGS) for years and are commonly produced by government organizations for their GIS systems. The DEM format can be read directly by Civil 3D, but the USGS typically distributes the data in a complex format called Spatial Data Transfer Standard (SDTS). The files can be converted using a freely available program named sdts2dem. This DOS-based program converts the files from the SDTS format to the DEM format you need. Once you are in possession of a DEM file, creating a surface from it is relatively simple, as you’ll see in this exercise:
1. Start a new blank drawing from the _AutoCAD Civil 3D (Imperial) NCS template that ships with Civil 3D.
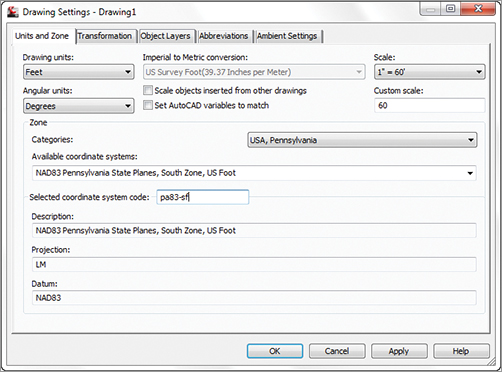
2. Switch to the Settings tab of Toolspace, right-click the drawing name, and select Edit Drawing Settings. Set the coordinate system as shown in Figure 4-3 via the Drawing Settings dialog and click OK. The coordinate system of the DEM file that you will import will be set to match the coordinate system of the drawing.
Figure 4-3: Civil 3D Imperial coordinate settings for DEM import
3. In Prospector, right-click the Surfaces collection and select the Create Surface option. The Create Surface dialog appears.
4. Accept the options in the dialog, and click OK to create the surface. This surface is added as Surface 1 to the Surfaces collection.
5. Expand the Surfaces Surface 1 Definition branch.
6. Right-click DEM Files and select the Add option (see Figure 4-4). The Add DEM File dialog appears.
Figure 4-4: Adding DEM data to a surface

7. Navigate to the Stewartstown_PA.DEM file and click Open. (Remember, all data and drawing files for this book can be downloaded from www.sybex.com/go/masteringcivil3d2012.)
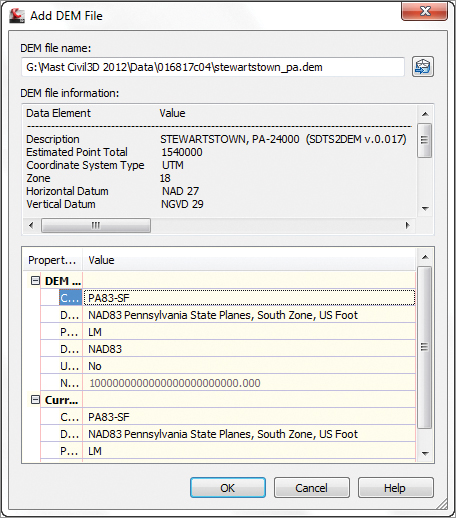
8. Set the values in the Add DEM File dialog as shown in Figure 4-5 and click OK. This translates the DEM’s coordinate system to the drawing’s coordinate system.
Figure 4-5: Setting the Stewartstown_PA.DEM file properties
9. Right-click Surface 1 in Prospector and select Zoom To to bring the surface into view, and then right-click the surface in your drawing and select Surface Properties. The Surface Properties dialog appears.
10. On the Information tab, change the Name field entry to Stewartstown PA.
11. Change the Surface Style drop-down list to Border Only, and then click OK to dismiss the Surface Properties dialog.
Once you have the DEM data imported, you can pause over any portion of the surface and see that Civil 3D is providing feedback through a tooltip. This surface can be used for preliminary planning purposes but isn’t accurate enough for construction purposes. The main drawback to DEM data is the sheer bulk of the surface size and point count. The Stewartstown PA DEM file you just imported contains 1.4 million points and covers more than 55 square miles. This much data can be overwhelming, and it covers an area much larger than the typical site. You’ll look at some data reduction methods later in this chapter.
In addition to making a DEM a part of a TIN surface, you can build a surface directly from the DEM (select the Surfaces branch, right-click, and choose Create Surface From DEM). The drawback to this approach is that no coordinate transformation is possible. Because one of the real benefits of using georectified data is pulling in information from differing coordinate systems, we’re skipping this method to focus on the more flexible method shown here.
Surfaces from Google Earth
Civil 3D also includes an importing function that brings in surface and image information directly from Google Earth. The DEMs used by Google Earth were collected over a 10-day span in February 2000 by the space shuttle Endeavor. The data, known as SRTM (Shuttle Radar Topography Mission) data, is typically not updated on a large scale. Ground control was not used during the collection of data, and the mission sought to achieve a vertical accuracy of just 16 meters. Because most freely available DEMs have been gathered by digitizing USGS Quadrangles (also known as QUADs), you can generally assume that SRTM data is the best freely available information out there. In this exercise, you’ll import a Google Earth location as a Civil 3D surface:
1. Download the latest version of Google Earth from http://earth.google.com and install it.
Google Earth and Versions
This data and exercise were tested with Version 6.0.1.2032. Due to a programming change on the Google Earth side, some later versions are picky about the amount of data Civil 3D pulls. Depending on the version installed on your machine, you might want to search the Web for information regarding Civil 3D and Google Earth interactions.
2. Launch Google Earth and get connected.
3. From the main menu, choose File Open.
4. Navigate to the Data directory and select the Concord Commons.kmz file to restore a view of a site in Felton, Pennsylvania.
5. In Civil 3D, create a new drawing from the _AutoCAD Civil 3D (Imperial) NCS template and set the coordinate system as you did in the previous exercise.
6. Change to the Insert tab on the Ribbon.
7. On the Import panel, select Google Earth Google Earth Image and Surface.
8. Press ↵ to accept the coordinate system as shown and the Surface Creation dialog will appear.
9. Accept the defaults in the Surface Creation dialog and click OK to dismiss the dialog.
10. From the main menu, choose View Zoom Extents to see something like Figure 4-6.
Figure 4-6: Completed Google Earth surface import

11. Close Google Earth.
12. Save the drawing as GE_Surface.dwg.
The interesting thing about surfaces built from Google Earth is that their accuracy is zoom-level dependent. This means that the tighter you are zoomed into a site in Google Earth, the better the surface you derive from that picture. Because of this dependence, you should attempt to zoom in as tightly as possible on the area of interest when using Google Earth for preliminary surface information.
Draping an Image
Now that you have an imported Google Earth Image and Surface, let’s check out a tool that will let you drape an image (such as the image that comes from Google Earth) onto the surface.
1. If it’s not already open, open GE_Surface.dwg. Select the surface.
2. From the Tin Surface tab and Surface Tools, select the Drape Image tool. The Drape Image dialog box opens, as shown below.
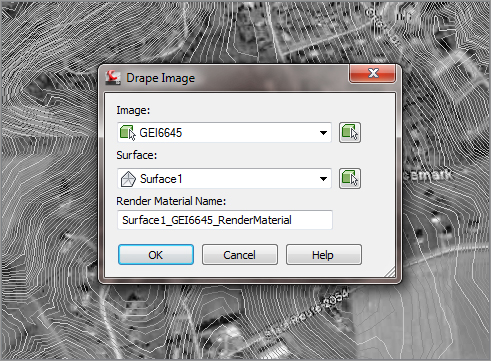
3. Examine the settings and press Ok to accept the defaults.
4. Select the contours and right click. Select Object Viewer from the right-click menu.
5. In the Object Viewer, select Realistic from the Visual Styles drop-down list and SW Isometric from the View Control drop-down list.
6. Your drawing should look like the image shown below.
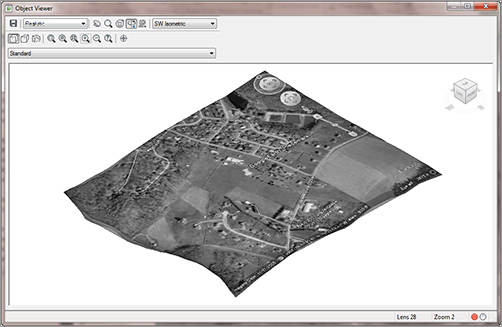
You can see how this tool will graphically display the surface based on the contour data.
So, after doing all of this, we’re going to tell you that didn’t have to do that for Google Earth, since it automatically drapes. But the procedure would be the same for any image that has been brought into your drawing that contains coordinate data.
Surface Approximations
In this section, you’ll work with elevated polylines. Later in this chapter, you’ll work with a large point cloud delivered as a text file. These polylines are quite common, and historically it can be difficult making an acceptable surface from them.
Surfaces from Polyline Information
One common complaint about converting a drawing full of contours at elevation into a working digital surface is that the resulting contours don’t accurately reflect the original data. Civil 3D includes a series of surface algorithms that work very well at matching the resulting surface to the original contour data. You’ll look at those surface edits in this series of exercises.
1. Open the SurfaceFromPolylines.dwg file. Note that the contours in this file are composed of polylines.
2. In Prospector, right-click the Surfaces branch, and select the Create Surface option. The Create Surface dialog appears.
3. Leave the Type field as TIN Surface but change the Name value to EG-Polylines.
4. Change the description to something appropriate.
5. Change the Style drop-down list to Contours 1’ and 5’ (Background) and click OK to close the dialog.
6. Expand the Surfaces EG-Polylines Definition branches.
7. Right-click Contours and select the Add option. The Add Contour Data dialog appears.
8. Set the options as shown in Figure 4-7 and click OK. (You will return to the Minimize Flat Areas By options in a bit.)
Figure 4-7: The Add Contour Data dialog

9. Enter ALL at the command line to select all the entities in the drawing. You can dismiss Panorama if it appears and covers your screen.
The contour data has some tight curves and flat spots where the basic contouring algorithms simply fail. Zoom into any portion of the site, and you can see these areas by looking for the blue and cyan original contours not matching the new Civil 3D–generated contour. You’ll fix that now:
1. Expand the Definition branch and right-click Edits. Select the Minimize Flat Areas option to open the Minimize Flat Areas dialog. Note that the dialog has the same options found in that portion of your original Add Contour Data dialog. You just did it as two steps to illustrate the power of these changes!
2. Click OK.
Now the contours displayed more closely match the original contour information. There might be a few instances where gaps exist between old and new contour lines, but in a cursory analysis, none was off by more than 0.4″ in the horizontal direction—not bad when you’re dealing with almost a square mile of contour information. You’ll see how this was done in this quick exercise:
1. Zoom into an area with a dense contour spacing and select the surface.
2. Click the Surface Properties button on the Modify panel.
3. Change the Surface Style field to Contours With Points and click OK to see a drawing similar to Figure 4-8.
Figure 4-8: Surface data points and derived data points
In Figure 4-8, you’re seeing the points the TIN is derived from, with some styling applied to help you understand the creation source of the points. Each point in red is a point picked up from the contour data itself. The magenta points are all added data on the basis of the Minimize Flat Areas edits. These points make it possible for the Civil 3D surface to match almost exactly the input contour data.
Surfaces from Points or Text Files
Besides receiving polylines, it is common for a surveying company to also send a simple text file with points. This isn’t an ideal situation because you have no information about breaklines or other surface features, but it is better than nothing or using a Google Earth–derived surface. Because you have the same aerial surface described as a series of points, you’ll add them to a surface in this exercise:
1. Make a folder on your computer called C:Mastering.
2. Place the Concord Commons.txt file in your newly created folder. Doing so ensures that future exercises will function properly.
3. Create a new drawing using the _AutoCAD Civil 3D (Imperial) NCS Template.
4. Change the Coordinates to NAD83 Pennsylvania, South Zone, US Foot (PA83-SF).
5. From the Create Ground Data panel on the Home tab, choose Surfaces Create Surface. The Create Surface dialog appears.
6. Change the Name value to Points from Text, and click OK to close the dialog.
7. In Prospector, expand the Surfaces Points From Text Definition branches.
8. Right-click Point Files and select the Add option. The Add Point File dialog shown in Figure 4-9 appears.
Figure 4-9: Adding a point file to the surface definition

9. Set the Format field to PNEZD (Comma Delimited). Make sure it is PNEZD, and not PENZD or your results will be off completely.
10. Click the Browse button shown in Figure 4-9. The Select Source File dialog opens.
11. Navigate to the previously created C:Mastering folder, and select the Concord Commons.txt file. Click OK.
12. Click OK to exit the Add Point File dialog and build the surface. Panorama will appear, but you can dismiss it.
13. Right-click Points From Text Surface in Prospector and select the Zoom To option to view the new surface created.
In both the polyline and point file examples, you’re making surfaces from the best information available. When you’re doing preliminary work or large-scale planning, these types of surfaces are great. For more accurate and design-based surfaces, you typically have to get into field-surveyed information. We’ll look at that a little later.
Prospector and the Ribbon
In previous exercises, you created new surfaces with commands from Prospector. Now we will turn our attention to the Ribbon and do the same thing. That way, you can see that there is typically more than one way to accomplish the same goal.
Surface from GIS Data
You may run into a situation where an outside firm uses GIS, or perhaps your firm is also using GIS data. Civil 3D understands GIS and can work with the data given. In this section, we’ll show you how to import GIS data pertaining to surfaces.
1. Start a new drawing by using the _AutoCAD Civil 3D (Imperial) NCS template. For Metric users, use the _AutoCAD Civil 3D (Metric) NCS template. Set the coordinate system to NAD83 Georgia State Planes, West Zone, US Foot (GA83-WF).
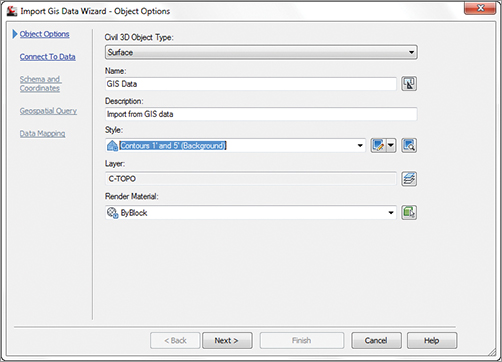
2. In the Create Ground Data panel of the Home tab, select Surfaces Create Surface from GIS Data. The Import Gis Data Wizard - Object Options screen appears. Enter the information as shown in Figure 4-10 and click the Next button. The Import Gis wizard - Connect To Data screen appears.
Figure 4-10: The Import Gis Data Wizard - Object Options screen
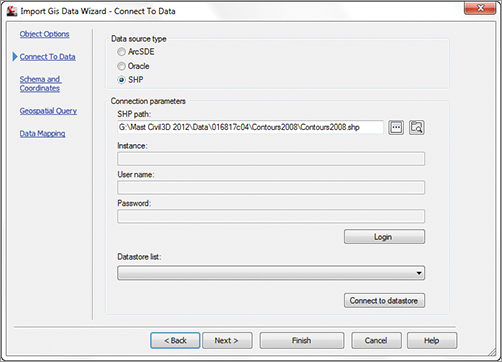
3. You are importing a SHP file, so change Data Source Type to SHP.
4. Click the ellipsis next to SHP Path. Locate the contours2008.shp file (which you’ll find at www.sybex.com/go/masteringcivil3d2012). Many thanks to Kevin Clark for providing this dataset for our use. The path is now populated with the location of the SHP file, as shown in Figure 4-11.
Figure 4-11: The Import Gis Data Wizard - Connect To Data screen
5. Click the Login button. The Import Gis Data Wizard - Schema And Coordinates screen now appears (Figure 4-12).
Figure 4-12: The Import Gis Data Wizard - Schema And Coordinates screen
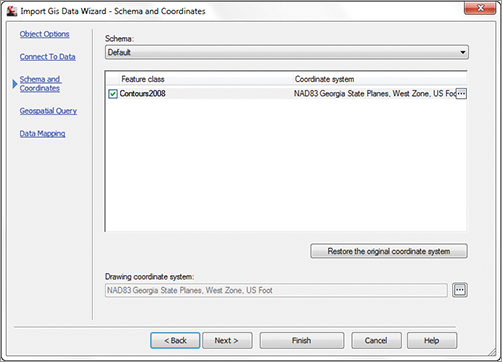
You will notice that the name of the file appears as well as the coordinate system in which the SHP was created. In this case, the NAD83 Georgia State Plane, West Zone, US Foot matches what you set the drawing up with.
6. Click the box next to Feature Class and click Next.
7. On the Import Gis Data Wizard - Geospatial Query screen, look at the settings but do not make any changes (Figure 4-13). Click Next.
Figure 4-13: The Import Gis Data Wizard - Geospatial Query screen

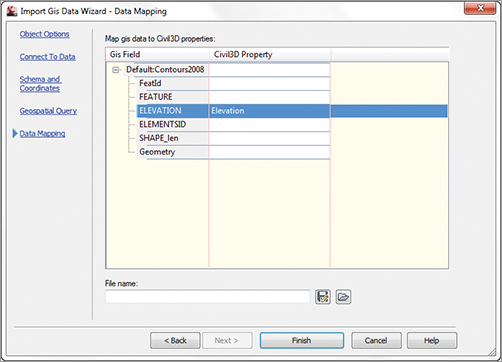
8. On the Import Gis Data Wizard - Data Mapping screen, click the drop-down next to Civil 3D Property for the GIS field Elevation, as shown in Figure 4-14. Click the Finish button.
Figure 4-14: The Import Gis Data Wizard - Data Mapping screen
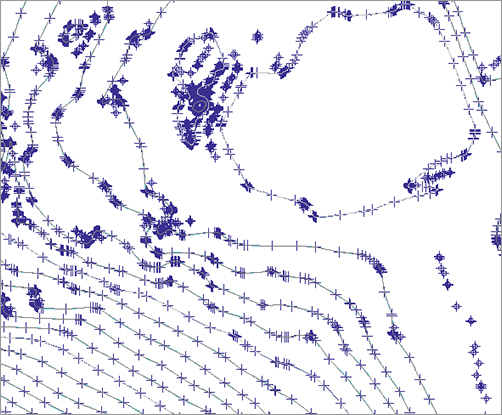
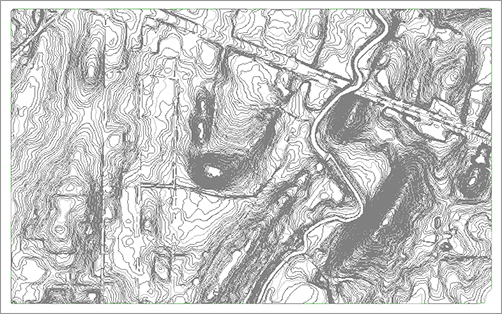
9. Dismiss the Panorama and zoom extents to see the imported image from the SHP file (Figure 4-15).
Figure 4-15: The finished Imported GIS contours
Notice that the surface name and description are the same as what you specified in step 2.
This is just another avenue for getting drawings from other sources into Civil 3D. This topic will be discussed more in depth in Chapter 17, “Interoperability.”
Simply adding surface information to a TIN definition isn’t enough. To get beyond the basics, you need to look at the edits and other types of information that can be part of a surface.