When you need to clearly illustrate a concept such as a process, cycle, hierarchy, or relationship, you can create a dynamic, visually appealing diagram by using SmartArt diagrams. SmartArt is almost certainly the coolest new feature available in Word 2008 for Mac, Excel 2008 for Mac, and PowerPoint 2008 for Mac.
Note
To avoid confusion, in this book we refer to graphics created with the SmartArt engine as diagrams. In the program interface, you’ll see references to SmartArt graphics. Both terms refer to the same thing.
From the extensive library of SmartArt layouts, you can create simple diagrams depicting simple concepts, or very complex graphics that earn their reputation as being "worth 1000 words."

By using predefined sets of sophisticated formatting, you can almost effortlessly put together professional-looking diagrams that depict a variety of scenarios. Common types of diagrams include:
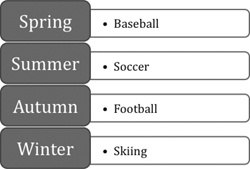
List diagrams. These diagrams visually represent lists of related or independent information—for example, a list of items needed to complete a task, including pictures of the items.
Process diagrams. These diagrams visually describe the ordered set of steps required to complete a task—for example, the steps you take to process an order.
Cycle diagrams. These diagrams represent a circular sequence of steps, tasks, or events; or the relationship of a set of steps, tasks, or events to a central, core element—for example, the importance of introducing the basic elements of a story in order to build up to an exciting ending.
Hierarchy diagrams. These diagrams illustrate the structure of an organization or entity—for example, the top-level management structure of a company.

Other diagram types include:
Relationship diagrams. These diagrams show convergent, divergent, overlapping, merging, or containment elements—for example, how using similar methods to organize your e-mail, calendar, and contacts can improve your productivity.
Matrix diagrams. These diagrams show the relationship of components to a whole—for example, the product teams in a department.
Pyramid diagrams. These diagrams illustrate proportional or interconnected relationships—for example, the amount of time that should ideally be spent on different phases of a project.
You create a SmartArt graphic directly in a document, worksheet, slide, or e-mail message by selecting the diagram layout you want from the SmartArt tab of the Elements Gallery. (You can leave the graphic in the document and it will remain editable.) You add text to the diagram either directly or from its Text pane.
The process of creating a SmartArt graphic is relatively quick, other than the time you’ll spend choosing the layout you want and marveling over the many types of formatting you can apply to the graphic, the background, and the text.
SmartArt graphics are attractive simply as graphics, but because they are intended to convey specific information, they are specifically designed to incorporate text. Each SmartArt graphic has an associated Text pane. You can enter text into the Text pane or directly into the graphic; the text immediately appears in both locations.

After you create a diagram, you can add and remove shapes, and edit the text that appears in the shapes, by making changes in the Text pane. If you scroll the file while the Text pane is open, the Text pane remains visible so that you can easily copy text between the file and the Text pane rather than retyping it.
You can also customize a diagram by using the options in the Formatting Palette of the Toolbox. You can make changes such as the following:
Switch to a different layout of the same type or of a different type.
Add shading and three-dimensional effects to all the shapes in a diagram.
Change the color scheme.
Change an individual shape—for example, you can change a square into a star to make it stand out.
Apply a built-in shape style.
Change the color, outline, or effect of a shape.