Sunshading and Solar Paths
Good sustainable design optimizes the use of natural daylight within the building, thereby minimizing the need for artificial lighting. While letting in the natural daylight, it's good to mitigate the amount of direct light coming into the building because sunlight directly entering a building becomes heat and that heat then needs to be conditioned or taken into account for HVAC loads.
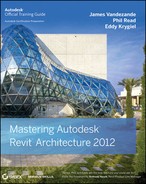
You can see even in this project the difference in direct sun exposure on the glazing at different times of year. Figure 10.10 shows the sun striking the building at noon on the equinox, while Figure 10.11 shows the sun hitting the building façade during the summer solstice. The deeper windows in this façade help to add some shading to the glazing.
FIGURE 10.10 The Jenkins building during the equinox
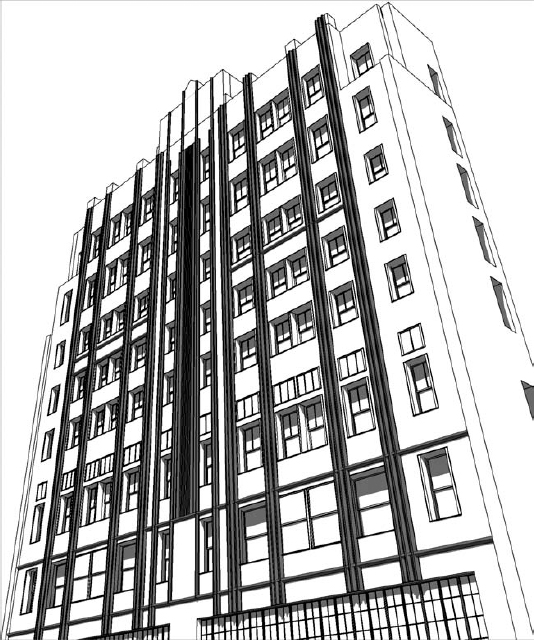
FIGURE 10.11 The Jenkins building during the summer solstice

Creating a Solar Study
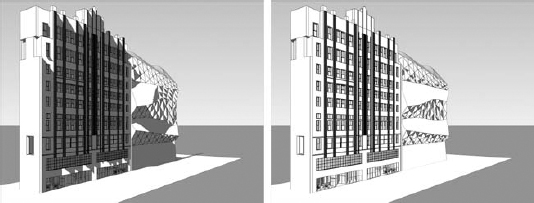
Sun studies are views that can be stills or animated that help you visualize the solar exposure and sunshading on the building. These views can be created in interior or exterior conditions and help to demonstrate the course of the sun over a period of time. By creating camera views at key locations within your model, you can see the impact of solar exposure on your project. In Figure 10.12, you can see the difference in the sun between the summer and winter solstices (June 21 and December 21, respectively) at 4:00 p.m.
Remember that once the views are established, you will be able to revisit those same views as the design evolves so you can regularly see how the sun affects the building from the same angle.
FIGURE 10.12 Summer solstice (left) and winter solstice (right)
Let's create a few views to study the sun on a building's interior and exterior. Open the c10-Jenkins.rvt building model you used in previous exercises in this chapter. Remember the file can be downloaded from the book's companion web page. First, you need to establish a view in which to see the building:
- Activate the Level 3 floor plan from the Project Browser. From the View tab in the ribbon, click on the 3D View pull-down and select Camera. Click on the lower left of the plan, then on the upper right. This will create a camera view with a similar view angle to the images shown in Figure 10.12. Name the view Solar Study -- North.
- Before you activate the sun, you need to make the mass visible. Open the Visibility/Graphic Overrides dialog box by pressing VG on the keyboard, and on the Model tab, select the Mass check box. This will allow you to see both the existing building and the new mass form.
- By default, this view will look like a colorless perspective. You will adjust this as you add shade and shadow to the perspective. Now that you have a view established, click the Graphic Display Options button in the Properties palette for the view.
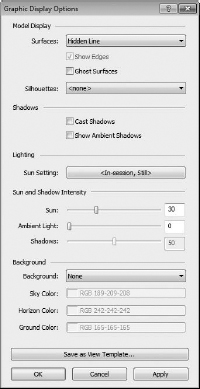
- In the dialog box that opens (Figure 10.13), you're going to adjust some of the settings. To get started, click the button next to Sun Setting.
Doing so opens a new dialog box that contains sun settings (Figure 10.14). Here, you can control time of day, direction of the sun, and location of your project (longitude and latitude), among other settings. You can also specify if you want to see the sun placed at a single time of day or multiple times over a day, week, or year in an animation. There are four settings to choose from:
- Still casts the sun at a specific time of day based on the parameters you choose.
- Single-Day allows you to animate the sun and export the animation to an AVI file to show it over the course of a single day.
- Multi-Day casts the sun in the same position (same time of day) over the course of multiple days and can also be exported to an AVI.
- Lighting uses Revit's lighting families. The other three settings are sun based and will not activate any inserted lighting.
FIGURE 10.13 The Graphic Display Options dialog box
FIGURE 10.14 The Sun Settings dialog box
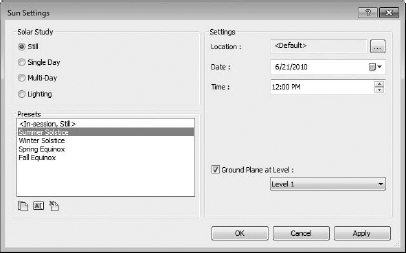
Let's start with a still view first. You're going to choose to see the sun and shadows on the summer solstice to begin.
- Click the Still radio button.
- Choose Summer Solstice from the Presets. This won't have all the settings correct, but once you put them in place, it will be set correctly for our location.
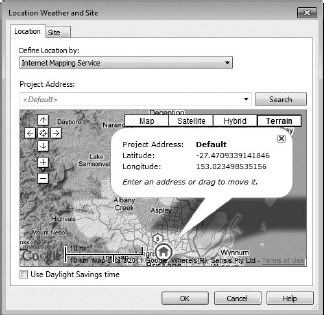
- For the building location, you must specify the address or city. Click the selection button
 next to Location to open the Location Weather And Site dialog box (Figure 10.15). Type Kansas City, MO as the Project Address and click Search. The Internet mapping service will find the city location for you. Click OK to accept the location and close this dialog box.
FIGURE 10.15 Set your project's location in the Location Weather And Site dialog box.
The building location doesn't automatically synchronize with the project address in Project Information (which can be modified from the Manage tab in the ribbon). You must enter the location for your solar studies in these dialogs for correct shading results.
KNOW YOUR TRUE NORTH
Make sure your Revit project has been set to the correct True North orientation before commencing any solar studies or energy analyses. Take a look at the view properties for any plan view and find the Orientation property. If it is set to True North, then the building in plan should look exactly the way it would if you were looking at it on a map. In other words, true north will be up—in the 90-degree direction.
You can set your project's True North orientation in several ways. If you have an accurate site plan from a civil engineer, you can link the file in and use Acquire Coordinates from the Manage tab (under the Coordinates button). You can also acquire the coordinates from another linked Revit model. If you don't have a reference model or drawing, you can use the Rotate True North command from the Manage tab under the Position button.
- The default date and time for the solstice is June 21 at 12:00 p.m. Change the time of day to 4:00 p.m.
- By default, no ground plane is selected. Without a ground plane, there's nowhere for the shadows to fall on the ground (sometimes you might not want to see those shadows if you are only concerned about the shadows on or in your building). For our setting, select the check box and choose Level 1 from the drop-down list. Click OK.
Note that if you have an accurate toposurface in your model, you don't need to select a ground plane in the Sun Settings dialog box. Shadows will be cast directly onto such surfaces.
- Now you are back in the Graphic Display Options dialog box. There are a couple more options you'll want to select. First, select the Cast Shadows check box. This will turn the shadows on and they will fall based on the settings you just established. The other setting you want to specify is the background. Choose Gradient Background from the Background drop-down list. This controls the color of the ground plane and the horizon in 3D views and helps to add a bit of visual depth to the images. Once this is done, click OK to close the Graphic Display Options dialog box.
The finished view will look like Figure 10.16. After you create these settings, you can quickly toggle the shadows on and off using the Shadows button from the View Control Bar at the bottom of the view. Remember, turning the shadows off will allow the view to render more quickly if you are in the midst of making modifications to the model.
FIGURE 10.16 The finished camera view with Still sun settings applied

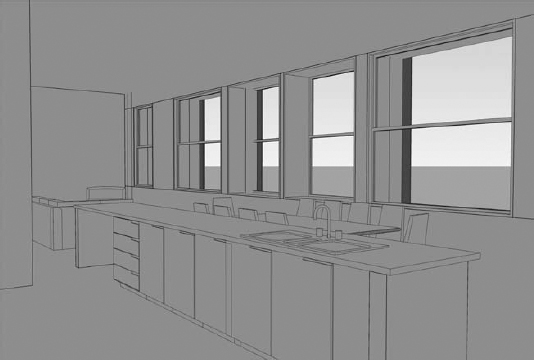
Once this view is complete, it's quick work to make other views using the same settings and visualize the building shading from various angles. Activate the Level 2 floor plan and create another exterior camera view from lower right to upper left (Figure 10.17). Zoom into the Living/Dining space toward the right side of the building and create another camera view inside the space, placing the camera at the upper left and then dragging the point of view to the lower right (Figure 10.18).
Adding shading to the view is not much easier to establish. Since you've already applied the settings to a previous view, all you need to do is edit the Graphic Display Options from the Properties palette. Select the Cast Shadows option, set Sun to the Still setting named Summer Solstice, and set a gradient background.
FIGURE 10.17 Exterior view from the south looking north

FIGURE 10.18 View from inside the Living/Dining area

Apply this same setting to the interior view, and it will deliver some odd results—your windows won't be clear; they'll be solid. Whenever you are working in Revit views, it's important to know what phase you are working in as well as how phasing will affect visibility. Since the original building was created in an Existing phase, those materials render as solid in 3D views. To change this, scroll down in the Properties palette to the Phasing properties. Change Phase Filter to Show Complete and click Apply.
This will put all the materials shown within the view in the same state (a current or finished one). Now the finished view should have transparent glazing and look like Figure 10.19. You can see that even in this view, sunlight inside the space at this time of day is somewhat limited.
FIGURE 10.19 Interior view with sun and phase settings applied correctly
Creating an Animated Solar Study
Creating a solar study is a great tool to visualize the effects of the sun at various times of day on a building. But what about being able to watch the progress of the sun over the course of the day, week, or year? Fortunately, Revit has the ability to animate the solar studies so you can see the progress of the sun and its impact on the building. Any view with Shade and Shadows turned on can be animated to show the sun over time. To access these settings, edit the Graphic Display Options in the Properties palette.
Using the same method you used for the still solar study, choose Sun Settings in the Graphic Display Options dialog box. This will bring you back to the Sun Settings dialog box you used for the still. This time, let's select one of the other options. You can choose one of the following:
Single Day Create single-day studies with the settings on the Single-Day tab. These settings will show the effect of sun on a specific day at various intervals (15, 30, 45, or 60 minutes). By setting the date and checking the Sunrise To Sunset box, you'll be able to animate the effect of sun on your model based on the estimated sunrise and sunset times for the selected day.
Multi-Day The settings on the Multi-Day tab are just like the settings on the Single-Day tab, but the interval is days, weeks, or months, and you can see the effect of sun over the course of an entire year. To create a multiday sun study, we will follow steps very similar to a single-day study.
For this exercise, let's choose the single-day study. We'll work with the summer solstice again, but you need to modify some of the settings from the last solar study.
- Choose the Single Day radio button and select the Single Day Solar Study from the Presets list.
- Set the date and time for the solstice as June 21, 2011, and select the Sunrise To Sunset check box.
- Set the Time Interval to 15 minutes and set the Ground Plane to Level 1.
- Click OK to close both the Sun Settings and Graphic Display Options dialog boxes.
PREVIEWING A SOLAR STUDY
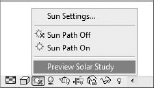
Your solar study will now look like a still; however, you will have a new tool available in the View Control Bar. Select the Sun Path button and you'll see a new option: Preview Solar Study (Figure 10.20). Selecting this will give you tools for video playback, similar to your DVR or iTunes, under the ribbon.
FIGURE 10.20 Access the Preview Solar Study command by selecting the Sun Path button.
Using this method for playback will be choppy because Revit will need to render each of the frames. A more fluid way to view the animation is to export it as an AVI and view the complete animation.
EXPORTING THE ANIMATION
The solar study is easy and quick to export. To do so, click the Application menu and select Export ![]() Images And Animations
Images And Animations ![]() Solar Study. Choosing this option will first present a Length/Format dialog box (Figure 10.21). Let's look at these settings in a bit more detail.
Solar Study. Choosing this option will first present a Length/Format dialog box (Figure 10.21). Let's look at these settings in a bit more detail.
This dialog box gives you the option to export all the frames or just partial frame sets. You might want to include partial frames if you're looking for a visualization that is only summer months or only the afternoon in a single-day sequence. You also have the ability to change the frame rate. By default, the frame rate is set to 15 frames per second. This is a good frame rate for video but tends to move pretty fast for a sunshading animation. We recommend reducing the frame rate to 4, which will allow you more time to absorb how the shading changes across the building over time but still moves quickly enough so the video isn't stagnant. Notice that changing the frame rate from 15 to 4 has increased the total time from 3 seconds to 8.
FIGURE 10.21 Length/Format dialog box

The other element you can edit in this dialog box is the format. You can change the output of the video size and how it is rendered. Rendered video options are similar to the view settings (Shaded, Hidden Line, etc.).
Change the Frames/Sec setting to 4 and the Visual Style setting to Shaded With Edges. Then click OK.
Specify a folder location and filename for your animation and click Save. You'll be presented with one last set of options before the video exports: the Video Compression dialog box (Figure 10.22). This dialog box allows you to use a variety of video codecs available on your computer to compress the video for a smaller file size. Once you've chosen the appropriate compressor, click OK.
FIGURE 10.22 Choose a video compression codec.

For the highest-quality results but largest file size, you should choose the Full Frames (Uncompressed) option. You can always experiment with each video compressor to find the codec that gives you the results you need with the most reasonable file size.
The size of the animation can also be adjusted in one of two ways. You can specify the width and height in pixels in the Length/Format dialog box, or you can change the size of the 3D view itself. To do so, select the crop region in the 3D view and click the Size Crop button in the contextual tab of the ribbon. In the Crop Region Size dialog box (Figure 10.23), choose the Scale option and then modify either the Width or Height value. The proportion of the view will not change, but the changed size will affect image and animation exports.
You'll see the Revit model reappear and render its way through the various animation times. Depending on the speed of your computer and the number of frames you're rendering, this process could take several minutes. Once it's finished, you'll be able to view your final animation. Since it's not possible for us to embed a copy of the video within this book, you can download a copy of this animation from the book's companion web page.
FIGURE 10.23 Adjust the size of the 3D view by changing the size of the crop region.

Creating a Solar Path
You can also visualize the path of the sun across the model's sky directly in your project model. To activate this feature, continue with the c10-Jenkins.rvt model and open the default 3D view.
In the View Control Bar at the bottom of the view, click the Sun Path icon and select Sun Settings. Choose the Single Day option and select Single Day Solar Study from the list of presets.
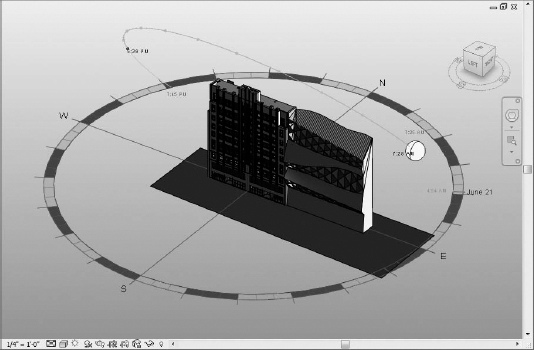
The settings here should reflect the single-day animation you completed in the previous section. Leave these settings for now and click OK to close this dialog box. Click the Sun Path icon and choose Sun Path On. You'll see a sun shown as a yellow ball placed in the sky and a compass rose placed under the building. The sun will have an arc displaying the path across the sky, reflecting its position at the day you chose, and nodes on this path, reflecting the time intervals you had preset (Figure 10.24).
Click and hold on the sun; this will activate the entire solar path across the range of the entire year (Figure 10.25). You can now drag the sun to any position within this solar range. Note that the time will be reflected just above sun itself and the date ranges are shown next to the compass rose.
FIGURE 10.24 Activating the sun path