Daylighting
Daylighting is the use of natural light for primary interior illumination. This reduces your need for artificial light within the space, reducing internal heat gain and energy use. Natural light is the highest quality and most efficient light source available today, and the source is free.
An effective daylighting design relies heavily on proper building orientation, massing, and envelope design. The proper combination of these strategies allows you to optimize your building's use of natural resources and minimize your dependency on artificial lighting. A fully integrated daylighting system can enhance the visual acuity, comfort, and beauty of a space while controlling external heat gain and glare.
Some common terms that are associated with daylighting are:
- A footcandle, which is a measure of light intensity. A footcandle is defined as the amount of light received by 1 square foot of a surface that is 1 foot from a point source of light equivalent to one candle of a certain type. Depending on the sky conditions, daylight can produce anywhere from 2,000 to 10,000 footcandles.
- Illuminance, which is the luminous flux per unit area on an intercepting surface at any given point, expressed in footcandles. Commonly described as the amount of light on a surface.
- Luminance, which is the luminous intensity of a surface in a given direction per unit of projected area, expressed in footcandles. Commonly described as the amount of light leaving a surface.
- Glare, which is the sensation produced by luminance within the visual field that is sufficiently greater than the luminance to which the eyes have adapted to cause annoyance, discomfort, or visibility difficulty.
Not only does natural daylight help to light our workplaces and homes, but it also supplies us with a connection to the outdoors. Providing occupants with natural light and ties to the outside has been proven in a number of cases to have a positive effect on human health and productivity. Studies have shown that buildings with good daylighting design have positive effects on their occupants:
- Increased productivity levels
- Low absentee rates
- Better grades
- Retail sale increases
- Improved dental records
- Healthier occupants
For a more information on the concept of daylighting and how to incorporate it into your designs, visit the Whole Building Design Guide at www.wbdg.org/resources/daylighting.php.
Revit itself does not perform daylighting analysis. To get accurate daylighting results, you need to use other applications in the same way you did with energy analysis. Daylighting, however, is much easier to evaluate for accurate results and doesn't require several years of training to perfect. There are several tools on the market that will do daylighting analysis:
DaySIM DaySIM (http://apps1.eere.energy.gov/buildings/tools_directory/software.cfm/ID=428/pagename=alpha_list) is a free application supported by the U.S. Department of Energy. It is built from the Radiance engine, one of the most accurate and trusted currently available, but requires a working knowledge of the Radiance engine to be properly proficient.
Ecotect Analysis Ecotect offers its own flavor of daylighting analysis (www.autodesk.com/ecotect-analysis). Ecotect is powerful as a one-stop shop for sustainable design analysis (as it also performs energy analysis as well as other building analysis) but has been noted to be clunky and difficult to use.
3ds Max Design 3ds Max Design is a rendering application (www.autodesk.com/3dsmax) that in 2008 added a daylighting package. The daylighting engine is based on Radiance but is easy to use and will directly import Revit model geometry through the use of an FBX translator.
For the purposes of this exercise, we'll focus on 3ds Max Design because we think this product allows the most speed and versatility for daylighting analysis.
Setting Up for Daylighting Analysis
As in energy modeling, you must perform several steps in order to successfully analyze a building for daylight. If all the steps are not performed, your analysis will be inaccurate and not trustworthy. Let's step through the specific settings needed to perform daylighting. In this analysis, we will use the same Jenkins model we used for other exercises in this chapter to better emulate a real-life workflow.
BUILD A GOOD MODEL
As in energy modeling, if your building model is missing walls or has holes in the exterior (that aren't supposed to be there), it will leak light into the space and invalidate your results. Make sure your model is properly created; that there are roofs, floors, and walls in place; and that those elements meet properly in their corners.
Proper building phasing is also important. Your building model will be exported from a perspective or 3D view. Make sure that you have the view phase set to Show Complete.
MATERIALS
![]() Materiality is an important part of daylighting as the nature of the materials will allow light transmittance (in the case of glazing) or allow light reflectance (in the case of flooring, wall paint, etc.). You'll want to have all your materials properly defined in the view from which you want to create the daylighting simulation. To set your materials, navigate to the Manage tab and choose the Materials button. It will open the Materials dialog box (Figure 10.42). All of your elements within the model, even Generic elements (such as generic walls), should have materials defined. Let's look at some of these materials in more detail.
Materiality is an important part of daylighting as the nature of the materials will allow light transmittance (in the case of glazing) or allow light reflectance (in the case of flooring, wall paint, etc.). You'll want to have all your materials properly defined in the view from which you want to create the daylighting simulation. To set your materials, navigate to the Manage tab and choose the Materials button. It will open the Materials dialog box (Figure 10.42). All of your elements within the model, even Generic elements (such as generic walls), should have materials defined. Let's look at some of these materials in more detail.
FIGURE 10.42 Materials dialog box
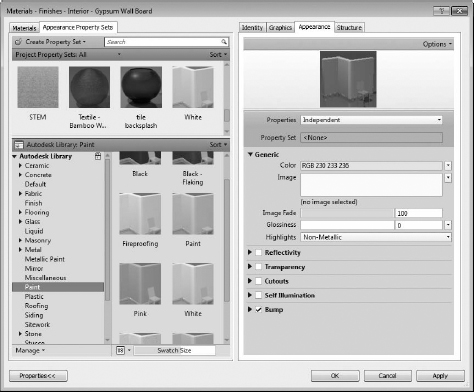
One common material will be paint (shown in Figure 10.42). Here, we have applied paint as the finish type (called Cool White Matte) to describe the finish type for Gypsum Wall Board, one of our most common building materials. As you can see on the Render Appearance tab, you have the ability to change some of the properties of the paint. You can alter the reflectance (flat, eggshell, semigloss, gloss, and so on) and how the paint is applied to the wall (rolled, sprayed, and so on). Each of these will affect the reflectance of the paint in a different way.
Another material you should look at is glazing. Getting the proper glazing settings will determine how much daylight you are getting inside the space. On the Render Appearance tab, shown in Figure 10.43, there are a few critical settings for glazing:

Color The color of the glazing will partially determine light transmittance. Set your glazing color to reflect the color you will have in your design. Revit supplies several common glazing colors.
Reflectance As with different colors, reflectance will also help determine how much light you will get inside a space. You will see that if you use the Replace feature at the top to select one of Revit's preset glazing colors, it will also give you a default value for reflectance.
Sheets Of Glass The number of sheets of glass will determine how the light will be refracted as it moves from outside the building to the inside. Typically, in a Revit window family, you model glass as a 12 [25 mm] single pane for ease of modeling. Modifying the number of panes in this location will allow you to keep your modeling simplified but still maintain a level of accuracy in the daylighting analysis.
Depending on the stage of design you are in, you might not know what your final material is, but you want to apply some defaults to the material types so you can perform some preliminary lighting analysis. When in doubt, here are some default reflectance values you can apply to the Generic materials:
- Floors: 20% reflectance
- Walls: 50% reflectance
- Ceilings: 85% reflectance
EXPORTING TO 3DS MAX DESIGN
Once you have your materials defined and the model is ready to go, you need to define the view from which you want to export. To do this, select the camera tool from the View tab and create a perspective view of the area you want to analyze (Figure 10.44).
FIGURE 10.44 Define an interior camera view for exporting.

Now you are ready to export this view to FBX. To do so, click the Application menu and select Export ![]() FBX. Once this is done, you can open 3ds Max Design and import the model.
FBX. Once this is done, you can open 3ds Max Design and import the model.
Although this is a Revit book, we recognize that in today's design workflow not everything can happen within one application. Because of the general ease of performing daylighting in 3ds Max Design, you are going to finish the analysis in the other application. Before you begin in 3ds Max Design, there are a couple of things to note. First, you need to have a copy of Max Design, not Max. They are similar applications but the Design flavor of Max allows you to perform daylighting. Regular Max does not have this feature. Second, keep in mind that daylighting is science. The more accurate you are in following the steps, the more accurate your final results will be. These steps will be similar between Max Design 2009 and 2010.
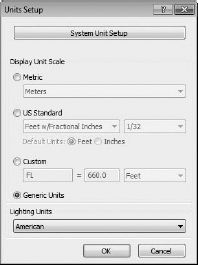
- Open 3ds Max Design. From the Customize drop-down, choose Units Setup. If you are in the United States, set your units to American, as shown in Figure 10.45. This will report your analysis in footcandles. You'll need to specify this setting only once.
- Click the Application menu, select Import
 FBX, and browse to your file. Select the file you exported from Revit and click OK. You'll get the dialog box shown in Figure 10.46. Here, you'll want to make sure that the drop-down menu at the top is set to Autodesk Architectural (Revit). This dialog box also has a button at the bottom called Web Updates. From time to time, Autodesk updates the FBX importing routine that will help get a more accurate import. Periodically click this button to make sure your FBX import is current. Otherwise, click OK.
FIGURE 10.45 Changing the unit settings per your location
FIGURE 10.46 The FBX Import dialog box

- From this point, you'll have the imported Revit model in Max. It should look like the generic 3D view from Revit. To get to the view you exported from, click the white text in the upper-left corner of your view window and choose Default 3D View (if you didn't rename the view in Revit prior to export) or the view name you exported from the Camera flyout. This should bring you back to the same view you created in Revit.
- Now, we're going to step through some settings in the Max dialog boxes and drop-downs. You should notice the Lighting Analysis menu at the top of the screen (if you don't have this, you don't have the right flavor of Max). Click the Lighting Analysis menu and choose Lighting Analysis Assistant.
- The Lighting Analysis Assistant has four tabs. By default, it opens on the General tab, shown to the left in Figure 10.47. This tab allows you to load some presets for daylighting analysis. Choose the Load Lighting Analysis Render Preset from this tab. You should also notice the lighting scale at the bottom of the dialog box. This will give you minimum and maximum color values for your daylighting simulation. Feel free to play with these values to achieve a desired graphic during this process.
FIGURE 10.47 Lighting Analysis Assistant settings on the General and Materials tab
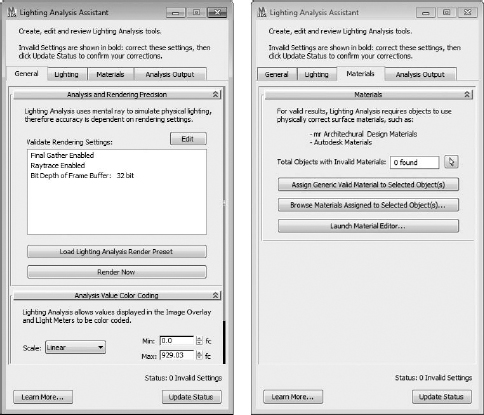
- Next select the Materials tab, shown to the right in Figure 10.47. This tab will show you if you have any materials in the import that are invalid and will therefore not reflect light properly. If you have invalid materials, it's probably a good idea to go back to Revit and fix them. Doing so will ensure they are valid in the daylighting analysis, but if you alter them in 3ds Max Design, you'll need to alter them every time you perform another daylighting analysis. If you need to locate the materials that are invalid, you can select the pick button
 and it will highlight all the invalid materials in the project. At this point, you can also choose to ignore them as they might not be visible within your view and therefore not necessary to correct.
 - Now let's jump back to the Lighting tab, shown to the left of Figure 10.48. On this tab, you're going to set the building location, time of day, and the rendering engine you want to use to perform the daylighting analysis. All of these settings will be created in other dialog boxes that are spawned from this dialog box. Don't worry—we'll step through them one at a time.
FIGURE 10.48 The Lighting tab in the Lighting Analysis Assistant
- To begin, click the Select & Edit button at the top. This will activate the sidebar menu, as shown to the right in Figure 10.48, that allows you to modify the position of the sun. You're going to want to change the Orbital Scale value at the bottom of this menu to something like 1500. This doesn't affect any analysis, but it will move the visualization of the sun off the ground plane and up into the sky. The other thing you want to do is select the Weather Data File radio button. This will activate the setup button right next to this selection.
- By clicking the Setup button, you will open yet another dialog box called Configure Weather Data. Here you can set the building location and time of day. 3ds Max works off TMY2 weather data files created by the U.S. Department of Energy. You'll need to navigate to their website (http://apps1.eere.energy.gov/buildings/energyplus/cfm/weather_data2.cfm/region=4_north_and_central_america_wmo_region_4) and download an EPW file. This file contains the average weather for your given location over a 30-year interval. Once you've downloaded the EPW file, click the Load Weather Data button (shown in Figure 10.49) and browse to the file, select it, and click OK.
- Click the Change Time Period button. This will pull up another dialog box (yes, you're now four deep) and give you a slider to change the date and time of your analysis (Figure 10.50). If you're performing an analysis for LEED EQ 8.1, you'll want to set it to June 21 at noon. You might notice that as you move the slider back and forth, the dates jump forward and backward over time. This happens by design. Over the 30-year span contained in the EPW file, it is displaying the specific day and year of the weather file that had weather that most closely reflected the average conditions over that 30-year span. Set your time and date and click OK. Click OK again to exit the other dialog box.
FIGURE 10.49 Loading the weather file in the Configure Weather Data dialog box
FIGURE 10.50 Setting the date and time from the imported weather data

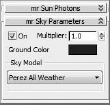
- Still on the Lighting tab, click the Select & Edit button next to Validate Sun/Sky Settings. Doing so activates the sidebar menu. From this menu, find the mr Sky Parameters heading and set the Sky Model drop-down to Perez All Weather (Figure 10.51).
FIGURE 10.51 Choose Perez All Weather as a sky model.
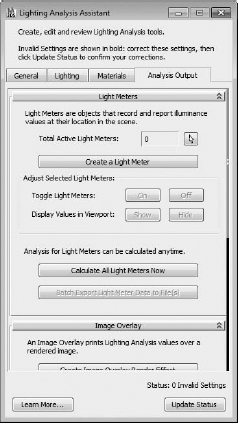
- OK, you are nearly done with the settings. Choose the last tab, Analysis Output. You need to create a light meter in which to calculate the daylight (Figure 10.52). Click the Create A Light Meter button, and in a plan view of your model, drag two points to create a grid.
- This will also activate the sidebar menu and give you the option to add node points to the light grid. If you're after your LEED analysis, you'll need to relocate the grid to 302 [75 cm] above the floor line and have meters every 2¢ [60 cm] in both directions. Your final grid will look like Figure 10.53. Once that is set, click OK to dismiss this dialog box.
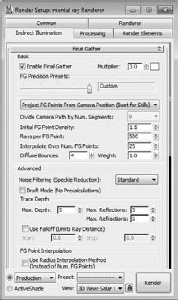
- From the Rendering drop-down, choose Render Setup and select the Indirect Illumination tab. On this tab, you want to set Final Gather to 3 (Figure 10.54). Final Gather will calculate the number of times light will bounce within the space. A setting of 0 means no light bounces and will give an inaccurate reading. A setting of 7 will be highly accurate, but will take considerably more processing power to create as the light bounces calculate exponentially. A setting of 3 optimizes the accuracy and speed for your output.
FIGURE 10.52 Click Create A Light Meter and define a plane in a plan view.
FIGURE 10.53 Creating the light meter grid

- You're now ready to perform the analysis. On the Analysis Output tab of the Lighting Assistant, click the Calculate All Light Meters Now button. This will render the light meters to give you a final image, like Figure 10.55. You'll be able to get a footcandle reading for each of the light meters as well as a color gradation showing you light and dark spots within the view.
FIGURE 10.55 The final analysis


Once you've mastered the ability to perform these types of daylighting analyses, you'll find it is fairly quick and easy to iterate several designs and images. With a few more steps, you can render the final scene with a daylighting grid overlay (Figure 10.56).
FIGURE 10.56 A rendered daylighting scene

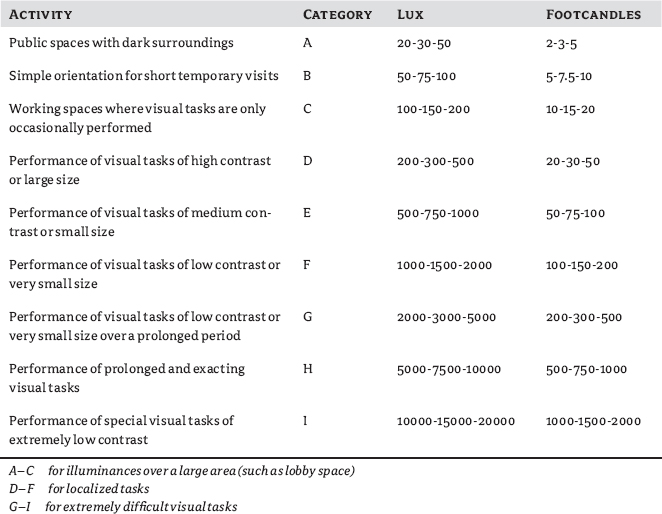
In each of these scenarios, it's important to vet your results. Don't take the values at their face values; review them to make sure they are accurate. So that you have a scale in which to value your results, Table 10.1 gives you some footcandle readings that you can use to figure out how much light is a proper amount based on the tasks you are performing within that space.
TABLE 10.1: Footcandle readings