The BIM Curve
Based on a 2004 study, the National Institute of Standards and Technology (NIST) reported annual losses of $15.8 billion in the building industry due to insufficient interoperability. This study underscores a problem that building information modeling as a whole is designed to address. Adequate interoperability will help rectify the problem illustrated in Figure 8.1, sometimes known as the BIM curve.
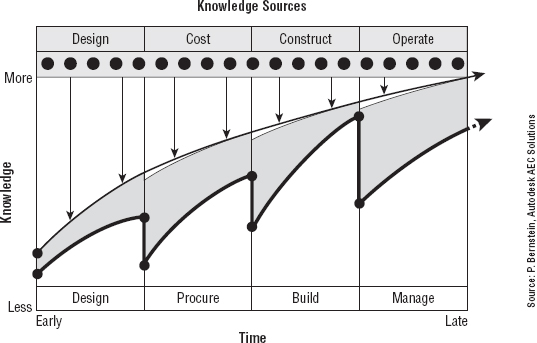
In Figure 8.1, the downward spikes in the lower line at the end of each project phase represent a loss of knowledge and acquired data. This loss usually occurs when a project is exported from BIM to a 2D CAD format or is printed to paper. Project data is then gradually reconstructed in another software platform. The upper line represents a more ideal paradigm where data and knowledge are gradually increased throughout the life of the project—a paradigm supported by BIM and full interoperability.
While full interoperability between BIM platforms is the ideal scenario, we realize that you are likely to be working with constituents who are using 2D CAD software or non-BIM 3D modelers. This chapter will show you not only how to export data and use imported data in a variety of ways but also when and why to apply different settings to ensure the best results.
FIGURE 8.1 The BIM curve shows loss of data without interoperability at project milestones.