
Analytic Visualization
There are two key models of communication: analytic and photorealistic. Think for a moment about Google Maps: there's an option to view both Map and Satellite modes. Think of the Map mode as your analytic view and the Satellite mode as your photorealistic view. Both views are important depending on what you're trying to communicate. If you're simply trying to understand directional information, the Map view is better. But if you're trying to show someone what something looks like with regard to trees and other real-world features, the Satellite view has obvious advantages.
It's also interesting to note that real-time information is easier to maintain in analytic views. For example, Google Maps has the option to show live traffic data. But this doesn't mean that they're showing actual cars moving on actual streets in photorealistic mode. Rather, they're color-coding the streets based on overall traffic patterns and movement.
The same is going to be true when you're visualizing your project in Revit. More often than not, you'll have the ability to show analytic information in real time. But showing photorealistic renderings of your project will require additional time (perhaps even days) in order to render your views.
Therefore, analytic visualization abstracts your model to communicate information that is not available by viewing the project literally. For example, massing studies are analytic representations of the building's overall form during the earliest design stages. Massing is useful in order to visualize geometric proportion and site context and also for creating sun and shadow studies as well as preliminary energy analysis.
Even as you get into more of the project development and detail, materials may be a distraction whereas textures may not. Keeping your materials abstract and analytic allows you to help keep your focus on communicating the big ideas of your project. For example, does the spatial arrangement elegantly fulfill the design requirements? How is the vertical/horizontal stacking? We'll show you how to communicate these ideas in the following sections.
Monochromatic Views
Traditionally, architects built monochromatic, physical models that communicated the essence of the design without being too literal too soon. You can accomplish the same technique in Revit.
For example, take a look at the rendering in Figure 12.1, which has been created by rendering the view with all the default materials active.
The challenge is that in order to get the materials correct, you'll have to commit a significant amount of time to select, test, edit, and refine many material selections for an otherwise simple view that's quite early in the design stage. You don't have time for resolving all this specificity when doing so might result in something having the right material but in the wrong location.
Figure 12.2 shows the same view rendered analytically, with all the materials set to an abstract matte white setting.
FIGURE 12.1 Default material rendering

FIGURE 12.2 Abstract rendering

By selecting a matte material for everything in the view, you're able to focus on form–space and light–shadow relationships. Using the graphic overrides that are available with the Phasing tool can create a rendering like this quickly and easily. This technique is much faster than trying to select neutral materials for everything in your view. Here are the steps to create a matte rendering using the material overrides in Phasing:
- Open the Phasing settings and select the Phase Filters tab (Figure 12.3).
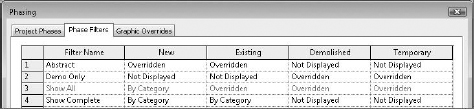
- Create a new phase filter called Abstract. Set the New and Existing material assignments to Overridden.
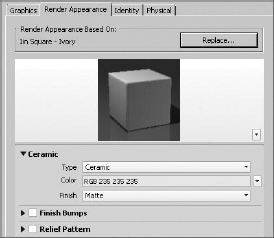
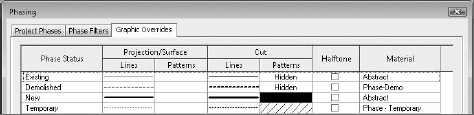
 Go to the Graphic Overrides tab and create a new material assignment called Abstract (Figure 12.4). For the actual material assignment, select the Render Appearance tab and choose the Ivory Ceramic material with a matte finish. This material will give the rendering a nice overall white finish without too much reflectivity.
FIGURE 12.4 Material assignments
- Now assign this material to your New and Existing objects (Figure 12.5).
FIGURE 12.5 Assigning abstract material
That's it! When you want to render a project view with this abstract material assignment, simply assign the phase filter and phase, and you'll get an abstract, matte rendering as a result (Figure 12.6).
FIGURE 12.6 Phase and phase filter
![]()
The previous example was an analytic rendering of a 3D view. But you can also see analytic information in a number of view types, not just 3D but also in 2D views. For example, color-filled room and area plans illustrate information about your project's spaces that are a representation of the space type.
Project Parameters
Viewing information about your project is easy, and it has to do with view filters. In this section, first you'll create a view filter based on a project parameter, and then you'll create one to illustrate a user-defined project parameter. A filter can be used to alter the default display properties of elements on a per-view basis. As you can see from the Filters dialog box in Figure 12.7, you can apply up to three filters to a single view to override the graphic values of 2D and 3D content as well as spaces.
FIGURE 12.7 Filters dialog box
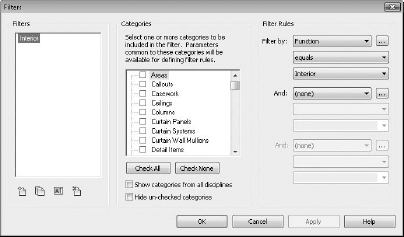
Figure 12.8 shows a simple example of how this works. In the view, there are walls that are two-hour rated. You'd be able to see this in a schedule, but how would you see it in a project view (2D or 3D)?
- First, open the Filters tab in the Visibility/Graphic Overrides dialog box (Figure 12.9). Click Add to begin the process of creating and applying a new filter.
- Create a new filter called Rated Walls, as shown in Figure 12.10. Click OK and be sure to select Walls in the Categories option and then Filter Rules so that the graphic override will only be applied to walls when the rating equals a value of 2.
FIGURE 12.9 Selecting the Filters tab
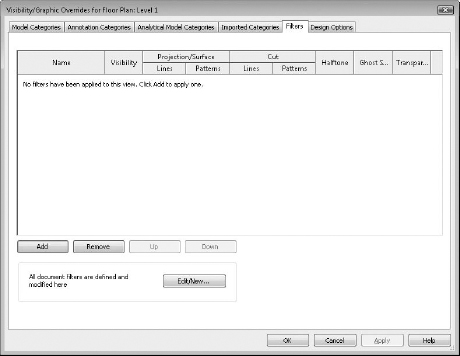
FIGURE 12.10 Creating the filter, category, and filter rules

- When you return to the Visibility/Graphic Overrides dialog box, you'll see the filter is ready to be applied (Figure 12.11).

- Override the Projection, Surface, and Cut patterns, as shown in Figure 12.12.
FIGURE 12.12 Graphic overrides

- When you're finished, click OK twice to return to the view of the project. You'll see that the filter is overriding the project-defined graphics of the two-hour rated walls (Figure 12.13).
FIGURE 12.13 Applied filter in Shaded view


What's wonderful about this is that you're able to visually coordinate and verify your project schedules with project views that confirm what is being described in the schedules. This even works in Hidden Line view, as shown in Figure 12.14. Changing elements in the schedule or from the project environment will immediately update in all views of your project.
FIGURE 12.14 Applied filter in Hidden Line view

User-Defined Parameters
Now let's look at another example where a particular parameter is not in the default project environment. In this example, we need to show the space as functionally complete, but a lot of the content that is shown isn't actually in the scope of work or contract. There are two particular challenges.
First, this kind of parameter might have to be applied across many categories of elements—not just furniture, equipment, and so on. Second, it may apply to one element, but not apply to another element in the very same category, name, and type. So, you'll want to make sure you're using an instance parameter (not a type parameter). Here are the steps:
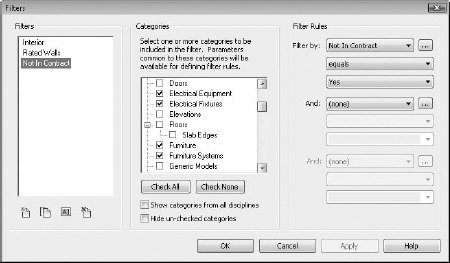
- Return to your Filters dialog box and create a new filter named Not In Contract.
- Make sure that you select numerous categories of elements that you want to be able to distinguish as Not In Contract, as shown in Figure 12.15. When you're done, select More Parameters from the Filter Rules drop-down list.
FIGURE 12.15 Multicategory selection

- Now select the same categories, as shown in Figure 12.16. This user-defined project parameter will allow you to distinguish elements across a number of categories.
FIGURE 12.16 User-defined instance parameters

- Apply your parameter to the filter. In this case, you're instructing Revit to override the graphics when the value of Not In Contract equals Yes (Figure 12.17).
FIGURE 12.17 Filter parameters
- Returning to the Filters tab in the Visibility/Graphic Overrides dialog box, you'll define how the graphics will be overridden. Once again, you're overriding the surface pattern with a solid color, this time yellow (Figure 12.18).
- Select elements from the categories that you've just created a filter for. You'll notice that as you select the object in your file, the instance parameter is highlighted (Figure 12.19).
FIGURE 12.18 Graphic overrides for the Not In Contract filter

FIGURE 12.19 Instance parameters

Select this value. As you do, the components will have the solid color applied, as shown in Figure 12.20, because the filter that you created now applies to the elements that you've selected, even in Hidden Line views!
FIGURE 12.20 Not In Contract graphic override

Identifying Design Elements
Finally, this process can be valuable for identifying “generic” host design elements as you move between design iteration and design resolution. Figure 12.21 shows a filter that has been applied to a view to highlight any walls, floors, ceilings, or roofs that have the term Generic in their family name.
FIGURE 12.21 Identifying generic elements

Now you can quickly identify what needs more detail from within your project. Revit's default template already uses the term Generic to describe basic design host elements, which makes them easy to filter, as shown in Figure 12.22.
FIGURE 12.22 Generic host element filter

Solar and Shadow Studies
Sun and shadow studies are another analytic visual style that allows you to communicate natural lighting based on your project's location, orientation, and time of year. The sun's path is also displayed (Figure 12.23), and you can edit the path of the sun both directly and indirectly.
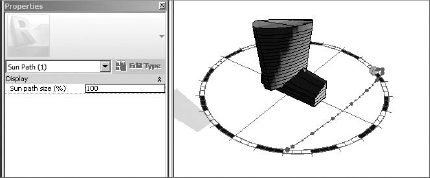
The size of the sun's path may need to be relatively larger or smaller depending on the size of your project or project context. To modify the size of the path, select the sun path and then select the Properties menu. Figure 12.24 shows the path at 100 percent.

FIGURE 12.24 Sun path properties at 100 percent
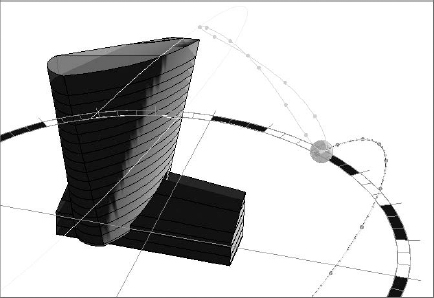
This would be fine for a sun and shadow study of the massing study with no context. But if you need to show additional context, you'll want to increase the size of the sun path. This is shown in Figure 12.25. The path has increased to 200 percent. The building seems relatively smaller, but the size of the sun path has increased.
FIGURE 12.25 Sun path properties at 200 percent

The sun path can be activated from the View Control Bar (Figure 12.26) as well as the Lighting menu in the Rendering window.
FIGURE 12.26 Activating the sun path

Selecting the sun path directly in the view will allow you to edit the path by dragging to change the date (Figure 12.27).
FIGURE 12.27 Editing the sun path
The other option for editing the sun path is to open the sun settings. Opening the sun settings (Figure 12.28) allows you to more specifically select the settings for your particular view and solar study type.
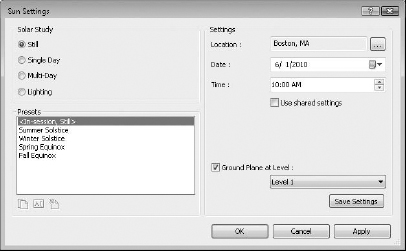
There are four types of solar studies that you can create in Revit:
- The Still setting allows you to create a study of a particular time, date, and location.
- Single Day allows you to create a study over an entire day at intervals of 15, 30, 45, and 60 minutes.
- Multi-Day allows you to create a sun study over a range of dates at intervals of an hour, a day, a week, and a month.
- A Lighting study is not related to a particular time, date, or place. It's more useful for adding graphic depth and texture with “Sunlight” from an analytic top right or top left.
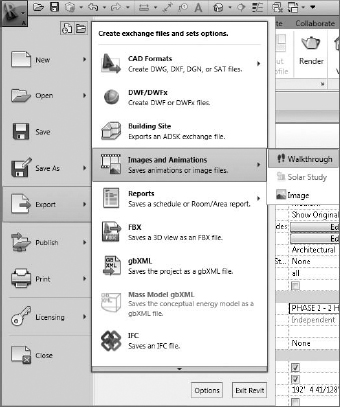
Single images are created using the Rendering dialog box. However, animations of single and multiday solar studies are created by clicking the Application menu and selecting Export ![]() Images And Animations
Images And Animations ![]() Solar Study (Figure 12.29).
Solar Study (Figure 12.29).
FIGURE 12.29 Animation export path
You'll then be given an option to export the animated solar study using a number of graphic styles (Figure 12.30). Selecting the Rendering option will sequentially render all the frames. This will take considerably longer than any of the other options, which are effectively taking sequential screen captures.
FIGURE 12.30 Animation length and format

The difference in time needed to render a view compared to exporting screen captures can be quite considerable. For example, exporting a single day consisting of 36 frames (15-minute intervals) as screen captures can take as little as 1 minute (at a rate of 1 frame every 2 seconds). Yet rendering the same number of frames could easily take 3 hours (at a rate of 5 minutes per frame and a total time of 180 minutes)!
Analytic visualization is incredibly useful for quickly communicating information about your project in a way that isn't literally associated with the actual real-world material assignments of your project elements. While photorealistic visualization would render wood as “wood,” an analytic visualization could be used to identify which wood materials were sustainably harvested, recycled, or LEED certified. Analytic visualization is concerned about what something means, not just what it looks like. Because analytic visualizations can often be viewed in real time, your project information remains visually concurrent and up-to-date.