Working with Tracepoints (When Hit Option)
Tracepoints enable you to emit data to the Output window or run a Visual Studio macro when a specific breakpoint is hit. You then have the option to break into the debugger (like a regular breakpoint), process another condition, or just continue executing the application. This capability can be useful if you want to keep a running log of what is happening as your application runs in debug mode. You can then review this log to get valuable information about specific conditions and order of execution when an exception is thrown.
You can set tracepoints explicitly by right-clicking a line of code and choosing Insert Tracepoint from the Breakpoint menu (see Figure 10.32). This simply enables the Breakpoint Settings dialog in the code editor and automatically enables an Action. Figure 10.33 shows setting the message for the action inside this editor. You can also enable an Actions option for any given breakpoint. Doing so adds tracking to the breakpoint.


The options available for logging and action include logging a message to the Output window and continuing execution. The first option, logging a message, enables you to output data about your function. You can use a number of keywords to output data, such as $FUNCTION for the function name and $CALLER for the name of the calling function. Additional keywords include: $ADDRESS, $CALLSTACK, $PID, $PNAME, $TID, and $TNAME. You can also output your specific variable values. You do so by enclosing the variable names in curly braces.
The Continue execution option enables you to indicate whether this is a true tracepoint or a breakpoint that contains a tracing action. If you choose to continue, you get only the trace action (message/macro). If you indicate not to continue, you get the trace action, and the debugger stops on this line of code, just as with a regular breakpoint. This is essentially applying an action to a standard breakpoint.
You can also combine tracepoint actions with conditions. When you do so, the action fires only when the breakpoint condition is met.
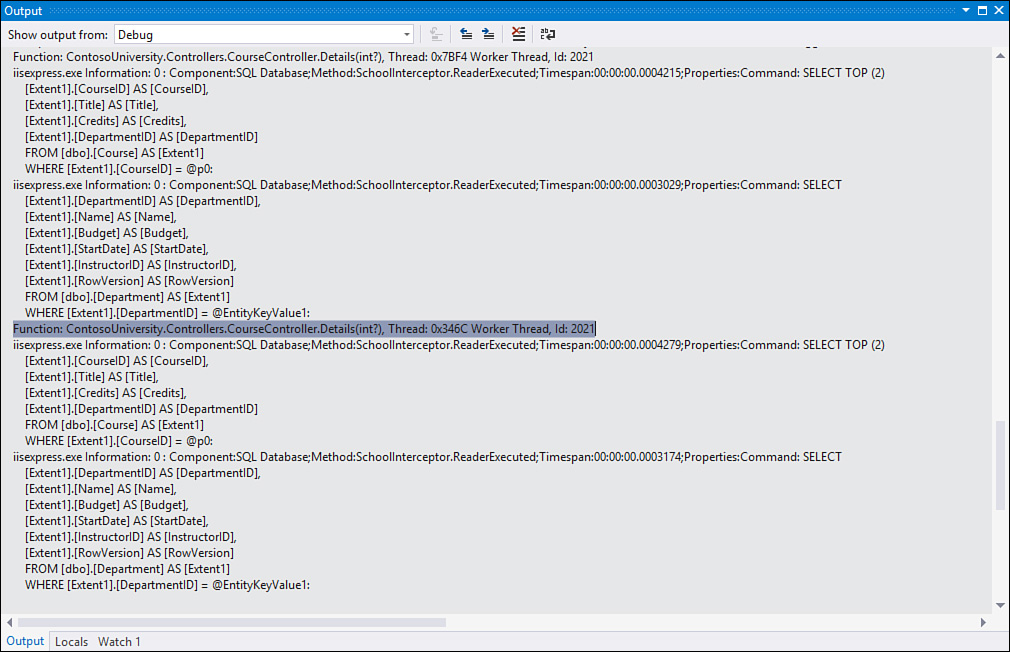
For example, suppose a tracepoint is set inside the CourseController.Details method. Imagine this tracepoint prints a message to the Output window when the line of code is hit and simply continues executing the application. Imagine, too, you set a condition on the breakpoint to only break when a certain course is being accessed. The message we intend to print is as follows:
Function: $FUNCTION, Thread: $TID $TNAME, Id: {id}
This message prints the function name, the thread ID and name (if any), and the value of the variable, id. Figure 10.34 shows two passes through the tracepoint output in the Output window (Debug, Windows, Output). The message is intermingled with other messages. The first message is at the top of the Output window; the second is highlighted.