Viewing Data in the Debugger
After the debugger has thrown you into break mode, the next challenge is to filter all the data that your application is emitting. Getting to the right data helps you find and fix problems faster. Visual Studio tries to make the data available where you want it. For example, DataTips show you variable values right in the code editor. There are many similar examples in the way Visual Studio shows debugging data when and where you need it, which are covered throughout the following sections.
Watching Variables
A common activity in a debug session is to view the values associated with the many variables in your application. Various windows are available to help you here. The two most obvious are the Locals and Autos windows.
Locals Window
The Locals window shows all the variables and their values for the current debug scope, which gives you a view of everything available in the current, executing method. The variables in this window are set automatically by the debugger. They are organized alphabetically in a list by name. In addition, hierarchy is shown with variable members listed as a tree-based structure. When the debugger breaks on an exception, it appears as $exception in the list.
Figure 10.35 shows an example of the Locals window. In it, you can see the sample Contoso University application paused while executing a call to get student details for editing. Notice that the db object (of type SchoolContext) is highlighted and expanded to show the various properties and fields associated with this object. If you break in a nonstatic method, the current instance is referenced by the this local that appears expanded. The Value column shows the content of variables and fields, and it turns red when it changes, like the id local at the bottom of Figure 10.35.

Tip
You can edit a value in the Locals or Autos window by right-clicking the variable and choosing Edit Value from the context menu. You can then change the value of the variable directly from within the window (similar to changing variable values using the Immediate window).
The Autos Window
Often, viewing all the locals provides too many options to sort through. This can be true when there is just too much in scope in the given process or function. To home in on the values associated with the line of code you are looking at, you can use the Autos window, which shows the value of all variables and expressions that are in the current executing line of code or in the preceding line of code. This allows you to really focus on just the values you are currently debugging.
Figure 10.36 shows the Autos window for the same method as was shown in Figure 10.35. Notice there are not a lot of difference in this example. However, the Autos window does show the additional call to db.Students, which is the active code in the debug session. The Autos window tries to anticipate the items you might need to review and shows their values.

FIGURE 10.36 You can use the Autos window to automatically get VARIABLE values for the last executed and the currently executing line of code.
The Watch Windows
The Visual Studio Watch windows enable you to set a custom list of variables and expressions that you want to keep an eye on. In this way, you decide the items in which you are interested. The Watch windows look and behave just like the Locals and Autos windows. In addition, the items you place in Watch windows persist from one debug session to another.
You access each Watch window from the Debug menu (Debug, Windows, Watch) or toolbar during an active debug session. The four Watch windows are named Watch 1, Watch 2, Watch 3, and Watch 4. Having four Watch windows enables you to set up four custom lists of items you want to monitor. This capability can be especially helpful if each custom list applies to a separate scope in your application.
You add a variable or an expression to the Watch window from either the code editor or the QuickWatch window. If you are in the code editor during a debug session, select a variable or highlight an expression, right-click, and choose the Add Watch menu item. This takes the highlighted variable or expression and places it in the Watch window. You can also drag and drop the highlighted item into a Watch window. Also, from the Autos and Locals windows, you can right-click a variable and select Add Watch.
Note
Watch windows now support lambda expressions; you can write a lambda expression as a Watch “variable” and monitor the value of the expression within the debug Watch window.
QuickWatch
The QuickWatch dialog enables you to quickly view the result of a single variable or expression; you can also add an item from QuickWatch to an existing Watch window.
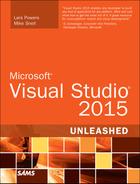
You set a QuickWatch item by highlighting it in the code editor, right-clicking, and choosing QuickWatch from the context menu. From the QuickWatch window, you can write expressions and add them to the Watch window. When writing your expression, you have access to IntelliSense. Figure 10.37 shows the QuickWatch window; notice here we add a watch for the expression id != null.

FIGURE 10.37 The QuickWatch window enables you to define expressions and monitor their results during a debug session.
The item you add to QuickWatch is evaluated when you click the Reevaluate button. Clicking the Add Watch button sends the variable to the Watch 1 window.
DataTips
DataTips enable you to highlight a variable or an expression in your code editor and get information right in the editor. This feature is more in tune with how developers work. For example, if you are looking at a line of code, you might highlight something in that line to evaluate it. You can do this by creating a QuickWatch. However, you can also simply hover your mouse over the item, and its data is unfolded in a DataTip. In addition, Visual Studio lets you pin your data tips directly to your code window so that they are always visible during a debug session inside your code editor.
Figure 10.38 shows a DataTip active in a debug session. Here, the cursor is positioned over a string variable. If it were a complex object with multiple properties, the IDE would present a plus sign to allow you to expand the variable to unfold the many properties and fields of the object. Notice, too, you can right-click the member and edit its value, copy it, or add it to the Watch window (as shown). Also, notice the magnifying glass icon next to the items in the list; it allows you to select a specific visualizer for a given item (more on visualizers shortly).

Tip
The DataTips window can get in the way of viewing code. Sometimes you need to see the DataTips and the code underneath. In this case, pressing the Control (Ctrl) key makes the DataTips window transparent for as long as you hold the key.
Pinning a Data Tip
In Figure 10.38, the highlighted member, sortOrder has a pin icon on the far right of the window. This icon enables you to pin your DataTip to the code window, which ensures this DataTip is displayed each time you pass through the code in the debugger. This is a faster, more accessible version of a Watch window.
You can pin all sorts of code items as DataTips. You can pin an entire object, or, in the case of the example, a single variable. You can also move pinned DataTips around in the editor to position them accordingly. In Figure 10.39, we have pinned a DataTip to the code editor. Note that when the debug session is over, the indicator margin in the code window includes a pin to indicate there is a DataTip pinned to the given line of code. After a DataTip is pinned, you can highlight it to remove it, unpin it, or add your own comment to the DataTip.

FIGURE 10.39 You can pin DataTips to the code editor to provide easier variable watching during a debug session.
Tip
You can use the Export and Import options from the Debug menu to save your DataTips to an XML file and reuse them on another computer.
PerfTips
The Visual Studio 2015 debugger has added performance information directly inside the code editor. This information is available during an active debug session. To see line by line performance, you can execute a line of code, run to breakpoint, or step over a line; you then simply hover over the line of code that was executed, and you can see the duration of the execution (in milliseconds). This makes recognizing performance issues in your code much easier.
Clicking the performance tip in the code editor brings up the new Diagnostic Tools pane as shown in Figure 10.40. This is the diagnostic information being captured about your running application (more on this in a moment). Here you can use the diagnostic window to see time elapsed between steps in the Debugger (among other things).

FIGURE 10.40 Select a PerfTip in the editor to bring up diagnostic information about lines of code previously executed.
Diagnostic Tools
Visual Studio 2015 includes the new Diagnostic Tools window that automatically begins tracking performance information about your running code during a debug session. You access this tool from the Debug menu, Show Diagnostic Tools option (or CTRL+Alt+F2).
This Diagnostic Tools window (shown in Figure 10.41) shows running graphs over a timeline at the top of the window and detailed information in tabs at the bottom half of the window. You can use this information to find where your code is using too much memory or CPU. The tool works closely with your debugger to break the graphs into sections based on when you are in the debugger stepping through code versus when you are simply running your application.

FIGURE 10.41 Visual Studio 2015 provides the Diagnostic Tools window to give you profiling data as your application is being debugged.
There is also a timeline across the top of the window that shows a running time as your application is being debugged. You can use the toolbar in the window to zoom in and out of this timeline. You can also select a section of the timeline and then use slider bars to select a start and end time to zero in on a portion of your data. This can be useful, for example, if you see a spike in memory usage. You can zero in on this portion of the data and then use the Memory Usage tab to take a snapshot of the objects that were running on the heap.
Visualizing Data
When you are looking at variable values, what you really want to get to is the data behind the object. Sometimes this data is obscured by the object model itself. For example, suppose you are looking for the data that is contained in a DataSet object. To find it, you have to dig many layers deep in a Watch window or a DataTip. You have to traverse the inner workings of the object model just to get at something as basic as the data contained by the object. If you’ve spent much time doing this, you know how frustrating it can be.
Visual Studio offers a quick, easy way to access the data contained in an object. It does so through a tool called a visualizer. Visualizers are meant to present the object’s data in a meaningful way.
A number of visualizers ship with Visual Studio by default. The following list highlights many of them:
![]() HTML—Shows a browser-like dialog box with the HTML interpreted as a user might see it.
HTML—Shows a browser-like dialog box with the HTML interpreted as a user might see it.
![]() XML—Shows the XML in a structured format.
XML—Shows the XML in a structured format.
![]() JSON—Shows JSON structured results in an easier-to-read format.
JSON—Shows JSON structured results in an easier-to-read format.
![]() Text—Shows a string value in an easy-to-read format.
Text—Shows a string value in an easy-to-read format.
![]() WPF Tree Visualizer—Enables you to view the WPF application events in a meaningful way. We cover WPF applications in Chapter 21, “Building WPF Applications.”
WPF Tree Visualizer—Enables you to view the WPF application events in a meaningful way. We cover WPF applications in Chapter 21, “Building WPF Applications.”
![]() DataSet—Shows the contents of the
DataSet—Shows the contents of the DataSet, DataView, and DataTable objects.
There is also a framework for writing and installing visualizers in Visual Studio so that you can write your own and plug them into the debugger. You can also download more visualizers and install them. The possibilities of visualizers are many—as many ways as there are to structure and view data. A few ideas might be a tree-view visualizer that displays hierarchical data or an image visualizer that shows image data structures.
You invoke a visualizer from one of the many places you view data values, including Watch windows and DataTips. Visualizers are represented by a magnifying glass icon. Refer to Figures 11.38 or 11.39 to see an example of the magnifying glass icon used to launch a visualizer. As an example, instead of digging through the object hierarchy in a Watch window to get at data, you can invoke the DataSet visualizer right from a DataTip. Figure 10.42 shows the visualizer in action for a string variable named query.

FIGURE 10.42 Use visualizers (magnifying glass icon) such as the Text Visualizer to make data easier to view in the debugger.