
Debugging Crash Information (Dump Files)
It is often not possible to re-create all environment- or user-specific scenarios in a development environment. Of course, many application bugs or crashes happen without the developer present or a copy of Visual Studio running. In these cases, you can use tools to generate a dump file of the application state at the time of the issue.
Dump files save information about the state of your application. Dump files are typically created in response to a major bug or an application failure (crash). The dump file can then be sent to a developer. A developer can open the file and connect it with the source code and debug symbols to debug the state of the application at the time of the issue.
Dumping Debug Information
You can save running (but paused or on a breakpoint) .NET managed code as dump files. You have a few options for creating these files. In a debugging setting, you can use Visual Studio to create these files and share them with other developers as necessary. Of course, other applications can also create mini dump files, which then can be opened by Visual Studio for debugging. Your options for creating dump files include the following:
![]() Use the Save Dump As option from the Debug menu in an active debug session of Visual Studio.
Use the Save Dump As option from the Debug menu in an active debug session of Visual Studio.
![]() Attach to a running (or crashed) remote process from Visual Studio. (See the information about attaching to a process earlier in this chapter.) You can then break into that process and save the dump file using the Save Dump As option.
Attach to a running (or crashed) remote process from Visual Studio. (See the information about attaching to a process earlier in this chapter.) You can then break into that process and save the dump file using the Save Dump As option.
![]() Microsoft provides the utility UserDump as part of its OEM Support Tools. You can use this utility to create dump files that Visual Studio can read.
Microsoft provides the utility UserDump as part of its OEM Support Tools. You can use this utility to create dump files that Visual Studio can read.
![]() Microsoft provides the Autodump+ utility as part of the Microsoft Debugging Tools for Windows. It, too, creates dump files for use by Visual Studio.
Microsoft provides the Autodump+ utility as part of the Microsoft Debugging Tools for Windows. It, too, creates dump files for use by Visual Studio.
We focus on how Visual Studio creates dump files. A quick web search will lead you to the download for other dump-creating utilities.
Using Visual Studio to Create a Dump File
Creating a dump file with Visual Studio is straightforward. You stop (or break into) the application at the point you want to capture. This might be at a place in the testing where there is a known issue. You then select the Save Dump As option from the Debug menu. The Save Dump As dialog box is then displayed, as shown in Figure 10.57.
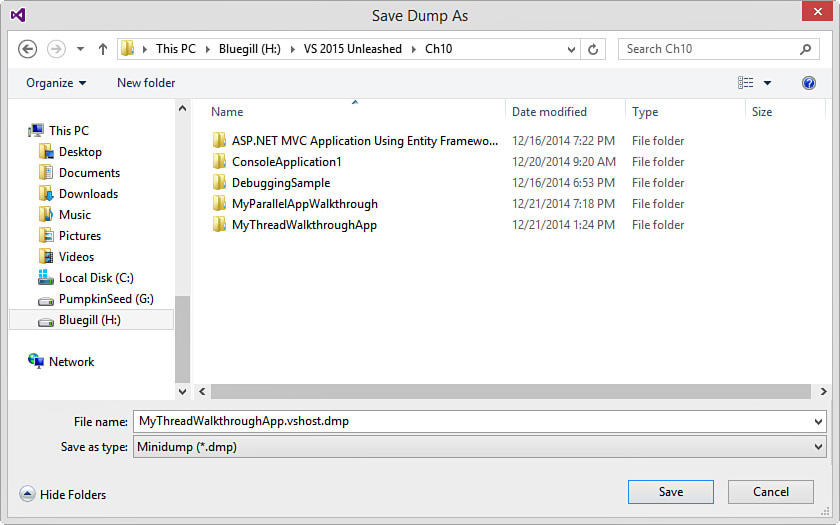
Notice that when you save a dump file, you can choose between creating the file with heap information and without. The heap information is often not required for many managed code debugging scenarios. Thus, you can save your file without it and conserve hard drive space.
Debugging with a Dump File
The first step to debugging with a dump file is to open the file from the File menu (File, Open, File) or by double-clicking the dump file. When you open a dump file, the new Dump File summary page appears. This page displays information about the dump file, such as when the dump file was created, the version of the OS and CLR that was running when the dump file was written, and the versions of the various other components (modules) that were running at the time. Figure 10.58 shows an example of this summary page. Notice that you can use the Modules search box to determine if a specific .dll or .exe was loaded at the time of the dump.

FIGURE 10.58 The mini dump summary page shows you both detailed information and next steps (actions) when you open a dump file.
The dump summary page provides a few actions. The two that developers use the most are Set Symbol Paths and Debug with Mixed. The Set Symbol Paths option enables you to indicate the paths to the symbol files (.pdb) that match the build of the application from which the dump originated. By default, Visual Studio looks for symbol files where your code executed. Therefore, if you dump and open that dump on the same machine, you have nothing more to set up. Visual Studio finds your symbol files. If, however, symbol files are created on a per-build basis and dumps can originate from anywhere, you have to use Set Symbol Paths to indicate where Visual Studio should find your latest symbols.
Important
Symbol files (.pdb) are important if you intend to debug a built application. For this reason, we recommend you store your symbol files in a safe location along with the compiled versions of your deployed code to make debugging a production issue using a dump much easier. Symbols should also be generated for Release builds.
Figure 10.59 shows an example of the Options, Debugging, Symbols dialog box. In the top part of the dialog box, you can set up a symbol location, which might be a server where builds are dropped or a local folder on your machine. Notice, too, that you can load the Microsoft Public Symbols from their servers. The middle section of the dialog box, Cache Symbols in This Directory, enables you to set up a local folder for caching symbols downloaded from a server, which saves time in that the files can load from a local source. You indicate which modules of your symbol files should be loaded (or excluded) in the last part of the dialog box. You can set this option to All Modules.

FIGURE 10.59 You can use the Symbols options to indicate a location for symbol files and set up a local cache.
The other option available on the mini dump page (refer to Figure 10.58), Debug with Mixed, enables you to start the debugger using the data found in the mini dump file. It is helpful to know that a .NET symbol file (.pdb) essentially contains information about your source files path, variable names, and code line numbers. When you debug a dump file, Visual Studio looks at the .pdb files it finds (searching your code or your symbol directory) and tries to use this information to find your code files on your machine. If it can locate your code, it opens the code file and gives you a rich debugging experience.