Indicating When to Break into Code
You control the debugger through breakpoints and tracepoints. With these, you can tell the debugger when you are interested in breaking into code or receiving information about your application. Breakpoints enable you to indicate when the debugger should stop on a specific line in your code. Tracepoints were introduced in Visual Studio 2005. They are a type of breakpoint that enables you to perform an action when a given line of your code is reached. This typically involves emitting data about your application to the Output window. Mastering the use of breakpoints reduces the time it takes to zero in on and fix issues with your code.
The most common method of setting a breakpoint is to first find the line of code on which you want the debugger to stop. You then click in the code editor’s indicator margin for the given line of code. Doing so places a red circle in the indicator margin and highlights the line of code as red. Of course, these are the default colors; you can change the look of breakpoints in the Tools, Options dialog box under the Environment node, Fonts and Colors.
There are a few additional ways to set breakpoints. For instance, you can right-click a given line of code and choose Insert Breakpoint from the Breakpoint context menu; this will set a breakpoint using the indicator margin. You can also choose New Breakpoint from the Debug menu (or press Ctrl+D, N) to open the New Breakpoint dialog box, in which you can set a function breakpoint. We cover this in the next section.
Setting a Function Breakpoint
A function breakpoint is just a breakpoint that is set through the New Breakpoint dialog box (see above as to how to invoke). It is called a function breakpoint because it is typically set at the beginning of the function (but does not need to be). From the New Breakpoint dialog box, you can manually set the function on which you want to break, the line of code in the function, and even the character on the line.
If your cursor is on a function or on a call to a function when you invoke this dialog box, the name of the function is automatically placed in the dialog box, or you can type a function name in the dialog box. Figure 10.22 shows the New Breakpoint dialog box in action. Notice that you can manually set the line and even the character on the line where the breakpoint should be placed (for lines of code that include multiple statements).

FIGURE 10.22 You can set a function breakpoint for a given function by name; Visual Studio will find the function in your code and set the breakpoint on your behalf.
In the example in Figure 10.22, the cursor is on a call to PopulateAssignedCourseData. Notice that the New Breakpoint dialog has the Use IntelliSense to verify the function name option selected. Clicking the OK button will let the IDE find the function and set a breakpoint on it inside your code. It does not set a breakpoint on the line calling the function. To do that, you could just click the indicator margin for that line of code.
Note
If you specify an overloaded function in the New Breakpoint dialog box, you must specify the actual function on which you want to break. You do so by indicating the correct parameter types for the given overload. For example, if you have a function called GetCustomer that takes a customerId parameter (as an int) and an overload that also looks up a customer by name (as a string), you indicate this overload in the Function field as GetCustomer(string).
Recognizing the Many Breakpoints of Visual Studio
Visual Studio has a number of breakpoint icons. These icons enable you to easily recognize the type of breakpoint associated with a given line of code. For instance, a round, filled circle is a common breakpoint, whereas a round, hollow circle represents a common breakpoint that has been disabled. We’ve provided Table 10.3 for reference purposes. It shows some of the more common icons associated with breakpoints and presents a description of each.

Working with the Breakpoints Window
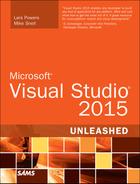
The Breakpoints window in Visual Studio provides a convenient way to organize and manage the many conditions on which you intend to break into the debugger. You access this window from the Debug menu or toolbar (or by pressing Ctrl+D, B). Figure 10.23 shows the Breakpoints window inside Visual Studio with a number of active breakpoints.
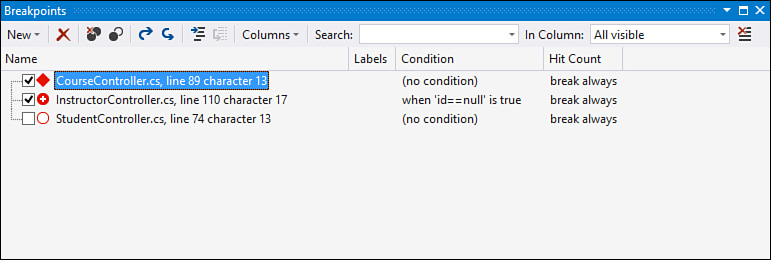
The Breakpoints window also has its own toolbar (refer to Figure 10.23) that enables you to manage the breakpoints listed in the window. The commands available from the toolbar are described in detail in Table 10.4.

Managing Each Individual Breakpoint
The Breakpoints window also gives you access to each breakpoint. It serves as a launching point for setting the many options associated with a breakpoint. For example, you can disable a single breakpoint by toggling the check box associated with the breakpoint in the list. In addition, you can set the many properties and conditions associated with a breakpoint. Figure 10.24 shows a disabled tracepoint and a disabled breakpoint; it also shows the context menu associated with an individual breakpoint. Notice, too, that this dialog is for an active debug section. The highlighted breakpoint (bold) is the current, active breakpoint in the IDE awaiting instruction from the developer.

Notice that from this context menu for a breakpoint, you can delete the breakpoint and navigate to its related source code (Go to Source Code). More important, however, is the access to setting the conditions and filters associated with the breakpoint. We cover using each of these options next.
Labeling Breakpoints
You can provide labels for your breakpoints, which enables you to define categories of breakpoints and quickly find them in the Breakpoints window. For example, you might want to set a number of breakpoints and tracepoints related to a specific scenario in your code, such as editing an instructor record or adding a new student. These breakpoints are useful when you need to modify and review this code. However, when you are working on unrelated code, you might want to turn a whole group of breakpoints off. Breakpoint labels support this scenario.
You label a breakpoint by selecting Edit Labels from the breakpoint context menu (refer to Figure 10.24 to see an example). The Edit Breakpoint Labels dialog box opens, as shown in Figure 10.25. Here you can add a new label and apply that label to the selected breakpoint. Alternatively, you can select one or more labels from the existing labels previously defined.

FIGURE 10.25 You can use the Edit Breakpoint Labels dialog box to label breakpoints to make them easier to find and work with as a group.
You can work with the breakpoint labels inside the Breakpoints window. You can sort the list by the Labels column, as shown in Figure 10.26. In addition, you can use the Search feature to find breakpoints based on keywords contained in the labels.

Breakpoint Conditions and Actions
Often, setting a simple breakpoint is not sufficient (or efficient). For instance, if you are looking for a particular condition to be true in your code (a condition that seems to be causing an exception), you would prefer to break based on that condition. This saves the time of constantly breaking into a function only to examine a few data points and determine that you have not hit your condition. You might also want to set an action to execute should the breakpoint be hit (such as logging information to the Output window). The BreakPoint Settings dialog allows you to set breakpoint conditions and actions.
Setting a Breakpoint Condition
A breakpoint condition enables you to break into the debugger or perform an action when a specific condition either is evaluated as true or has changed. Often, you know that the bug you are working on occurs only based on a very specific condition. Breakpoint conditions are the perfect answer for troubleshooting an intermittent bug.
There are three types of conditions you typically add to breakpoints: Conditional Expression, Hit Count, and Filter. There are a couple ways to add a condition to your breakpoint: inside the Breakpoints window and using the new breakpoint settings right inside the code editor.
To set a breakpoint condition from within the Breakpoints window, you select the breakpoint on which you want to apply a condition and then right-click it to open the context menu for the given breakpoint. Refer to Figure 10.24 for an example of the context menu; here you would select the Settings option to set a breakpoint condition (or action).
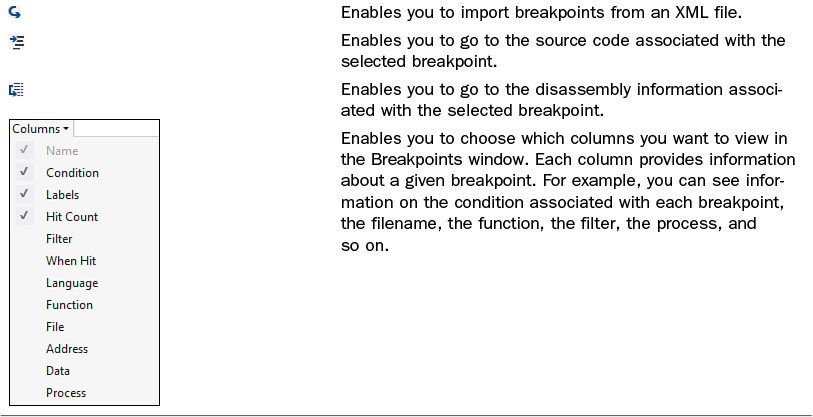
The other option is to launch the breakpoint settings dialog right inside your code editor. You do so by hovering over the breakpoint icon in the indicator margin of the code edit. This will show two icons: breakpoint settings (gear icon) and disable breakpoint (filled circle over an open circle). Figure 10.27 show the results of hitting the first icon: breakpoint settings.
FIGURE 10.27 You can use the Breakpoint Settings dialog box directly in the code editor to set a Boolean code condition that tells the debugger when to stop on your breakpoint.
Notice in Figure 10.27 that, when setting the breakpoint condition, you have access to IntelliSense. After setting the condition using the code editor, the settings window stays visible in your code editor and your breakpoint icon is given a plus sign. You can close this window if it is in your way. You can reopen by again hovering over the breakpoint icon and clicking the gear icon from the indicator margin.
When you set a condition expression as a condition (as shown in Figure 10.27), you have two options: Is True and Has Changed. The Is True option enables you to set a Boolean condition that, when evaluated to true, results in the debugger’s breaking into the given line of code.
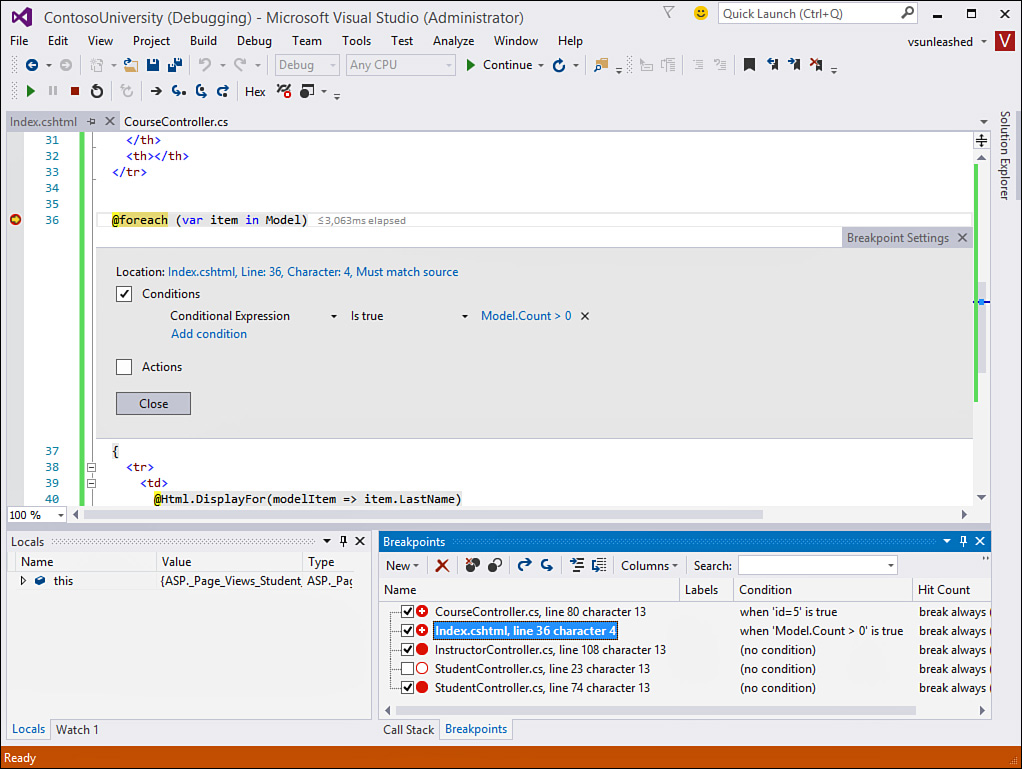
For example, suppose that you are notified of an error that happens when populating a collection of student objects. There are many options where you could set your breakpoint. Suppose you want to walk through code in your view (.cshtml page). You could do so by setting a breakpoint in the view and then setting a condition on that breakpoint. Figure 10.28 shows setting a conditional expression Is True condition Model.Count() > 0 to a breakpoint. This tells the debugger not to stop on this line of code unless this condition is met.
The other option for Conditional Expression breakpoints is Has Changed. This option tells the debugger to break when the value of an expression changes. The first pass through your code sets the value for the first evaluation. If the value changes after that, the debugger breaks on a given line. This capability can be useful when you have fields or properties with initial values and you want to track when those values are being changed. In addition, Has Changed can be useful in looping and if...then scenarios in which you are interested only in whether the results of your code changed a particular value.
Tip
Your breakpoint information is persisted between debug sessions. That is, when you close Visual Studio for the day, your breakpoints are still there when you return. This validates the time you might spend setting some sophisticated debugging options because they can remain in your application and be turned on and off as required. The options can also be exported to a file and shared with other developers or other computers.
Setting a Breakpoint Filter
Breakpoint filters enable you to specify a specific machine, process, or thread on which you want to break. For instance, if your error condition seems to happen only on a certain machine or within a certain process, you can debug this condition specifically with a filter. Filters are most useful in complex debugging scenarios in which your application is highly distributed.
You access this feature by adding a filter condition to a breakpoint from within the code editor window or the Breakpoint Settings dialog accessed via a right-click from the Breakpoints pane. When setting a Filter you can specify the machine by name, the process by name or ID, or the thread by name or ID. You can also specify combinations with & (and), || (or), and ! (not). This allows you to get to a specific thread on a specific process on a certain machine. Figure 10.29 shows the Breakpoint Settings dialog box; here we are adding another condition to an existing breakpoint. Notice the Intellisense dropdown; we can use it to stop provided that the running process is the development web server (ProcessName = "iisexpress.exe").
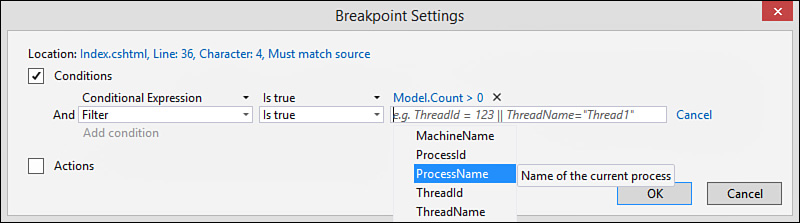
FIGURE 10.29 You can set a breakpoint filter to stop the debugger inside a specific process or thread or on a specific machine.
Using a Hit Count with a Breakpoint
Using Hit Count, you can tell the debugger that you want to break when a given line of code is reached a number of times. Typically, you can find a better condition than breaking based on Hit Count. However, this feature is useful when you can’t determine the actual condition but know that when you pass through a function a certain number of times, something bad happens. In addition, the Hit Count option might be more useful in tracepoint scenarios in which you are emitting data about what is happening in your code. You might want to write that data only periodically.
Figure 10.30 shows the Breakpoint Settings dialog box with a Hit Count condition being set.

This dialog box also provides a few options for setting the actual hit count condition. In the drop-down list to the right of Hit Count (Figure 10.30), the following options are available:
![]() = —Breaks when the hit count is equal to a number
= —Breaks when the hit count is equal to a number
![]() is multiple of—Breaks when the hit count is a multiple of a certain number
is multiple of—Breaks when the hit count is a multiple of a certain number
![]() >= —Breaks when the hit count is greater than or equal to a specified value
>= —Breaks when the hit count is greater than or equal to a specified value
Visual Studio breaks into your code when the hit count condition is met. Figure 10.31 shows an example. Notice that you have the option of clicking the Reset button and turning the hit count back to zero and continuing debugging from that point. Note that you can add any condition to a breakpoint during an active debug session.
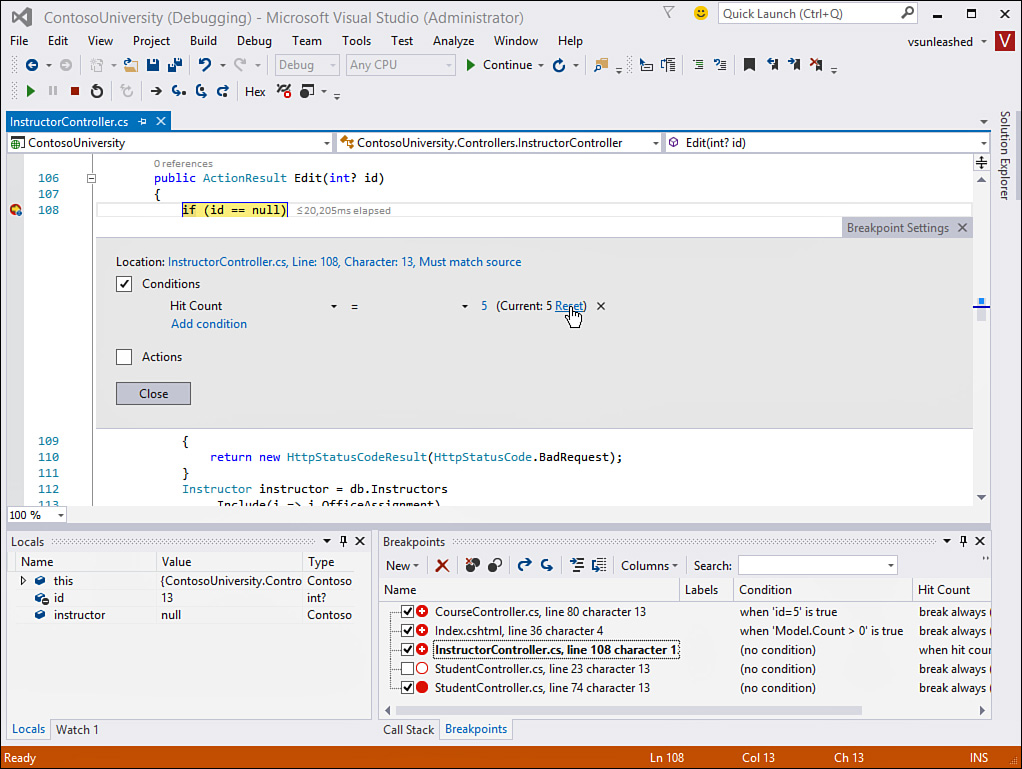
FIGURE 10.31 When the hit count condition is met, you have the option to reset the hit count from the editor.
Tip
You can combine all the breakpoint conditions we’ve discussed on a single breakpoint. For example, you may add a condition and a filter to a given breakpoint. Doing so allows you to create even more specific scenarios for debugging your application using breakpoints.