Debugging in the Text Editor
The text editor (more specifically, the code editor) has several interactive features that facilitate the code-debugging process. Debugging activities within the text editor primarily center on breakpoints and runtime code control. We cover general Visual Studio debugging in greater detail in Chapter 10.
A breakpoint is simply a location (a line of code) that is flagged for the debugger; when the debugger encounters a breakpoint, the currently executing program is paused immediately before executing that line of code. While the program is in this paused state, you can inspect the state of variables or even affect variable state by assigning new values. You can also interactively control the code flow at this point by skipping over the next line of code or skipping directly to another line of code and continuing from there, all without actually leaving the IDE.
Setting a Breakpoint
To set a breakpoint using the code editor, first locate the line of code you want to pause on and then click that line of code within the indicator margin. (Refer to Figure 6.5 for the location of the indicator margin.) This sets the breakpoint, which can now be visually identified by a red ball in the indicator margin. Hovering over the breakpoint indicator margin displays a ToolTip indicating some basic information about that breakpoint: the code filename, the line number within that code file, the type you are in (if any), and the line number within that type.
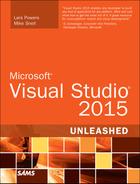
In Figure 6.23, a breakpoint has been set within a class called MessageMapper. The ToolTip information shows that you are on line 12 within the overall code file (Integration.cs).

Clicking the breakpoint again removes it.
The breakpoint we have set is a simple one in that it suspends the program on that line of code without regard for any other variable or factor. Simple breakpoints are, however, only the tip of the iceberg. Breakpoints support an extensive set of conditions used to fine-tune and control what will actually trigger the breakpoints. For instance, you can set a breakpoint to print a message, and you can specify different conditions for firing the breakpoint.
Configuring a Breakpoint
If you refer to Figure 6.23, you will see that, in addition to presenting a tooltip window with information about the breakpoint, there is a small, simple toolbar exposed directly above the breakpoint symbol. This toolbar has two buttons that allow you to configure the breakpoint or enable/disable the breakpoint. (Disabled breakpoints appear as empty red circles; enabled breakpoints appear as solid red circles.)
If you elect to configure the breakpoint, its settings will show directly within the code editor window. You can set a condition for the breakpoint (in other words, when should the breakpoint fire?) and tweak what exactly happens during the breakpoint triggering process. (This is referred to as an action.) In Figure 6.24, we have configured a breakpoint to fire on a specific conditional expression and break count.

Tip
Disabling a breakpoint, rather than deleting it, will preserve its locations and all of its settings in case you ever need to enable it again.
You can also access breakpoint settings by right-clicking the breakpoint indicator to show the context menu.
Tip
Visual Basic actually provides a command word that allows you to programmatically trigger a breakpoint within your code. The Stop statement, like a breakpoint, suspends execution of the executing code. This capability is useful when you’re running the application outside the IDE. Any time a Stop statement is encountered during runtime, the Visual Studio debugger launches and attaches to the program.
Although C# doesn’t have an internal, equivalent statement to Visual Basic’s Stop command, you can use the Debugger class to achieve the same thing: simply call Debugger.Break to force a breakpoint programmatically. You can even write code that will run only when under debugger control by checking the Debugger.IsAttached property. The Debugger class lives in the System.Diagnostic namespace.
Controlling the Flow of Running Code
When a program is run within the IDE, it continues along its path of execution through the code base until it hits a breakpoint or Stop statement, is paused manually, or terminates either by reaching the end of its code path or by being manually stopped.
Tip
The DVR-like controls and their shortcut keys (available under the Debug menu or on the Debug toolbar) are, by far, the easiest way to start, pause, or stop code within the IDE.
When a breakpoint is hit, the code editor visually indicates the line of code where execution has paused. Figure 6.25 shows a slightly modified version of the "Hello, World" program, suspended at a breakpoint. A yellow arrow in the indicator margin flags the next statement that will execute when you resume running the program. In this case, because the breakpoint is also here, the next statement indicator appears in the margin embedded within the breakpoint glyph.

When execution is paused, you can change the next line of code to be executed. By default, of course, this is the line of code where operations were paused. (Recall that execution stops just before running the line of code matched with the breakpoint.) But you can manually specify the next line of code to run by dragging the yellow “next statement” arrow to any other executable line within the code editor.
In Figure 6.26, this feature has been used to jump out of the WriteLine loop. Normal flow through the code has been circumvented, and instead of continuing to spin through the for loop, the program immediately executes the line of code just after the loop. You can see the arrow and highlighting that show the next line of code and the breakpoint are no longer at the same location within the code file.

You can also create a sort of virtual breakpoint by right-clicking on an executable line within the code editor window and selecting Run to Cursor from the editor’s context menu. This causes the program to run until it hits the line of code that you have selected, at which point it pauses much as if you had set a breakpoint there.