
Anatomy of the Code Editor Window
Editor windows, as you have seen, show up as tabbed windows within the IDE and are typically front and center visually in terms of windows layout. As you can see with the code editor window in Figure 6.5, each text editor window consists of four primary regions: a code pane, a selection margin, an indicator margin, and scrollbars.

These regions and their functionality remain the same for all editor types within the IDE.
The code editor for C# files also adds a set of user interface (UI) elements that are not present with the other language editors: three drop-down boxes at the top of the code editor window enable you to quickly navigate through source code by selecting a loaded project in the leftmost drop-down, a type contained within that project in the middle drop-down, and a specific type member (property, field, function, and so on) in the right drop-down for the selected type. This jogs the current cursor location directly to the indicated type.
The Code Pane
The code pane is the place where the document (source code, XML, and so on) is displayed and edited. This region provides basic text-editing functionality, in addition to the more advanced productivity features of the editor, such as IntelliSense.
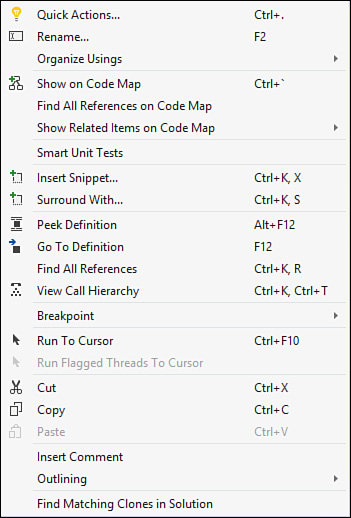
Right-clicking within the code pane provides a shortcut menu (see Figure 6.6) that includes standard cut, copy, and paste tools along with an assortment of other handy editing actions.
The Indicator Margin
The indicator margin is the slim gray-colored margin to the far left of the editor. This margin area is used to mark a line of code that contains a breakpoint or bookmark.
Figure 6.7 shows the "Hello, World" example with a bookmark placed on the Main routine and a breakpoint placed on the Console.WriteLine command.
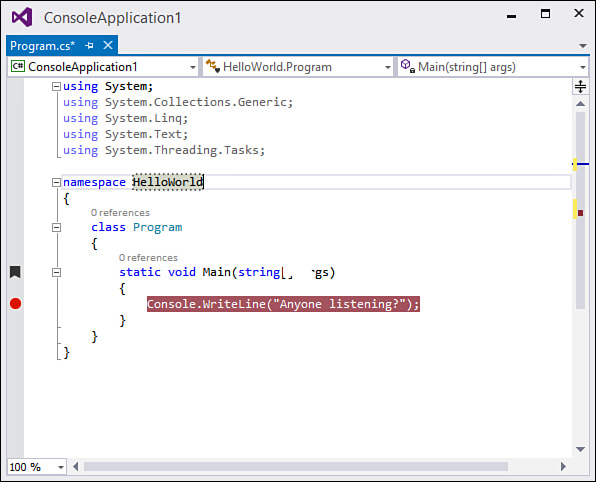
Clicking within the indicator margin toggles a breakpoint on or off for the line of code you have selected. (You will learn more about breakpoints later in this chapter and in Chapter 10, “Debugging Code.”)
The Selection Margin
The selection margin is a narrow region between the indicator margin and the editing area of the code pane. It provides the following:
![]() The capability to select an entire line of text by clicking within the selection margin.
The capability to select an entire line of text by clicking within the selection margin.
![]() A visual indication, via colored indicator bars, of those lines of code that have changed during the current editing session.
A visual indication, via colored indicator bars, of those lines of code that have changed during the current editing session.
![]() Line numbers (if this option has been turned on). See the following section in which we discuss customizing the text editor’s behavior.
Line numbers (if this option has been turned on). See the following section in which we discuss customizing the text editor’s behavior.
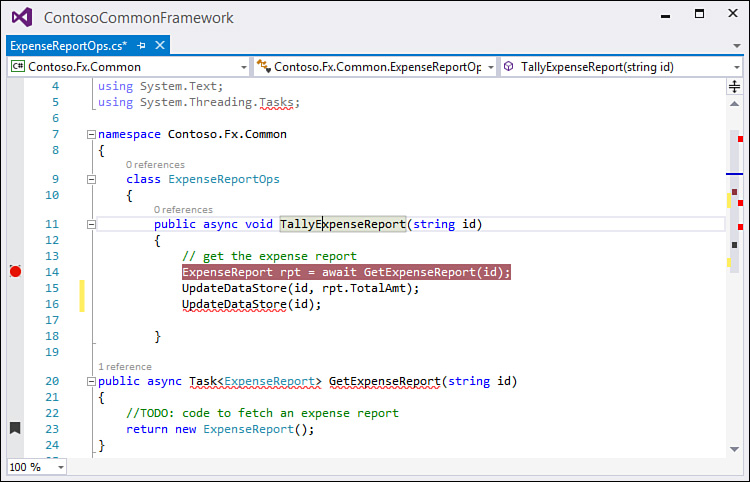
You can clearly see the “changed text” indicator and line numbers in action in Figure 6.8.

Tip
Visual Studio provides a dedicated toolbar for the text editor. You can view this toolbar by selecting View, Toolbars, Text Editor. It exposes buttons for the Member List, Quick Info, Parameter List, and Word Completion IntelliSense features, in addition to indenting buttons, commenting buttons, and bookmark navigation buttons. The navigation buttons are arguably the most useful because they provide easily accessible forward and back navigation through your code.
The Vertical Scrollbar
In addition to performing the obvious function of allowing you to scroll vertically within the code editor, Visual Studio can overlay various pieces of information onto the scrollbar. The options of what can be shown on the scrollbar are controlled on the Options dialog in the Scroll Bars section (see Figure 6.9). The following annotations can be added:
![]() Changes—Any unsaved edits made to the code
Changes—Any unsaved edits made to the code
![]() Marks—Breakpoints and bookmarks
Marks—Breakpoints and bookmarks
![]() Errors—Current compile errors in the code
Errors—Current compile errors in the code
![]() Caret position—The current cursor location within the file
Caret position—The current cursor location within the file

Figure 6.10 shows an example of a more complicated code set within the window. Note the annotations on the vertical scrollbar.
There is also an alternate “map mode” visualization that can be enabled for the vertical scrollbar. In map mode, a thumbnail visual of the code file is shown, along with all the annotation marks. This is a great way to instantly determine where you are within a large code file; and, if you hover your pointer over a line within the scrollbar, you can actually preview the code within a small inset window (see Figure 6.11). You can select between wide, normal, or narrow width for this map mode area in the same Scroll Bars section of the Options dialog.
