
Stepping In, Out, and Over Code
Probably the most common debug operation for developers is stepping through their code line by line and examining the data emitted by the application and the debugger. Code stepping is just that: examining a line, executing the line, and examining the results (and then repeating the process over and over). Because this is such a dominant activity, becoming efficient with the step operations in Visual Studio is important for maximizing the use of your time during a debug session. Here, we cover each of the stepping options and provide examples.
Start Debugging
The most common way to start a debug session is selecting the Start Debugging option (green “play” arrow) from the Debug menu or the similar arrow on the Standard toolbar. Of course, F5 also does the trick. This starts a debug session but does not break into code unless an exception occurs or a breakpoint is encountered. This is a common operation for developers testing their code without wanting to walk through it or those who use a lot of breakpoints.
The Step Into command is another option available from the Debug menu and toolbar. (You can also press F11 as a shortcut.) Two behaviors are commonly associated with this one command. First, when in an active debug session, Step Into steps into the next line of code and executes it (more on this in a moment). The second behavior is related to when you invoke the command for an application that is not currently running in debug mode. In this case, the application is compiled and started, and the first line is presented to you in the debug window for stepping purposes. This is, in essence, stepping into your application. This works great for Windows, WPF, Console, and similar applications. However, it is not practical for most web applications. If you step into a web application at start time, you are likely stepping into someone else’s JavaScript code (and a lot of it).
For web applications, you should start debugging using the Start Debugging option on the Debug toolbar or the Run button on the Standard toolbar. In this case, your web application simply runs in debug mode and only steps into code if you set a breakpoint or an error occurs. You can also choose the line from which you want to start stepping through code using the Run to Cursor option. (See the following section.)
A call to the Step Over command (Debug menu, toolbar, or F10) while your application is at rest results in the same behavior as Step Into. That is, your application is compiled and started in a debug session on the first line of code. (Again, for websites, this is typically a JavaScript file.)
Run to Cursor
One of the more handy (and overlooked) features of the debug toolset is Run to Cursor. This feature works the way it sounds. You set your cursor position on some code in the IDE and invoke the Run to Cursor command (right-click or Ctrl+F10). The application is compiled and run until it hits the line of code where your cursor is placed. At this point, the debugger breaks the application and presents the line of code for you to step through. This capability is especially handy because this is how many developers work. They are looking at a specific line (or lines) of code and want to debug this line. They do not need to start from the first line and might not want to be bothered with breakpoints. The Run to Cursor feature is, therefore, an efficient means to get the debugger on the same page as you.
As an example, suppose we want to get to the first, real meaningful line of our executing code in the Contoso University sample and begin stepping through. We can open the HomeController.cs file. Here we will find a method called Index. We can put our cursor inside this method and press Ctrl+F10 (or right-click and choose Run to Cursor). This starts the application and breaks on this line of code as shown in Figure 10.17. Notice there is no breakpoint set. From here, we can start stepping through code in our website.

FIGURE 10.17 You can tell the debugger to run to a given line of code and stop before executing it using the Run to Cursor command.
In this example, we would get through the home page controller quickly. The IDE would then start stepping through code in the shared layout file, _Layout.cshtml. Eventually, the requested page will render to the browser and no additional executing lines of code will be active in the IDE. Provided you step through each line, however, the IDE still knows you want to step through every line of code. Therefore, a subsequent request from the browser (clicking on the Students link, for example) will also break into the IDE (in this case on the StudentController.cs class).
Run to Cursor works even if the application user (tester or developer) is required to activate some portion of the code prior to the code’s reaching the cursor position. In this way, it acts like an invisible, temporary breakpoint. For instance, consider an example in which users are presented with a default web page. From here, they can select to edit their profiles. If you set the Run to Cursor command on a line inside the code that executes to edit a profile, the debugger still executes the application and waits until the user invokes the given line of code.
Break All
If your application is already running in a debug session and you want to break into the debugger, you can do so at any time by invoking the Break All command from the Debug menu or toolbar (using the Pause button). (You can also use the keyboard shortcut Ctrl+Alt+Break.) Invoking Break All stops your application on the next executing line and enables you to interrogate the debugger for information. The Break All command is especially useful if you need to break into a long-running process or a loop that seems to have stalled your application.
Note
Setting Break All on a web application that is waiting for a user request does not break into any code by default. Instead, you get a message from the IDE indicating that that call stack contains only external code (provided Just My Code is enabled for debugging, which is the default). You would need to click the Continue button (green play arrow) to continue debugging in this scenario.
Step Into
During an active debug session (where the IDE is stopped on a line of code waiting for instructions on how to move forward), you have basically three options for moving through your code. You can step into a line or function, step over a given function, or step out of a function. Let’s look at each option.
The Step Into command (F11) enables you to progress through your code one line at a time. Invoking this command executes the current, highlighted line of code and positions your cursor on the next line to be executed. The important distinction between stepping into and other similar commands is how Step Into handles lines of code that contain method calls. If you are positioned on such a line, calling Step Into takes you to the first line inside that method being called.
For example, look at Figure 10.18. It shows an example of a call to present the edit page for a university course. This line of code is calling an internal method, PopulateDepartmentsDropDownList, to get all the departments from which to select. A call to Step Into will result in your stepping into the first line of this method.
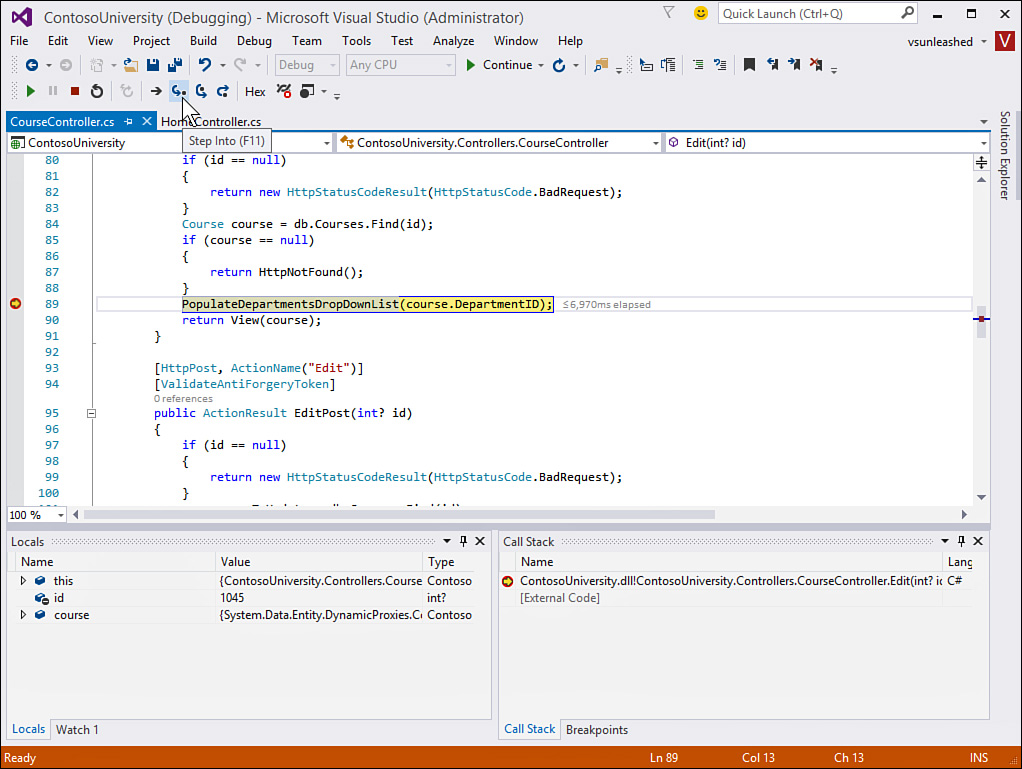
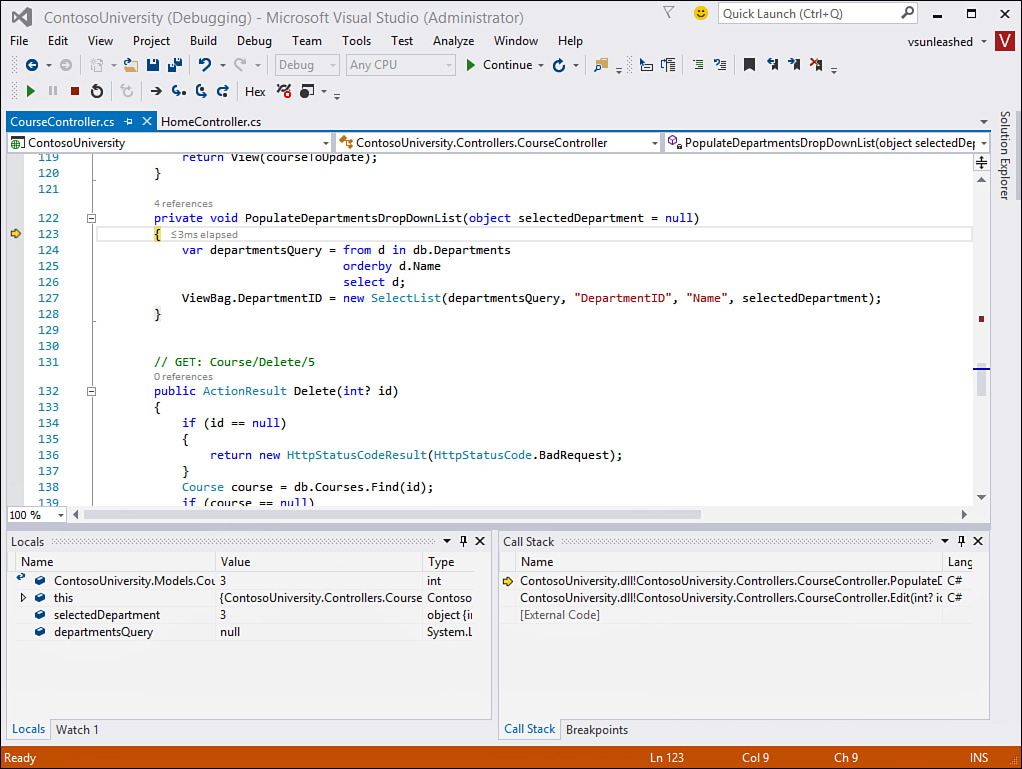
Figure 10.19 shows stepping into this method. Notice that you are now positioned to step line by line through the called method. Of course, when you reach the end of this method, the debugger returns you to the next line in the calling function (back to the next line depicted in Figure 10.18).
Note
Visual Studio helps manage the many code windows you step through while in a debug session. It does not fully open them. Instead, it presents them to you and closes each one as it is no longer needed. This prevents you from having a dozen or more code windows open at the end of your debug session.
If you want to keep a code window open, however, you can do so using the Keep Open icon on the Window tab. You can also use the Text Editor toolbar to set flags on certain code elements to return to them later.
Step Into Specific
The Visual Studio debugger is set by default to step over property calls and basic operators. This eliminates simple calls like a property read that you likely do not want to interrogate line by line. You will get a warning message about this behavior from the IDE the first time you encounter it. You can tell the IDE to stop reminding you about this fact.
There are times, however, when you do want to step into a specific property or operation. To do so, you can right-click the line of code about to be executed and choose Step Into Specific from the context menu, as shown in Figure 10.20. This line of code has two options: call the property getter for the DAL Student object, or step into the Find code in the DataSet class of System.Data.

Note
You can change this default behavior form the Debugging Options, General settings (Debug menu, Options item). Here you will see the option Step Over Properties and Operators (Managed Only). Unchecking this option will tell the debugger to always step into properties and operators of managed code.
Step Over
The Step Over command (F10) enables you to maintain focus on the current procedure without stepping into any methods called by it. That is, calling Step Over executes line by line for the current executing method but does not take you into any function calls, constructors, or property calls outside the executing method.
For example, consider Figure 10.18. Here, the debugger is positioned on the call to PopulateDepartmentsDropDownList. If you call the Step Over command, the function executes in its entirety without your stepping through it. Instead, the next line to execute in step mode is the line following the call to PopulateDepartmentsDropDownList (return View(course);). Of course, any exception thrown by the function you step over (and not handled by your code) results in the debugger breaking into your code (and the function) as normal.
Step Out
The Step Out command (Shift+F11) is another useful tool. It allows you to tell the debugger to finish executing the current method you are debugging but return to break mode as soon as it is finished. This is a great tool when you get stuck in a long method you wish you had stepped over. In addition, you might step into a given function only to debug a portion of it and then want to step back out.
For example, refer again to Figure 10.19. Recall that you stepped into this method from the code in Figure 10.18. Suppose that you start stepping. After you take a look and verify some of the code, you simply want to have the function complete and return to debugging back in the calling function (the next line in Figure 10.18). To do so, you invoke Step Out from the toolbar. This also saves you from stepping should code in this function call other code.
Continuing Execution
When you are in a debug session, the Start Debugging command changes to Continue. The Continue command is available when you are paused on a given line of code in the debugger. It enables you to let the application continue to run on its own without stepping through each line. For example, suppose you walked through the lines of code you wanted to see, and now you want to continue checking your application from a user’s perspective. Using Continue, you tell the application and debugger to keep running until either an exception occurs or a breakpoint is hit.
Ending a Debug Session
You can end your debug session in several ways. One common method is to kill the currently executing application. This might be done by closing the browser window for a web application or clicking the Close button of a Windows application. Calls in your code that terminate your application also end a debug session.
You also have a couple of options available to you from the Debug menu. The Terminate All command kills all processes that the debugger is attached to and ends the debug session. There is also the Detach All option. Figure 10.21 shows both options from the Debug menu. Detach All simply detaches the debugger from all running processes without terminating them. This capability can be useful if you’ve temporarily attached to a running process, debugged it, and want to leave it running.
