
Monitor and Manage a Website
Managing your website includes monitoring activity, changing configuration, scaling it, linking other Azure resources, and more. To access website management, you select your site’s name from the Browse All option shown on the left toolbar of the portal home page, as shown in Figure 12.34.

Once you select a website, Azure presents you with a Startboard that shows details specific to this site. Figure 12.35 shows an example. The website management Startboard shows essential site details at the top and site monitoring (requests and errors) in the middle of the page. You can scroll down to view usage information, events, alerts, and more. You can also access the many settings for the site by clicking the All Settings link. This provides access to users and roles, scaling options, backups, troubleshooting, and more.
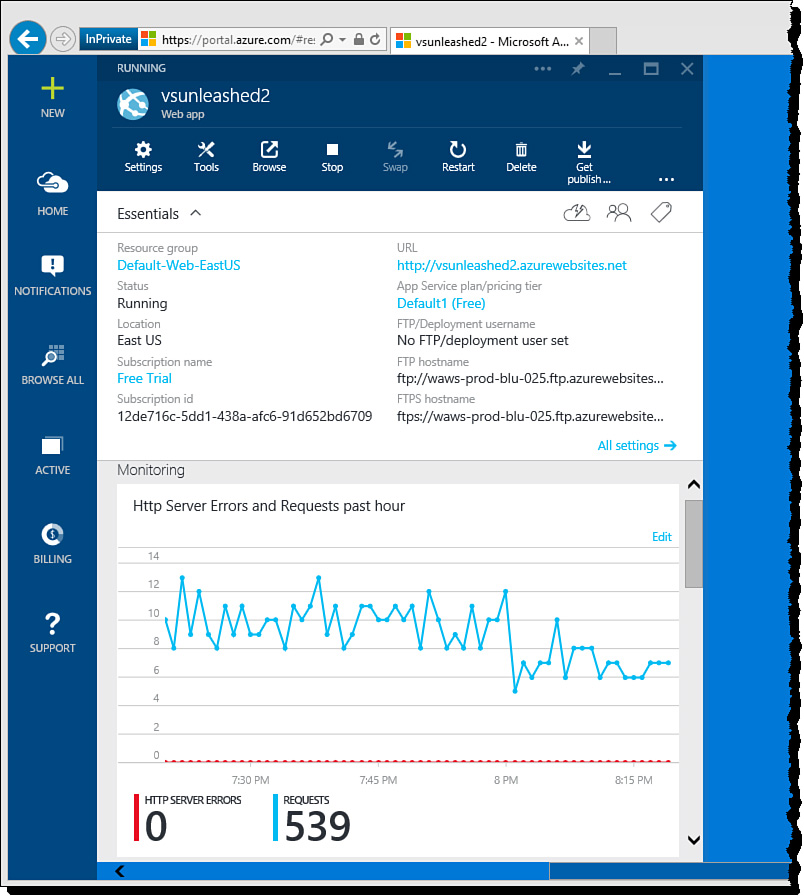
FIGURE 12.35 The management portal provides details on things happening in your site, including information messages, warnings, and errors.
Traffic Monitoring
Azure allows you to view the HTTP traffic hitting your site and capture related metrics about requests, response times, and errors. You get started by clicking the Monitoring blade item from the site Startboard (see Figure 12.35). Doing so opens the Metric blade, as shown in Figure 12.36. Notice that you get a larger view of the data. In this case, the data is showing requests and errors for the past hour. You can scroll this page to also show alerts.

FIGURE 12.36 The Metric blade shows additional detail on web app metrics to help you monitor your application performance and any related issues.
You can edit the metrics shown on this chart and the timeline across which you want to view the information. To do so, you click the Edit chart link in the Metric toolbar (at the top of the page); you can also right-click the chart itself. This brings up your options, as shown in Figure 12.37.

The Edit Chart pane allows you to customize your view of web app metrics. Notice that you can choose the Time Range at the top to show data across the past hour, today, past week, or set a custom range. You can then set information to a bar or line chart. The checkbox items in the list allow you to select what type of metrics you want to see on the chart. For example, if you choose the Http 404 (bad request) option, Azure will include this information in your metric results. Figure 12.38 shows an example of adding 404 errors to the chart and changing the chart type to Bar.

Managing Alerts
An alert allows Azure to notify someone should something not go as planned in your website. You can view the alerts configured for your site by scrolling the Metric window (bottom of Figure 12.36). These are alerts specific to metrics around errors, CPU usage, and response time (such as, average response time greater than 1 second). There are also those associated with events (such as website stopped).
You can use the Metrics pane to click on an alert rule and edit it (turn it off, change parameters, or add additional people that need to be notified). You can also click the Add Alert button at the top of Figure 12.36 to create a new metric alert.
Azure also provides the Alert Rules Startboard item for managing all your alerts. This can be accessed from the startboard for your web app. The interface is similar to the one found when editing just metric alerts. Figure 12.39 shows two alerts in the Alert rules blade.
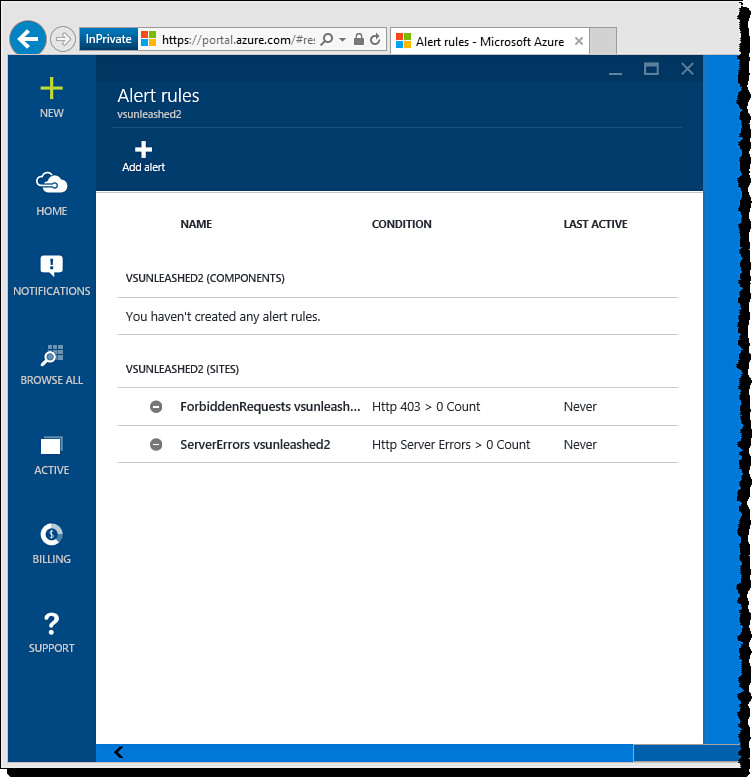
FIGURE 12.39 Use Alert rules to create and edit conditions on which you want Azure to send out notifications.
Clicking an alert from Figure 12.39 will take you to the editing options for the given alert. You can also create a new alert by clicking the Add Alert button at the top of the page. This brings up the blade shown in Figure 12.40. You can see that you first select a resource being monitored; you then set an alert name, description, and alert type (metric or event). In this case, we are creating a metrics alert. You select from an available list of metrics; here we pick the 404 (not found) metric. Notice that Azure shows the recent average for the metric in a graph to help you set your threshold.

FIGURE 12.40 You create a new alert by setting a name, an alert type, and a metric (or event) choice.
Figure 12.41 shows the rest of the new alert setup. Here you set the condition, threshold, and period. In this case, you are requesting that if Azure sees more than five 404 errors in the course of one hour, you want to know about it. You can also choose who to notify (administrators, co-administrators, and additional people). Alert notifications are sent in the form of an email.
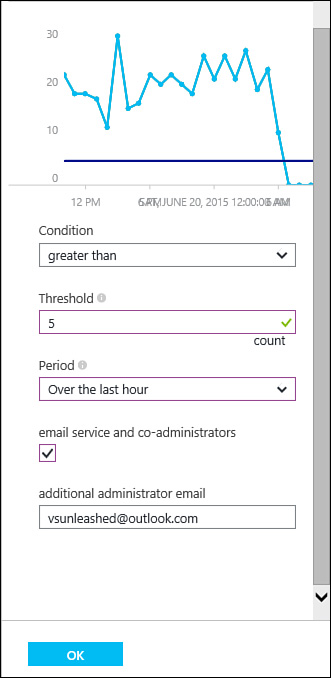
FIGURE 12.41 You finish creating an alert by setting a condition, threshold, and notification options.
Once you save your new alert, it will be created on your behalf. Azure will post a notification to your portal to let you know it was created. You will also now see it in your alert’s list. Clicking the alert allows you to edit it and see a graph about how often you are above the threshold. This allows you to manage the alert closing. Figure 12.42 shows the previously created alert in edit mode.

FIGURE 12.42 Use the Edit Rule blade to view how often you hit your threshold and make the necessary edits to the alert.
Application Insights and Web Tests (Outside-In Monitoring)
Azure allows you to create web tests that verify your site is up and running, all is well, and users around the world can access the site. If not, the web test can send you an alert. These type of tests are referred to as outside-in tests because they test the site from outside the environment.
Web tests are a feature of Azure Application Insights. This tool is a set of services that work to monitor your application, IIS server, VM, and more. It can report performance, usage analytics, availability, server diagnostics, and almost any key metric you wish to track. In addition, you can add Application Insights to your Visual Studio project. This is code that will emit data to be managed by the tool. Here, we will look at setting up Application Insights and using just the web tests feature.
To get started, you add Application Insights as a service inside the Azure Portal. You select the New (+ icon) which displays the Create blade as shown in Figure 12.43. Next, you browse to Developer Services and then select Application Insights. Azure will then present the required fields for configuring Application Insights as shown in Figure 12.44. Here you can select the type of application being monitored (in this case, an ASP.NET web application), resource group, subscription, and location. Finally, you give this service a name and hit the Create button.

FIGURE 12.43 Add Application Insights as an Azure Service to enable deeper diagnostics and web tests.

FIGURE 12.44 You can configure Application Insights to work with an ASP.NET web application or a mobile app.
Azure will then work to deploy and configure your Application Insights service. Once complete, you can select it from the Startboard to get started configuring it for your specific scenario. Figure 12.45 shows some of the many configuration options. You select the Availability option to create a web test. This brings up the Web tests blade as shown in Figure 12.46.

FIGURE 12.45 Use the Application Insights blade to configure the many options for monitoring your application.

You use the Web tests blade to add a new web test to Application Insights. Figure 12.46 shows clicking the Add web test option. Tests are configured to hit certain pages in your site from other Azure locations. Figure 12.47 shows configuration of a standard ping test to verify a site is up and responding okay from Chicago, Illinois; San Jose, California; San Antonio, Texas; Ashburn Virginia; and Miami Florida. This test can be configured as a ping test or a multistep tests that hits multiple pages in your site. You can also have the test check for specific content on the requested page as part of the success criteria. Finally, you can configure alerts to be sent if a test fails or if certain locations fail in a set time period.

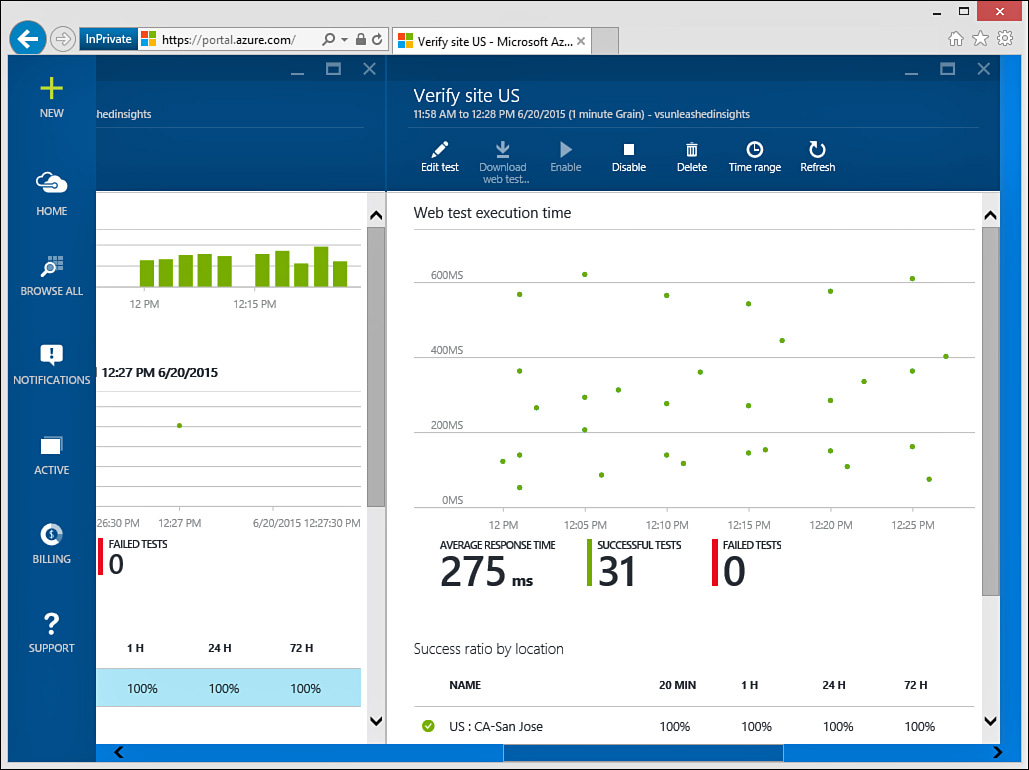
You can return to the web tests page once you have configured your tests and they have been up and running for a while. The page will show you a summary view of all your web tests. You can then select an individual web test to see detailed information about that specific test. Figure 12.48 shows the specific web test created previously (Verify site US) and trends over time. You can use the toolbar at the top of the page to edit the test, disable it, set a specific time range, and refresh your results.
Manage Scalability
You manage the elastic scale of your site by clicking the Scale option on the website Startboard (or from All settings, Scale). The Scale page (see Figure 12.49) shows a graph at the top that indicates how Azure has scaled your instances over time—in this case, based on CPU percentage. Notice that this site has never needed to be scaled.

FIGURE 12.49 The Azure scale page shows how Azure has scaled your site up and down over time based on key metrics you control.
Your scale options (instances) are restricted by your selected hosting plan. (Refer to Figure 12.27 for details.)
Azure has the Autoscale feature that allows you to automatically scale up and down based on key metrics in your site. Figure 12.49 shows Autoscale set to scale up an instance (to 10 as the max) should the CPU usage be greater than 80%. It then scales down if CPU decreases to 60% or less. You can modify these rules by selecting them. You can also add additional rules using the Add Rule link.
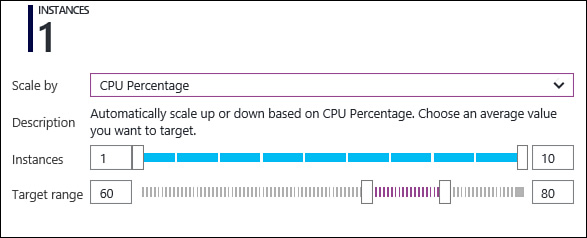
Figure 12.50 shows a simplified version of these rules. You access this by setting the Scale by option to CPU Percentage. Notice that you can set the Instance Range. This is the minimum and maximum number of virtual instances (or nodes) on which your code can execute. Your Azure plan controls the maximum. You then set the scale up and scale down range for CPU usage.
Setting the Scale by to, schedule and performance rules (refer to Figure 12.49), allows you to add specific rules and rule profiles. Clicking the Add Rule link allows you to select a metric on which you want to scale. You have a choice of metrics like CPU usage, memory percentage, and data in/out. Figure 12.51 shows adding a rule to scale by memory usage. Here the environment is set to scale up a node as average memory usage hits 70% usage over the past 15 minutes. You can add another rule then to scale down when the memory usage has a sustained drop below 70%.

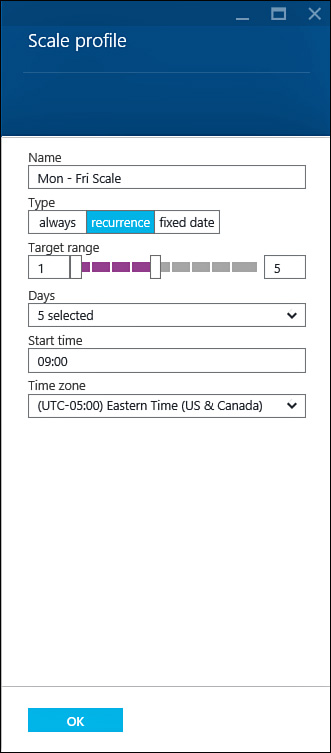
Clicking the Add Profile link (bottom of Figure 12.49) allows you to set a custom scaling profile based on a recurrence or a fixed date. You can then add additional rules to this custom profile. Figure 12.52 shows scaling from 1 node to 5 on Monday at 9:00 am through Friday (and back to 1 on the weekends).
Diagnostic Logs
Azure supports diagnostic logging to help you better understand what is happening in your site and to troubleshoot errors. You enable logging via the Settings option from the Startboard. Figure 12.53 shows the settings pane along with the Diagnostics logs option selected.
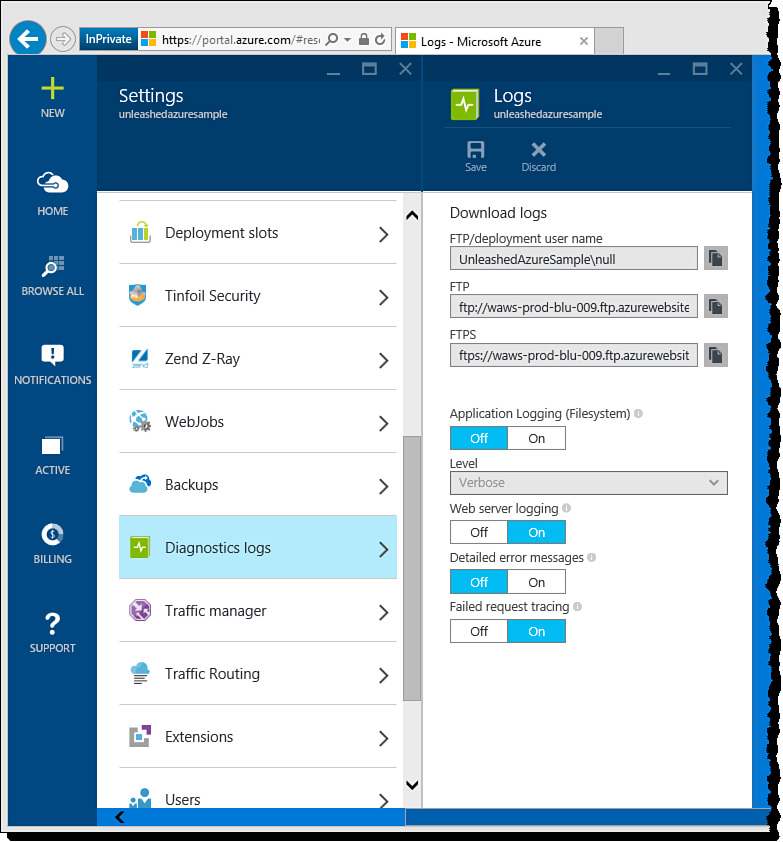
FIGURE 12.53 You enable diagnostic logging from the Settings option in the Azure Startboard for a website.
Notice in Figure 12.53 that you can download and review logs from an FTP site. You can also use the options to turn various logging options on and off. The middle section, Application Logging, is where you set application logging (see Figure 12.54). This allows you to turn on tracing for your application and view the results in the Azure portal. Notice here that you can choose a level (error, warning, or verbose).

Note
Application logging (tracing) will automatically turn off in 12 hours if you don’t turn it off manually.
Before you use application tracing, you must have trace messages inside your code. The following line of code writes a simple informational message when the site’s home page is requested. Of course, you could write a trace message for warnings, errors in your code, and just about anything you want to monitor.
System.Diagnostics.Trace.TraceInformation("Home page requested.");
These tracing messages will output to a trace log provided tracing is turned on (as discussed previously). You access this trace information from the web app Startboard by selecting the Tools option from the toolbar and then clicking Log Stream. Figure 12.55 shows the output of a few trace messages for a sample application.

Visual Studio also gives you access to log files directly in the IDE. To see these logs, you can navigate to the Server Explorer window (View, Server Explorer). You then select the Azure node and navigate to your website. Figure 12.56 shows an example of the same trace log shown in Figure 12.55 open inside the IDE. You can also right-click your website in Server Explorer and choose View Streaming Logs to see the logs as they stream (again, similar to Figure 12.55).
