The Debug Menu and Toolbar
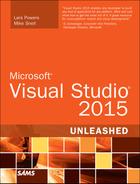
The Debug menu and its related toolbar provide your first-level access to starting debug sessions, stepping into code, managing breakpoints, and accessing the many features of debugging with Visual Studio. There are two states to the debug menu: at rest (or inactive) and in debug mode. Figure 10.13 shows the menu in the at-rest state.
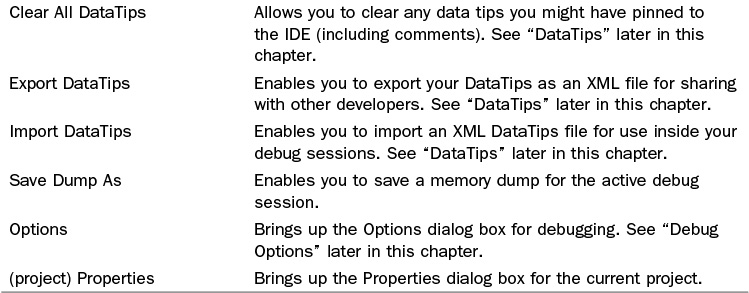
In the at-rest state, the Debug menu provides features to start a debug session, attach code to a running process, or access some of the many debug windows. Table 10.1 lists all the features available from the Debug menu at rest.


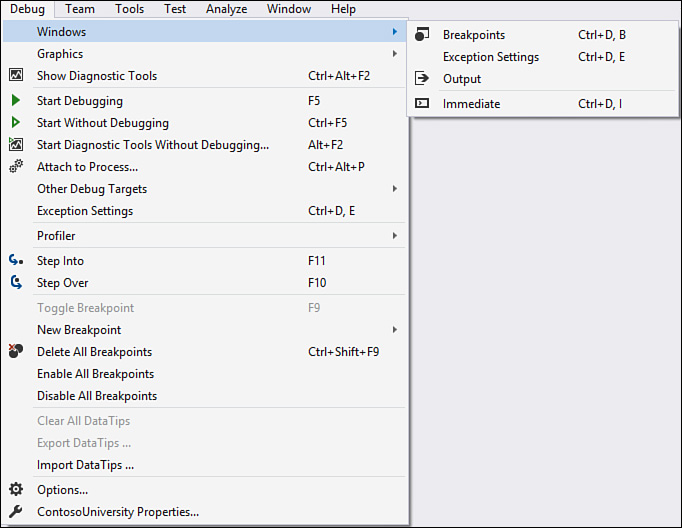
When the debugger is engaged and you are working through a debug session, the state of the Debug menu changes. It now provides several additional options over those provided by the at-rest state. These options include those designed to move through the code, restart the session, and access even more debug-related windows. Figure 10.14 shows the Debug menu during a debug session.
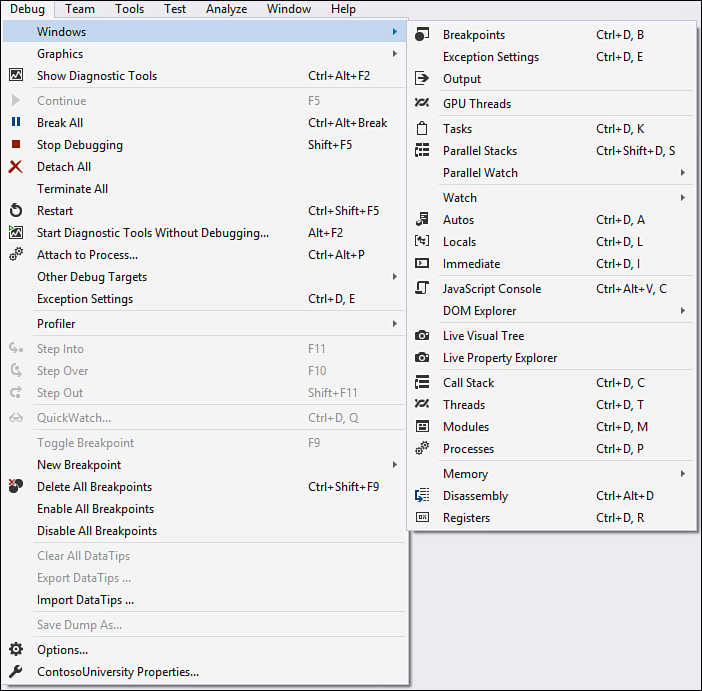
Let’s look at the many options provided by the Debug menu during a debug session. Table 10.2 presents the many items available from the debug menu in this state. When reading through the table, refer to the preceding figures to get context on any given item.


The Debug Toolbar
The Debug toolbar provides quick access to some of the key items available on the Debug menu. From here, you can manage your debug session. For example, you can start or continue a debug session, stop an executing session, step through lines of code, and so on.
Tip
A variety of buttons aren’t visible within the debug toolbar by default. We recommend adding all the available debug commands to this toolbar. There aren’t many, and they turn out to be tremendously useful during debugging sessions. You can do so using the down arrow on the end of the toolbar. This brings up the Add or Remove Buttons option for the given toolbar. Even better, learn the keyboard shortcut to become even more productive during a debugging session.
Figure 10.15 presents the Debug toolbar during an active debug session. Be default, the debug menu is hidden by the IDE unless you are debugging. However, you can choose to show it (right-click the toolbar area and select Debug from the list of available toolbars). In design mode a number of these items are disabled; in fact, hitting the green continue arrow in design mode actually starts a debugging session for your application. We have added callouts for each item on the toolbar. You can cross-reference these callouts to Table 10.2 for further information.

Note
In Figure 10.15, the item with the callout, Debug Windows, on the right of the figure is actually is a drop-down menu. This menu provides access to the many debug windows that are available to developers. See Figure 10.13 for a sample of the menus you can access from this toolbar item.