Debugging Parallel Applications
A parallel application is one that executes code simultaneously. This includes multithreaded applications. Therefore, the multithreaded debugging discussed thus far is applicable to parallel applications. However, there are additional features of the .NET languages, the framework, and the Visual Studio Debugger to help support parallel coding scenarios. These features are an attempt to take advantage of the recent proliferation of many-core processors. Developers want to take advantage of this computer power, which means they need to begin changing the way they write their applications to take advantage of the multiple cores, each capable of running one or more threads in parallel.
This section covers two of the new debugging features that help support parallel programming: Parallel Stack and Parallel Tasks. Some of these features also apply to multithreaded applications. However, the main focus of these features is parallel applications written for multicore. Recall that parallel programming means task-based programming using features of the .NET 4.0 and above. You can refer to Chapter 3, “The .NET Languages,” for a short discussion on parallel programming (System.Threading.Task, Parallel.For, and so on).
The Parallel Stacks Window
As more cores become available and more programming is done to support those cores, more threads will be executing in parallel. Therefore, you need additional support for debugging the processing complexities of your application. The Parallel Stacks window provides some help. It gives you a view of either all threads or all tasks executing at any given moment in time. The view is a diagram that shows the threads or tasks in your application, how they were created, and full call stack information for each thread or stack.
Parallel Stacks Threads View
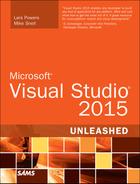
You access the Parallel Stacks window in an active debug session from the Debug menu (Debug, Windows, Parallel Stacks). This window provides a visual diagram of the threads executing in your application. Figure 10.50 shows an example of the Threads view of the sample application in the Parallel Stacks window.

In this example, notice that there are five threads in the application (see bottom box). As you can see, if you hover over one of the thread call stack boxes, you can see the thread IDs and their names (if they have been named). Hovering over the initial grouping (5 Threads) will show all five threads represented by the code in this application.
Tip
You can visualize external code (including that being executed by the framework) in the Parallel Stacks window by right-clicking in the window and selecting Show External Code.
The arrows in the diagram indicate how the threads are spawned within the application and provide information such as the thread ID, name, and call stack. You can use each thread’s call stack information to switch to the code associated with a thread (and thus debug its context) by double-clicking.
The Parallel Stacks window has a toolbar at the top. In this case, the Threads option is selected in the first drop-down (as opposed to tasks). You can toggle between tasks (see the next section) and threads using this toolbar. The other options for this toolbar are shown in Figure 10.51.

Switching to Method view using the toolbar (refer to Figure 10.51) changes the diagram to highlight (or pivot on) a specific method in your code. In this view, you can see all threads that enter the given method along with their call stacks up to that method. You can then see the exit points from the method and the call stacks following the method’s exit. Figure 10.52 shows the same sample code (Figure 10.50) in Method view. Notice there is only a single thread entering this method at present.

FIGURE 10.52 Use the Method view to show all threads that enter and exit a method along with the related call stack information.
Parallel Stacks Task View
You can toggle the Parallel Stacks window to show tasks instead of threads. You can use the drop-down in the toolbar to switch from threads to tasks. You can then use the same diagram tool and related features to visualize tasks as you would threads. Both tasks and threads are joined in this same tool window because they are such similar concepts. Of course, this feature requires that your application is coded to use tasks.
Recall that tasks are bits of work that can be executed in parallel by two or more processor cores. You code tasks using the task scheduling service in the .NET Framework’s parallel task library (System.Threading.Task namespace). The task scheduler provides a number of services such as managing thread pools on each core and providing synchronization services for your code. This is an additional layer of abstraction over simply managing your own threads or using the ThreadPool class. Instead, the framework handles cores and threads. Therefore, trying to debug task-based applications at the thread level is a challenge given the fact that the framework (and not your code) is typically managing the threads.
Visual Studio provides two principal windows for looking at the task-level abstraction of multicore development: Parallel Stacks (in Tasks view) and the Parallel Tasks window. We discuss the latter in a moment. First, let’s look at what can be done to view tasks using the Parallel Stacks window.
Tip
If you are debugging unfamiliar-but-parallel code and are unsure if it uses tasks or threads, you can enable external code in the Parallel Tasks window (right-click and select Show External Code). In Threads view, you can see whether there are calls to the Task class. This indicates the code was written using multitask (and not simply multithreads).
You switch to Tasks view by selecting Tasks in the drop-down of the Parallel Stacks toolbar. This shows the call stacks for each task being executed. It also shows you the status of the task (waiting, running, scheduled). Figure 10.53 shows you an example of a parallel application running. Note the sample application uses a naming scheme to show how various tasks can execute simultaneously on different processors. Here, we are simply showing you how you can use the tools in your application.

FIGURE 10.53 You can switch the Parallel Stacks window to Tasks view to view the tasks running in your debug session.
Note
Like the multithreading sample we suggested you download from MSDN, here we are using a parallel application sample. You can create it, too, by following the MSDN topic “Walkthrough: Debugging a Parallel Application.” You can also download this sample from the book’s website.
This abstracted view helps you see the tasks in your application without worrying so much about on which processor and thread they are executing. Of course, you can switch to Threads view to see this information, too. Figure 10.54 shows the same sample code as Figure 10.53 at the same breakpoint in the same window but for Threads view. Notice that in this simple example, the parallel framework has created threads that are similar to the tasks (two main threads executing the work). If you start to add a lot more work to this application, however, you see inactive threads that are sitting in the pool waiting to do work. You also start to see a single thread executing larger call stacks (due to reuse) that do not align with your Tasks view.

FIGURE 10.54 The Threads view of the same spot in a debug session depicted by the Tasks view shown in Figure 10.53.
The Parallel Tasks Window
Another way to look at the tasks running in your application is through the Parallel Tasks window (Debug, Windows, Tasks). This window is actually similar to the Threads window, but it shows the abstraction layer of tasks for those developers doing task-based development.
Figure 10.55 shows an example of this window running in the same spot as before for the parallel sample application. Notice that for each task (in this case there are four) you can view the task ID, status, location, task (or entry point for the task), thread assignment, and application domain. Note that this example groups the tasks by their status (active, blocked, and so on). This is done by right-clicking the status column and selecting Group by Status from the context menu.

You can also use the Parallel Tasks window to flag tasks for viewing. You do so using the arrows on the left side of each task in the dialog box. In addition, you can right-click a task to freeze or thaw its associated thread. Alternatively, you can use the right-click option Freeze All Threads But This One to focus on a specific thread and task.
The Location column shows the current location of the task. If you hover over this location, you see the call stack for the task. This is all code called thus far in the given task. This mouseover is actually actionable. It is called a stack tip. The stack tip enables you to switch between stack frames and view the code inside a given call in the stack.