
TWO-PHASE P/E ORBITS
The examples of constant growth rates in Exhibit 3.6 illustrate the natural path of P/Es when the market provides the equilibrium 9% return and earnings growth and dividend yield are constant. To achieve “sensible” orbits, growth rates must undergo at least one future shift that changes the orbit's basic direction. The simplest such shift in growth rates is a transition to a stabilizing rate that produces a horizontal orbit from the transition point forward. Such an orbit represents a going-forward version of the classic two-phase DDM, in which one growth rate holds prior to a defined horizon and then a second growth rate prevails in perpetuity.4
In the most common situation, the first phase has a higher growth rate than the final phase. In such cases, the starting fair-value P/E is always higher than the final P/E. The P/E descends along its orbit until the horizon point, where it should match the stable P/E of the final phase.
As an illustration, we revisit the earlier example (Exhibit 3.6) of a firm with a dividend yield of 1.6%, initial P/E of 25× and 12.4% earnings growth, leading to a P/E decline to 15× after 10 years. Instead of maintaining a single growth rate, we now assume that earnings growth slows in year 10 and the company enters a final phase of perpetual 7.4% growth. The upper curve in Exhibit 3.8 illustrates this P/E orbit, including the stabilizing growth rate that leaves the P/E unchanged at 15× for the remainder of time. The two growth rates in this example totally determine that 25× is a fair value for the starting P/E and that 15× is the fair value for the terminal P/E.
This example clarifies why the P/E descent, which at first seems counterintuitive, makes sense in the context of fair valuation. The high growth rate in the first phase leads to the high starting P/E of 25×. From this height, FV is consumed quickly and the P/E must move downward to its final-phase P/E of 15× where FV is lower but sustainable.
EXHIBIT 3.8 10-Year Two-Phase Growth with Various Starting P/Es and Required Initial Growth Rates
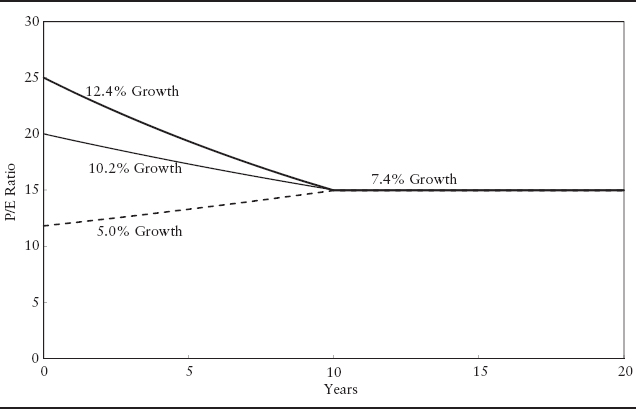
Similarly, in the relatively unusual case in which a stock has a lower growth rate in its first phase, the fair value for the starting P/E would be expected to be lower, reflecting slower FV consumption, and then rise until it ultimately reaches its final-phase level. This is illustrated in the lowest, dotted curve in Exhibit 3.8 where after 10 years, the growth rate accelerates from 5% to the 7.4% stabilizing rate.
For each starting P/E, there is one specific growth rate that will move the P/E from its initial level to a final P/E of 15× after 10 years. For example, a starting P/E of 20× would require a 10.2% initial growth rate to bring the P/E down to 15×, as illustrated in the middle curve of Exhibit 3.8.
Tracing out these P/E orbits brings to the surface several of the problems inherent in standard valuation models. In many short- and intermediate-term models, earnings are assumed to grow at a specified rate until some given horizon date—anywhere from 1 year to 10 years hence. Then, the attained earnings level on the horizon date forms the basis for estimating terminal price. Unfortunately, an all-too-common tendency is to determine this terminal price by simply applying the current P/E to the horizon earnings level. In other words, the P/E is simply assumed to remain stable. But, as the preceding examples show, this myopic assumption of P/E stability is highly questionable—especially when a high rate of earnings growth prevails in the early years. To the extent that high growth rates and the dividend yield exceed the expected return, the baseline equilibrium estimate of forward P/Es should follow the orbital descent to lower values.
We now turn to our basic FFM to gain some further insights into the orbits we have just uncovered.
The Franchise Factor Model and P/E Orbits
The single- and multiphase P/E orbits in Exhibits 3.6 and 3.8 are related to how the balance between TV and FV evolves over time. FV always incorporates a consolidated market view of the totality of a firm's potential investments. Whenever some of that investment potential is realized through the execution of an anticipated investment, FV shrinks and TV grows. For example, FV depletion occurs when a pharmaceutical company brings an anticipated new drug to market or a when a restaurant chain opens a new restaurant. As such new products or businesses become valuable components of the firm's ongoing businesses, their related earnings streams become part of the TV. Thus, FV depletion equals TV expansion. But this equality does not hold for P/ETV and P/EFV.
Since TV = E/k, TV grows at exactly the same rate as E, provided all other parameters remain unchanged.
![]()
Earnings growth may come from a variety of sources, many of which are unrelated to franchise consumption. For example, prospective investments with return, R, equal to the market rate, k, do not provide a net positive return to investors and make no contribution to FV, but they do add to TV. Since TV = E/k grows with earnings, any investment with a positive return will add to TV as soon the investment begins to generate earnings. However, there is no addition to P/ETV since the ratio TV/E = 1/k remains unchanged.
Earlier in this chapter, we exhibited the following price return relationship:
The second component of price return, gP/E, mathematically can be shown to be
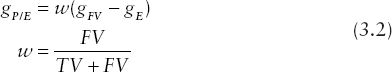
For growth firms, FV dominates TV and the price impact of any depletion in FV will be amplified in three ways. First, an FV decline means gFV is negative. Second, a drawdown in FV means new investments have been made and add to earnings. Thus, gE will increase, and the corresponding term in equation (3.2) will become more negative. Since both terms within the parentheses in equation (3.2) become more negative, the rate of decrease in gP/E increases.
Finally, the dominance of FV (over TV) for growth firms implies that the weight, w, will be relatively large. The combination of all three factors leads to substantial theoretical P/E declines for growth firms, especially during periods of high earnings growth, as illustrated in Exhibit 3.6.
Unless growth comes from previously unexpected sources, the 5% growth curve in Exhibit 3.6 illustrates a special situation in which firms with high FV actually can experience positive P/E growth. When FV is utilized at a slow pace, earnings grow slowly and FV can grow with time. This potential FV growth is related to the present value calculations embedded in FV. FV includes the present value of future investments as well as the present value of the returns they provide. In calculating FV, we discount future flows to the present. If the first investment does not occur for several years, then after the first year we will be discounting that flow as well as other future flows for one period less. As a result, it will appear as if FV has grown at the market rate. Ultimately, however, as the FV is “consumed” growth will accelerate and the P/E will level off and eventually begin to decline.
In contrast to growth firms, for value firms where TV dominates FV, w will be relatively small and the P/E impact of FV decay will be rather muted.
FV Growth, FV Decay and FV Bubbles
Equation (3.2) implicitly shows that, under our equilibrium assumptions, the P/E will be stable (i.e., gP/E = 0) if FV growth, gFV, equals earnings growth, gE. This basic relationship underscores the challenge and tyranny of success. Whenever a CEO succeeds in meeting investor expectations by appropriately and effectively bringing anticipated premium investments to fruition, he is utilizing a portion of the firm's franchise value. As FV declines, so will its contribution to the firm's P/E. That is, FV and P/E decay are natural consequences of the effective utilization of a firm's franchise.
We view FV as consumed whenever anticipated capital investments are made in new businesses. If the P/E is to be maintained, the consumed FV must be replenished. “Replenishment” is challenging because it means adding more FV than was just consumed. This high replenishment follows because the G factor in FV is measured relative to economic book value. Business growth increases book value, so replenishment will be measured relative to a larger base.
In essence, each time a new business is added, the CEO must develop and convey a surprising new vision of business opportunities that are larger than the ones just built out. If this vision is not a surprise, the opportunities already would have been incorporated in previous business visions and in the existing FV.
To some extent, the market does reward high-octane CEOs with implicit votes of confidence in their ability to identify new opportunities. This confidence may even be expressed through a lowering of the discount rate as the perceived risk declines. But the challenge remains because each success will inevitably be met with ever greater expectations!
CEOs of hyper-franchise firms may for some time be able to uncover new opportunities at an increasing rate. In a global market place, the reach and brand of big firms may offer distinct advantages and facilitate the opening of unexpected new markets. Over time, the CEO may see possibilities that earlier were inconceivable. For example, the firm's market dominance may turn out to be an even greater advantage than anticipated, resulting in more pricing power and a higher franchise spread. When new, previously unimagined possibilities are announced, there is likely to be P/E growth or even a significant “jump” whenever a positive surprise is incorporated in the market's estimate of FV.
But the tyranny of size looms large. As a successful business transform a small firm into a big firm, only mega-investments can move the P/E dial. To some extent, a firm's size, expertise, and market dominance may be a major advantage that does, for a time, enable the firm's leadership to find precisely such investments. However, despite such advantages, big investments become harder and harder to find and to execute—even for the most talented executive.
The natural path of P/E decline may accelerate if a firm mistakenly engages in anti-franchise growth. For example, the FV might initially incorporate the expectation that large cash holdings would soon be used for investments or acquisitions yielding a positive franchise spread. If instead, it turns out that cash holdings turn out to become long-term investments with a bond-like return, then they will be P/E-depleting. From a shareholder perspective, it would be better to distribute cash through increased dividends or share repurchases. Shareholders then would have the opportunity to achieve the equity market rate (not the bond rate) through other investments.
A second example of anti-franchise growth stems from mega-mergers based on perceived but yet-to-be-attempted synergies. Unrealizable synergies may result in a negative franchise spread, thereby causing FV decay. Worse still, a change in market perceptions of a firm's franchise can lead to a sudden dramatic FV decay (and P/E collapse). Therefore, the pricing of mergers is critical. As the price increases, the probability of achieving a positive franchise spread declines.
Because FV estimation is an art rather than a science, FV estimates can easily reflect exaggerated euphoria or dismay as market conditions and perceptions wax and wane. When firms appear to be able to regularly rediscover and reinvent themselves, the opportunities seem boundless and momentum-driven FV estimates may be revised upward over and over again. In some cases, such optimism may be justified for years or even decades, as illustrated in Exhibit 3.3 and 3.4, possibly creating FV bubbles.
With the passage of time, in one way or another, a given level of uncertainty may slowly be transformed into greater certainty. Some former optimistic estimates may be realized, but others may turn out to have been wildly excessive. If doubts and negative sentiment grow, the FV bubble may burst via a precipitous drop in FV and P/E. Following such a decline, a company will be challenged to reinvent itself and show that it has a renewed franchise that will lead to an increasing estimate of FV. Some firms can do this; some cannot. As a result, many outstanding firms will see their P/Es gradually decline as they convert from growth to value firms.