
DOES THE ALPHA REPAIR PROCESS WORK?
The process of alpha repair is tested by using this approach to create portfolios of stocks. First, the factors selected each month are used to create stock scores, which are taken as expected returns (aside from a linear transformation) for the stock portfolio construction process.
The scoring process for January 2007 is illustrated in Exhibit 15.7 using IBM. The three factors picked for January 2007 are market cap (Small – Big) at 35.6% weight, EBITDA/EV at 35.2% weight, and gross margin at 29.2% weight. Given the level of EBITDA/EV for every stock in the Russell 1000 on December 31, 2006, the Z-score is calculated (using the value of EBITDA/EV minus the average for the universe, divided by the standard deviation of the EBITDA/EV levels for the universe). That Z-score is multiplied by the weight for that factor, 0.35. Similar calculations for IBM are done for market cap and gross margin. The net score for IBM based on end-of-December data is −1.32, which is a below average score. The score for every stock in the Russell 1000 is calculated in this fashion, and that score is used as the measure of expected return for January.
EXHIBIT 15.7 Example of How Stocks Get Scored: IBM on December 31, 2006
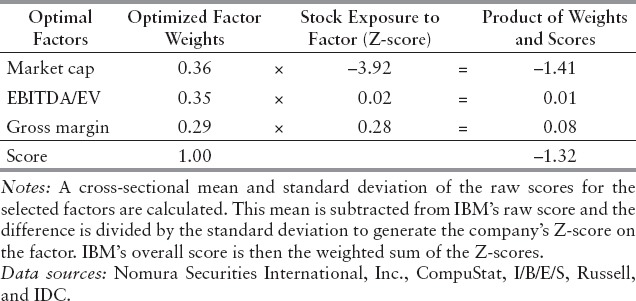
EXHIBIT 15.8 Alpha Repair Portfolio Excess Returns over Russell 1000 (as of August 31, 2010)
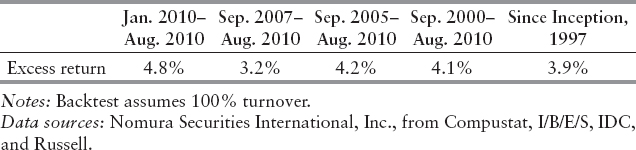
Using the monthly scores, portfolios are constructed to maximize alpha subject to a target 600 basis point tracking error relative to universe. The example we use here selects stock portfolios from the Russell 1000 universe, targeted to 100% per year turnover. Our portfolio construction apparatus lets us start the out-of-sample tests at the beginning of 1997.
The annualized excess return over Russell 1000 of the portfolios generated for almost 14 years was about 4% per year, with similar recent 10-year, 5-year, 3-year, and 1-year performances. Exhibit 15.8 summarizes the results of Alpha Repair portfolios' excess returns over Russell 1000.
Exhibit 15.9 shows the portfolio's cumulative outperformance. This highlights the consistency of the added value. The vertical line indicates the time when Alpha Repair model was first published in January 2007.3 Even though we separate the backtest and public portfolio periods, we have throughout implemented an out-of-sample strategy. Each month-end we select three factors using optimization to give us the best Sharpe ratio. A composite score is given to each stock in the universe (Russell 1000 in this case) and used to construct a long-only portfolio. The portfolio has an ex ante 6% tracking error. The targeted annual turnover is 100% per year. We then monitor the performance of the portfolio for the next month. The performance thus is always out of sample. As indicated by the regression line, throughout the whole time, the Alpha Repair strategy has outperformed the benchmark Russell 1000 in a consistently linear fashion.
EXHIBIT 15.9 Outperformance of Alpha Repair Portfolio (as of August 31, 2010)
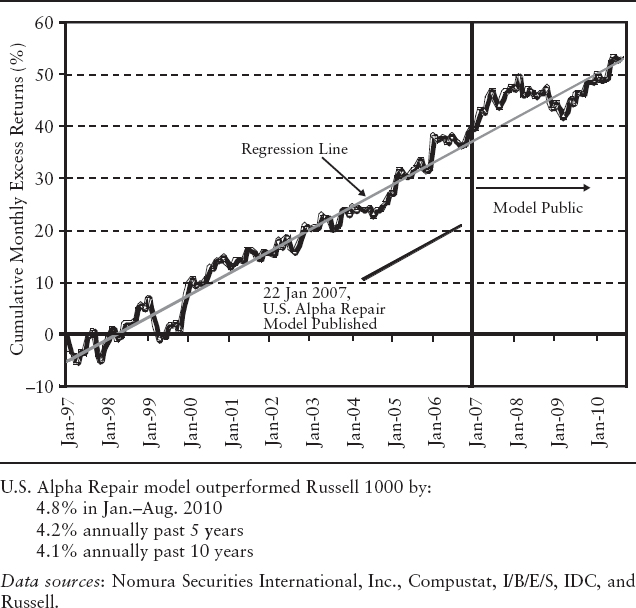
EXHIBIT 15.10 Dynamic Nature of Factor Weighting Strategy
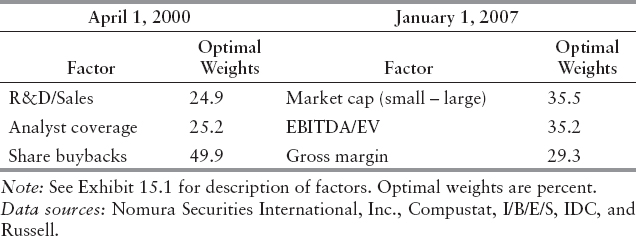
Exhibit 15.10 exemplifies the dynamic nature of the factor weighting strategy. Note how the factors selected at April 2000 for the stocks, when the tech bubble was at its peak, differ from those selected at January 2007. The factors selected back in 2000 had roughly 25% in the “research spending divided by sales” (R&D/sales) and analyst coverage. These two factors performed extremely well in the tech bubble—but they were in a danger of falling over the cliff at the time. Yet the largest weight of share buybacks was almost 50%. In the next two years, until August 2002, share buybacks as a factor had returns of more than 140%. This set of strategies was well diversified to offset the effect of the tech bubble crash.
Still referring to Exhibit 15.10, the factors for January 2007 are entirely different from those selected for April 2000. The January 2007 set has roughly equal weights on a value factor EBITDA/EV (earnings before interest, taxes and depreciation divided enterprise value), a profitability factor “Gross margin” and a size factor “Market cap (Small – Large).” It is important to note that in the period 2001–2005, “Market cap (Small – Large),” EBITDA/EV, and gross margin ranked seventh, first, and thirty-second, respectively. Clearly, our strategy for factor selection is not based simply on what has worked lately. Even though this set of factors is totally different from April 2000, they are also well diversified.