
PERFORMANCE
We compare the performance of standard and shortfall constrained optimization in an empirical study, using three different alpha signals: relative strength, predicted earnings-to-price ratio (E/P), and cash plowback. For each signal, we create an optimal portfolio that has a forecast active risk of 4%. We use the MSCI US Prime Market 750 Index as both the universe and benchmark, and the Barra Short-Term US Equity Model (USE3S) as the risk model. We rebalance the portfolios monthly over the test period from January 1994 to May 2009. When constraining shortfall beta, we set the upper bound to 0.9 to produce portfolios with less sensitivity to extreme market losses. We also relax the long-only constraint, allowing up to 5% shorting of individual stocks.
In portfolio optimization, imposing constraints tends to alter the ex-ante active risk that the optimal portfolio achieves for a fixed level of risk aversion. To ensure that any differences between shortfall and standard optimization are not simply due to differing levels of aggressiveness, we require each portfolio to have the same forecast active risk of 4%.
Exhibit 19.1 shows the cumulative difference in returns obtained using shortfall constrained optimization and standard optimization. We see that constraining shortfall beta improves performance for most signals during two main turbulent periods—the middle of 2000 through the middle of 2002 and late 2007 through 2008. On the other hand, standard optimization performs better in the few years before the bursting of the Internet bubble.
Exhibit 19.2 analyzes the results by time period. Again, the shortfall constraint tends to improve the performance of the strategies in periods where the market is down (January 2000–December 2002 and January 2007–May 2009). In the other periods, there are small or mixed differences in performance between the two optimization approaches.
EXHIBIT 19.1 Cumulative Gains from Constraining Shortfall Beta Constraint
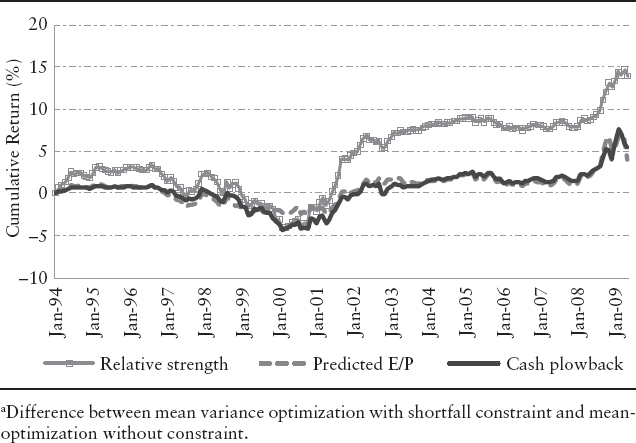
EXHIBIT 19.2 Constraining on Shortfall Betas (base case): Information Ratios

The contrast in performance may be due, in part, to the differences in the betas of mean variance and shortfall constrained portfolios. Shortfall constrained portfolios tend to have lower betas. For the momentum strategy, the betas for shortfall constrained portfolios were 0.07 lower than their mean-variance counterparts, on average. These differences are not surprising since the average correlation between the betas and the shortfall betas of the MSCI US Prime Market 750 Index stocks is 0.92 over our analysis period. Constraining shortfall beta indirectly constrains beta.