
DETERMINANTS OF TRACKING ERROR
Several factors affect the level of tracking error. The major factors include:
- Number of stocks in the portfolio
- Portfolio market capitalization and style difference relative to the benchmark
- Sector deviation from the benchmark
- Market volatility
- Portfolio beta
The impact of each of these factors is investigated in Vardharaj, Fabozzi, and Jones.1
Number of Stocks in the Portfolio
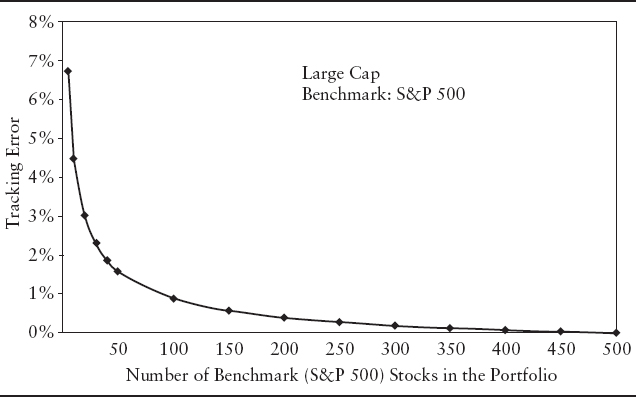
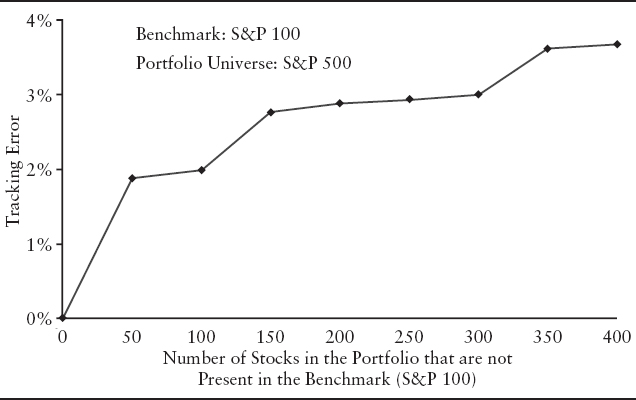
Tracking error decreases as the portfolio progressively includes more of the stocks that are in the benchmark index. This general effect is illustrated in Exhibit 10.2 that shows the effect of portfolio size for a large-cap portfolio benchmarked to the S&P 500. Notice that an optimally chosen portfolio of just 50 stocks can track the S&P 500 within 1.6%. For midcap and small-cap stocks, Vardharaj, Fabozzi, and Jones found that the tracking errors are 3.5% and 4.3%, respectively.2 In contrast, tracking error increases as the portfolio progressively includes more stocks that are not in the benchmark. This effect is illustrated in Exhibit 10.3. In this case, the benchmark index is the S&P 100 and the portfolio progressively includes more and more stocks from the S&P 500 that are not in the S&P 100. The result is that the tracking error with respect to the S&P 100 rises.
EXHIBIT 10.2 Typical Tracking Error vs. the Number of Benchmark Stocks in the Portfolio for the S&P 500
Portfolio Market Cap and Style Difference Relative to the Benchmark
Vardharaj, Fabozzi, and Jones found tracking error increases as the average market cap of the portfolio deviates from that of the benchmark index.3 Tracking error also increases as the overall style (growth/value) of the portfolio deviates from that of the benchmark index. First, holding style constant, they find that tracking error rises when the cap size difference increases. For example, a midcap blend portfolio has a tracking error of 7.07% while a small-cap blend portfolio has a tracking error of 8.55% with respect to the S&P 500, which is a large-cap blend portfolio. Second, for a given cap size, tracking error is greater when the style is either growth or value than when it is the blend.
EXHIBIT 10.3 Tracking Error vs. the Number of Nonbenchmark Stocks in the Portfolio
Vardharaj, Fabozzi, and Jones examine portfolios that deviate from the S&P 500 either in cap size or in style and have the same tracking error. They find that the farther a portfolio is from the center of the Morningstar equity fund box for large-cap blend stocks (proxied by S&P 500), the greater is its tracking error.
Sector Deviation from the Benchmark
When a portfolio's allocations to various economic sectors differ from those of its benchmark, it results in tracking error. In general, when the differences in sector allocation increase, the tracking error increases. Vardharaj, Fabozzi, and Jones found that in general, the tracking error increased as the level of sector bets increased.
Market Volatility
Managed portfolios generally hold only a fraction of the assets in their benchmark. Given this, a highly volatile benchmark index (as measured in terms of standard deviation) would be harder to track closely than a generally less volatile benchmark index. As market volatility rises, the portfolio tracking error increases. This correspondingly increases the probability of “dramatic underperformance,” by which we mean an underperformance of 10% or more. This can be seen in Exhibit 10.4. On the horizontal axis of the exhibit is the tracking error and on the vertical axis is the probability of a shortfall of 10% or more from the benchmark index. (In this calculation, we assumed normal distribution of active returns and an alpha of zero.)
As the tracking error rises, the probability of dramatic outperformance increases just as much as the probability of dramatic underperformance. But, the portfolio management consequences of these two types of extreme relative performances are not symmetric—dramatic underperformance can cause a manager to be terminated. Another implication is that since an increase in market volatility increases tracking error and, thereby, the chances of dramatic underperformance, there is an increased need for managers to monitor the portfolio tracking error more frequently and closely during periods of high market volatility.
Portfolio Beta
The beta for the market portfolio is 1 and beta for the risk-free portfolio (cash) is zero. Suppose an investor holds a combination of cash and the market portfolio. Then, the portfolio beta falls below 1. The managed portfolio is less sensitive to systematic risk than the market, and is therefore less risky than the market. Conversely, when the investor holds a leveraged market portfolio, by borrowing at the risk-free rate and investing in the market portfolio, the beta is above 1, and the portfolio is more risky than the market.
EXHIBIT 10.4 Tracking Error and Dramatic Shortfall
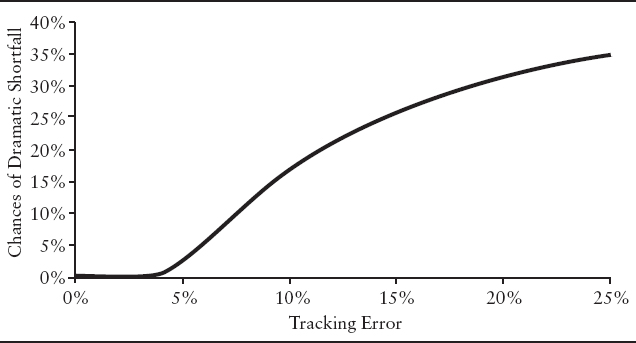
EXHIBIT 10.5 Tracking Error and Beta
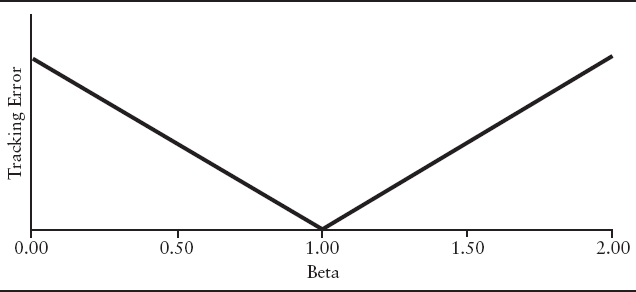
It can be demonstrated that the portfolio tracking error with respect to the market portfolio, increases both when the beta falls below 1 and when the beta rises above 1. So, as the portfolio increases the proportion of cash held, even though its absolute risk falls, its tracking error risk rises. As shown in Exhibit 10.5, tracking error rises linearly as the beta deviates from 1.
In the above example, we make the simplistic assumption that the manager only chooses between holding the market portfolio and cash when making changes to its beta. In the more general case where the fund can hold any number of stocks in any proportion, its beta can differ from 1 due to other reasons. But, even in this general case, the tracking error increases when the portfolio beta deviates from the market beta.