HISTORICAL DATA OBSERVATIONS
Over the almost 25-year period from January 1, 1985, to June 30, 2010, an investment of $100 in the S&P 500 multiplied more than 11 times to $1,143, if no money was withdrawn and all dividends were reinvested. This growth represents a remarkable 10.0% annualized compound return over a period of dramatic market changes, upheavals and challenges.
The mid-1980s marked the beginning of an extraordinary bull market that accelerated through the Internet boom of the late 1990s. Prior to this time, value investing was viewed as the favored long-term strategy. But, during this period, value investing fell out of favor and growth dominated.
Between 2000 and 2002, the Internet bubble collapsed and the September 11, 2001, attacks on the World Trade Center brought further market declines. The weak markets of the early 2000s were followed by a new bull market in which value investing moved back into favor. But, all gains were erased with the so-called Great Recession that began in 2007.
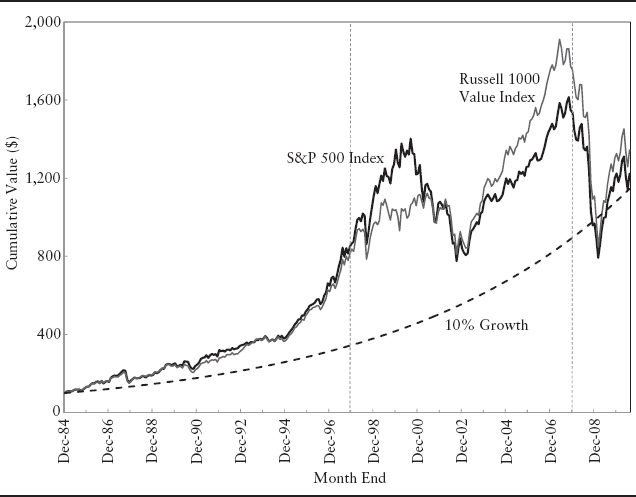
Exhibit 3.1 plots the growth paths of hypothetical $100 investments in the S&P 500 Index and in the Russell 1000 Value Index. In a more subtle way, these paths underscore the challenges inherent in market forecasting. On January 1, 1985, no market observer could possibly have foreseen the unfolding of events that would rock the market. For reference, the exhibit also includes a smooth 10% growth path with the same beginning point and approximately the same end point as the market investments. The market does not follow this path! Rather the market lunges forward, corrects, lunges forward and then corrects, over and over again.
Note the interlacing of the growth paths of broad U.S. market index and the value index. Each crossing represents a point at which the cumulative investment value to date produces precisely the same result. For example, during the late 1990s an initial investment in the S&P500 raced ahead of a similar investment in the Russell 1000 Value Index. But, by the end of 2001 a crossing point occurred as a consequence of the sudden rapid fall in the broad market and the steady rise in value stocks. Starting in late 2002, value stocks grew faster than the broad market and collapsed more quickly during the Great Recession. Once again, there was a crossing of the cumulative value graphs. Relevant investment results were dependent on an investor's ability to time the market, correctly switching between the broad market and value. But few if any investors have the forecasting skill required to consistently and accurately time markets. For truly long-term investors, the results of maintaining an investment in one index or the other were quite similar.
EXHIBIT 3.1 Growth of $100 Investment in S&P500 Index and Russell 1000 Value Index (including dividend reinvestment)
Rather than attempting to forecast the events that mark the beginning of major market corrections, we take a 60,000-foot view of both individual firms and broad regional markets. From this vantage point, we conceptualize market behavior as a reflection of a changing composite of views of inherent growth prospects. During periods of optimism and high expectations, it is hard to escape the feeling that companies have virtually unlimited opportunities to make new, profitable investments. Companies viewed as “undervalued” are expected to soon realize their “true” potential. Growth companies are projected to capitalize on seemingly boundless “franchise potential.”
Growth potential is expressed in rising P/Es and a corresponding price escalation that may persist for years. Inevitably, boundless optimism is replaced by a dark pessimism and implicit revaluation of “franchise potential” is sudden, dramatic and relentless. Our Franchise Factor Model (FFM) does not make market forecasts. Rather, the FFM quantifies the return and investment assumptions that are implicit in a given P/E. In so doing, the FFM provides concrete and intuitive measures that the investment analyst can test against realizable return and investment prospects.
One of the great overestimates of market growth potential occurred in Japan in the late 1980s. Exhibit 3.2 shows how an investment of $100 in the Nikkei index more than tripled in value in the five years, beginning January 1, 1985. One analyst after another “capitulated” and began to join the bull market bandwagon. Going into 1989, Japan was widely viewed as an example of a new paradigm in which traditional valuation measures did not apply. We note that much of the same reasoning later applied during the Internet boom.
EXHIBIT 3.2 Cumulative Value of an Investment of $100 in the Nikkei Index
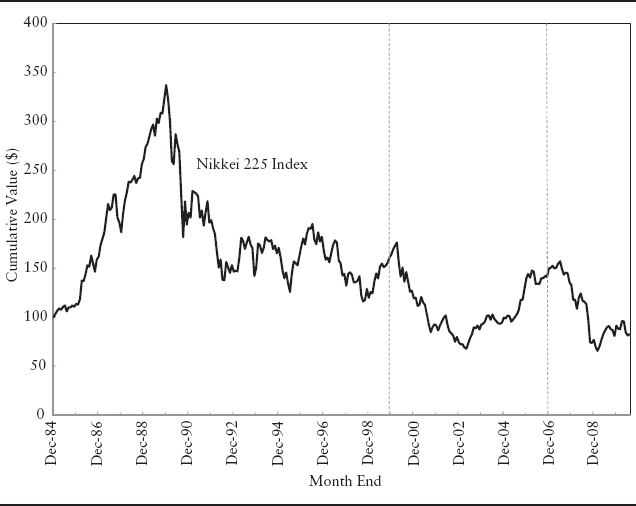
At the end of 1989, the Japanese market collapsed. In 1991, market observers began to take the view that the market could not get any worse and was about to turn. Instead, the market went nowhere. In 1998, the market began to rally along with the internet boom in the United States. But the market collapsed again in 1999. Finally, in 2003 signs seemed to appear that recovery was underway. Hopes were dashed again with the onset of the Great Recession. In mid-2010, the Nikkei 225 remained at only 24% of the peak realized more than 20 years earlier!
The Nikkei performance illustrates an inherent danger and warning signals in extreme peaking behavior. In a sense, the Japanese market was, for some time, viewed as having a hyper-franchise reflecting superior management, better work ethic, and manufacturing prowess. Even if these observations were to some extent correct, their macro valuation was unrealistic.
In the language of our model, over the course of time, hyper-franchise firms are likely to transition to no-growth, low-growth, or anti-franchise firms. Sometimes such firms eventually go out of business, although markets do not. In fairness, we do not mean to suggest that market observers and participants literally speak of franchise value. Rather, we argue that when application of our model to the market yields an implicit FV that is inconsistent with any reasonable assumptions, there should be an explicit questioning of the sustainability of valuations.
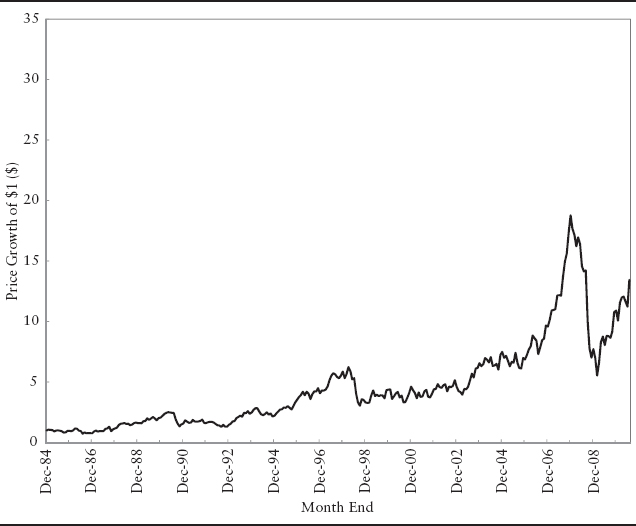
The phenomenon just observed for markets is equally apparent for some of America's greatest growth companies, as illustrated in the Exhibits 3.3 and 3.4. For an extended time, both of these Fortune 500 companies were viewed as holding a hyper-franchise, enabling the firm to make ever larger and more profitable investments. Firm A is a highly regarded well-diversified Fortune 50 company. Firm B is one of the great innovative mega-cap tech companies. The prices of both firms escalated for almost 15 years, with unprecedented acceleration occurring in the late 1990s. Early buyers who sold at the peak made fortunes. Long-term shareholders made modest or negative returns, depending on their entry point.
When market optimism came to an end in 2000, so did optimism regarding the FV of individual firms. The market could no longer foresee the investment opportunities required to justify sky-high valuations. During the run-up, the price of Firm A grew about 25 times. That remarkable growth pales in comparison to Firm B which grew about 120 times! As might have been expected, the correction in Firm B's price was far greater than for Firm A's price. But, both quickly returned to 1998 levels and then fell further.
Firm A bottomed in early 2003 when its price was only 40% of the peak. Then, prices began to escalate modestly, reflecting the view that the firm still had growth potential. Between 2003 and 2006, the firm provided a modest price return to investors. To raise the P/E the firm would have to reveal new unanticipated growth prospects that were large in comparison to the already enormous (Fortune 50!) firm size. Absent the discovery of such new opportunities (or improvement in the probability that previously envisioned projects would succeed), the firm's perceived FV would likely decrease and P/E declines would occur in lockstep with that decrease in FV. In the Great Recession, any such positive views of the firm collapsed and the price dropped even more sharply than during the burst of the Internet bubble. By mid-2010, the price was at 1996 levels!
EXHIBIT 3.3 Firm A, Diversified Fortune 50 Company
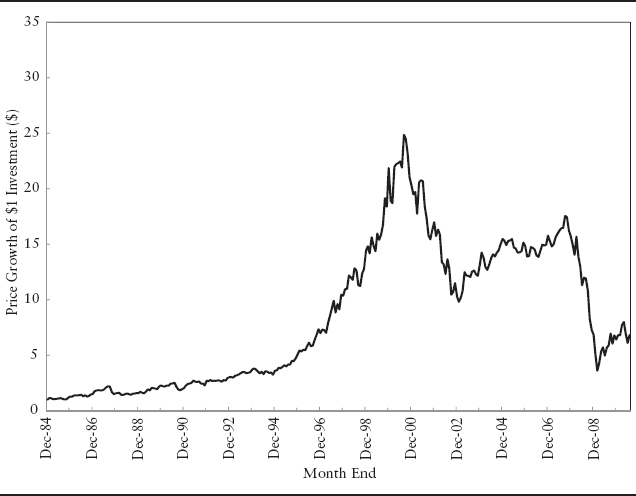
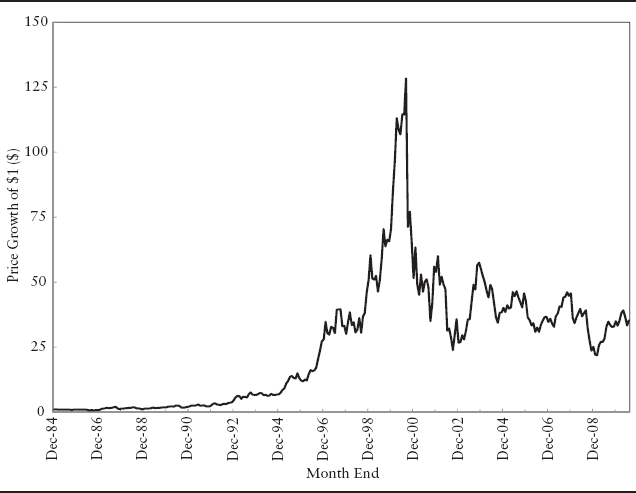
From peak to trough, Firm B saw its price decline by 90%. Then, from 2002 to mid-2010, the price oscillated within a trading range and there remained no sign of a change in growth prospects. That is, FV was not about to change.
Firm size helps to some extent, but it also exacerbates the challenge an FV-driven firm faces in maintaining a high P/E (P/EFV). On the one hand, big firms may dominate markets, have access to cheaper sources of production, achieve favorable pricing and realize lower capital costs. On the other hand, the dollar size of the investments that must be made to impact the P/E is enormous. A $1 billion investment is very meaningful to a $500 million company, but a mere “drop in the bucket” for a $30 billion company.
EXHIBIT 3.4 Firm B, Mega-Cap Tech Company
Successful companies like Firms A and B ultimately reach a point where few potential investments are large enough to significantly impact overall firm valuation. Is it possible that the same is also true for some broad markets?
The usual stable P/E assumption may not be realistic. In theory, there should be a smooth path of escalating and ultimately declining P/Es, reflecting the full cycle of future investment opportunities. In practice, P/E changes are often sudden and dramatic. In contrast to Firms A and B, the relatively unexciting midcap industrial Firm C in Exhibit 3.5 appears to be successfully navigating the FV challenge. This firm had a good but slower and less spectacular run-up from 1985 to 1998. Then there was a steep decline through 1997, with the trough being only 50% of the peak. But this drop was not as deep as it was for the other firms and we see a period of stability following the decline. In the terms of FFM, new unanticipated growth prospects began to emerge adding to FV and driving C's value to unprecedented levels. The 2007 price run up was too fast and the gains quickly evaporated in 2008. Through 2009–2010, the price continued to rise and the patient long-term investor saw price grow 10 times, along a path that was relatively stable.