
OVERVIEW OF TRADITIONAL METRICS
With numerous financial measures available, the investor is often left wondering which metrics are the most important to focus on. We address this metrics question by examining the information content of two well-known but seemingly distinct types of company and equity analyses—namely, traditional and value-based metrics (VBM) approaches to securities analysis. We begin our financial metrics journey with the traditional approach.
In the traditional approach to company analysis, there are several broad ratio categories. These categories include liquidity, activity, debt (leverage), and profitability measures. Within each category, there are several ratio choices. From the investor's perspective, growth rates and profitability measures are often combined with relative valuation measures (“multiples”) to assess the attractiveness or unattractiveness of a firm's common stock. As with the value-based metrics approach (discussed later), the end result of a traditional fundamental analysis on a company is a target valuation leading to a potential buy (or “overweight” relative to reference index), sell (“underweight” relative to index), or hold decision (benchmark weight) on a company's stock. Some widely used traditional measures of growth and profitability include:
- Revenue growth
- Earnings and cash flow growth
- Book value and asset growth
- Dividend growth
- Return on equity (reflects profitability)
- Fundamental stock return
Likewise, some key valuation measures include:
- Price-to-revenue ratio
- Price-to-earnings ratio
- Price-to-cash flow ratio
- Price-to-book value ratio
- Dividend yield
While the names of these metrics are descriptive, we provide an overview of those measures that require formulas. Moreover, it is worth noting that some investors and analysts prefer a specific combination of traditional fundamentals and valuation measures when analyzing companies; for example, “tech” analysts may use a combination of revenue growth and price–revenue “multiple” to analyzing software and biotech companies, while other analysts may use an earnings (or book value) growth and price–earnings (or price–book) combination when evaluating the profitability and equity valuation characteristics of financial services companies.
Growth Rates
We begin the formulaic review of traditional metrics with annualized growth rates. Growth rates—variables expressed in terms of revenue, earnings, cash flow, book value, assets, or dividends—are calculated from the basic present value (PV) and future value (FV) relationship:
![]()
Solving for the annualized growth rate, one obtains:
![]()
This expression is used to calculate growth rates using the variables listed earlier. When growth rates are compared to a benchmark or industry standard, they can be used to distinguish companies having relatively favorable or unfavorable financial characteristics. Growth rates are also used in equity style analysis (value versus growth stocks) and they are a key input to pro forma forecasts of earnings and cash flows and, notably, in discounted cash flow (DCF) models (along with the required return).
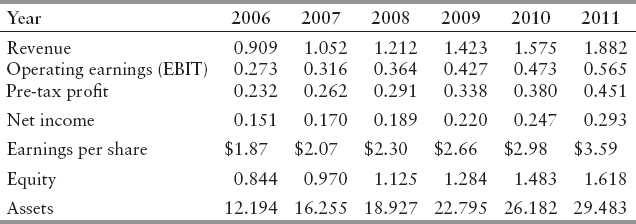
Consider the revenue and earnings data shown in Exhibit 2.1 (among other financial data used later). Upon inserting the revenue figure at 2011 into FV, and the revenue figure at 2006 into PV, one obtains a five-year annualized growth rate, gr, according to

The five-year earnings per share (EPS) growth rate, ge, can be determined in a similar manner. At 13.9%, this annualized growth rate is calculated according to
![]()
Other things the same, if the actual growth rate in either revenue, earnings, cash flows, book value, assets, or dividends is higher than benchmark, then based on growth rates alone the company is relatively attractive—meaning the stock is a potential buy opportunity. Otherwise, the company is relatively unattractive, which points to a potential sell or short-sell opportunity on the stock.
EXHIBIT 2.1 Income and Balance Sheet Data (all figures USD billions except earnings per share)
Return on Equity and Extended Dupont Formula
We now look at return on equity (ROE), which is perhaps the best-known traditional measure of corporate success. In accounting terms, ROE is simply net income over stockholders' equity. The classic Dupont formula (a pioneering formula developed by E. I. duPont de Nemours & Company in the early 1960s) expands this ratio by showing that ROE can be expressed as the product of other important ratios. For example, ROE can be measured by multiplying return on assets (ROA) by a corporate leverage ratio. The leverage ratio is commonly referred to as the “financial leverage multiplier,” the “equity multiplier,” or just plain “leverage.” The leverage factor is measured by the ratio of total assets to stockholders' equity, while ROA in the Dupont formula is simply net income (NI) divided by total assets (A).
![]()
In turn, ROE is related to the net profit margin (NPM) and the asset turnover ratio according to
![]()
In this expression, ROA is expressed as the net profit margin (net income over revenue) times the asset turnover ratio—measured by the revenue-to-assets ratio. Investors can use this three-part ROE formula to measure the efficiency of management in generating (1) profit per dollar of sales, (2) sales per dollar of assets (via inventory and asset turns), and (3) assets per dollar of owners' or stockholders' equity (implicitly by using debt financing).
Moreover, to better assess the operating and efficiency aspects of a company as well as capital structure and tax issues, the above after-tax version of the Dupont formula can be extended to a five-part, pretax model. In the extended Dupont formula, the firm's ROE can be expressed as

In the extended Dupont formula, the tax burden is measured by the ratio of (or conversion from) net income to pretax profit (PBT), the interest burden is measured by the ratio of profit before tax to operating earnings (EBIT), the pretax operating margin is measured by the ratio of operating earnings to sales, while the asset turnover and leverage ratios are the same as before. The obvious benefit of using the extended Dupont formula is that investors and analysts can focus more clearly on the operating profit and efficiency aspects of a business in the context of the operating profit margin and asset turnover ratio (or pretax ROA) as distinct from financing (capital structure) issues as reflected in the interest burden and leverage ratios, and tax issues as captured by the tax burden. Note that the tax burden in the extended ROE model is simply one minus the effective tax rate.
We use the income statement and balance sheet figures in Exhibit 2.1 to calculate the after-tax (three part) and pretax (five part) versions of the Dupont model for 2011. Based on these figures, the three-part ROE model yields

In turn, with a 35% tax rate [1 – (0.293/0.451)] and a 30% operating profit margin (0.565/1.882), the extended (five-part) ROE model yields:

With a relatively high operating profit margin (30%), a low asset turnover ratio (0.0638), and a high equity multiplier (18.22), these are indicative of the ROE characteristics of a firm operating in the financial services sector, such as a profitable bank with a large amount of assets (i.e., creditworthy loans). A company operating in, say, the soft drink industry might have a similar ROE, but the “packaging” of the ROA and leverage components would be reversed. That is, beverage companies have relatively high pretax ROA and asset turnover ratios and are largely financed with equity, such that the values for the interest burden and the equity multiplier would be close to unity.
ROE and Leverage
Investors and analysts alike often look at corporate leverage ratios—such as debt-to-equity, debt-to-capital, and debt-to-asset ratios—when evaluating a firm's profit versus risk characteristics. In the traditional model, leverage can be value increasing because higher levels of corporate debt lead to both higher ROE and earnings per share. However, professional investors are keenly aware that excessive amounts of debt beyond some target level may be wealth destroying for the shareholders (investors). This negative side of debt is generally due to excessive earnings volatility associated with a rising probability of corporate default, leading to bankruptcy.
The traditional view that a larger proportion of debt in the firm's capital structure leads to higher profitability ratios can be seen in the Dupont formula. To emphasize the role of debt, a firm's ROE can be expressed in terms of its ROA and the inverse of one minus the corporate debt ratio according to
![]()
In this expression, ROA is the after-tax return on assets (net income/assets), and D/A is the debt–asset ratio. The debt ratio in this version of the Dupont formula is the ratio of total liabilities (including current liabilities) to total assets, D/A.
Moreover, the “operating assets” approach1 to ROE is yet another way to distinguish operating results from leverage, this time in the context of ROA′ and the debt-to-equity ratio (D/E) according to
![]()
In this ROE expression, ROA′ is the ratio of net operating profit after tax (NOPAT) to net assets or capital. In practice, NOPAT can be estimated as net income plus the after interest expense, while in a VBM context (shown later) NOPAT is often measured as tax-adjusted operating earnings (EBIT). Based on the previous formulations, it should be clear that with a higher degree of leverage, the Dupont formula shows that ROE goes up because the denominator in the former ROE expression falls as D/A rises; while in the latter or operating assets approach, ROE raises due to an increase in D/E. Conversely, as D/A declines relative to the firm's ROA, its ROE goes down because the denominator in the Dupont formula now goes up (equivalently, ROE goes down as D/E declines). In effect, when D/A (or D/E) rises relative to ROA, a smaller amount of equity capital is now generating the same amount of profit; thus, the return on shareholder equity goes up. A declining ROE results when a relatively larger equity base is generating the same amount of corporate earnings.
To illustrate the link between ROE and leverage (debt), assume that a firm's after-tax profit is $10 and its asset base is $100. Further, assume that the company is financed with all equity such that the D/A is zero. Not surprisingly, with 100% equity financing the firm's ROE is the same as its ROA, at 10%:
![]()
Now assume that the firm engages in financing that effectively swaps the equity shares for more debt, such that D/A rises to 40%. With this pure capital structure change, the firm's ROE rises from 10% to 16.7%:
![]()
As the company moves toward what it perceives to be its “optimal” (or target) capital structure, we see that ROE goes up. Hence, in the traditional view, it is argued that investors should be willing to pay more for the firm's now seemingly dearer shares as long as the firm does not violate its supposed optimal capital structure. We will say more on the firm's target capital structure as this is a key issue in the value-based metrics approach to equity analysis.
Financial Risk Considerations
The Dupont formula can also be used to illustrate the volatility of ROE at varying corporate debt levels. In this context, Exhibit 2.2 shows the projected ROE ratios with corporate debt levels ranging from 0% to 70% in the presence of ROA ratios varying from, say, 10% to –10%. As the economy expands or contracts with a 10% debt load, we see that ROE fluctuates from 11.1% on the high side to –11.1% on the downside.
EXHIBIT 2.2 ROE Impact of Corporate Debt Policy in a Changing Economy

Exhibit 2.2 also shows that with an economy-wide debt load of 40%, the ROE numbers vary from 16.7% down to –16.7%. Moreover, as the economy expands or contracts with a 60% debt ratio, the ROE is even more volatile, ranging from 25% to –25%. On balance, the table reveals that increasing leverage (or debt) in good times conveys a seemingly positive benefit to the shareholders, while rising corporate debt ratios in bad times are a source of investor concern due to heightened financial risk. If the traditional view of capital structure is correct, then investors may reap windfall capital gains or avoid losses by (1) buying the securities of companies having reasonable amounts of debt in anticipation of an expansionary economy, or (2) trading out of those companies with securities (e.g., the stocks of consumer durables and industrial cyclicals) that might be penalized by excessive amounts of debt in a slow-growth to recessionary economy.