
THE PROBLEM
We created a set of factors within the Russell 1000 to understand the relationships that drive stock prices. For the most part, our factors are derived from the familiar concepts employed by fundamental analysts when they evaluate stocks. For all Russell 1000 stocks, each score on a particular factor is calculated from several sources (CompuStat, I/B/E/S, and IDC pricing databases) and then ranked cross-sectionally at a point in time. Factor returns are generated by calculating the subsequent performance of a portfolio that is long the highest scores (i.e., the top decile containing approximately 100 stocks) and short the decile with the lowest scores (rebalanced monthly).
The complete set of 45 factors is defined in Exhibit 15.1. The historical returns to these factors are shown in Exhibit 15.2 and they are sorted by their 2006 to August 2010 returns and ranks. A subset of the 45 factors is shown in Exhibit 15.3 to illustrate how some popular strategies have failed while others have emerged as winners. Consider the cumulative factor returns for the five strategies displayed in the Exhibit 15.3:
- Dividend yield (dividend per share divided by price).
- Estimate dispersion (standard deviation of I/B/E/S fiscal year (FY) 1 EPS estimates divided by ABS (mean of I/B/E/S FY1 estimates)).
- Earnings quality (accruals).
- Up to down revisions (number of FY1 up revisions minus number of FY1 down revisions divided by total number of estimates).
- One-year price momentum (12-month total return less the last one-month return).
EXHIBIT 15.1 Factor Definitions
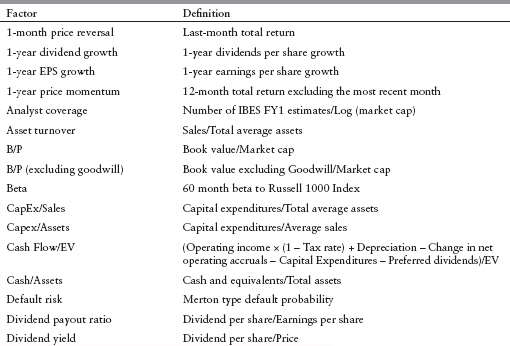
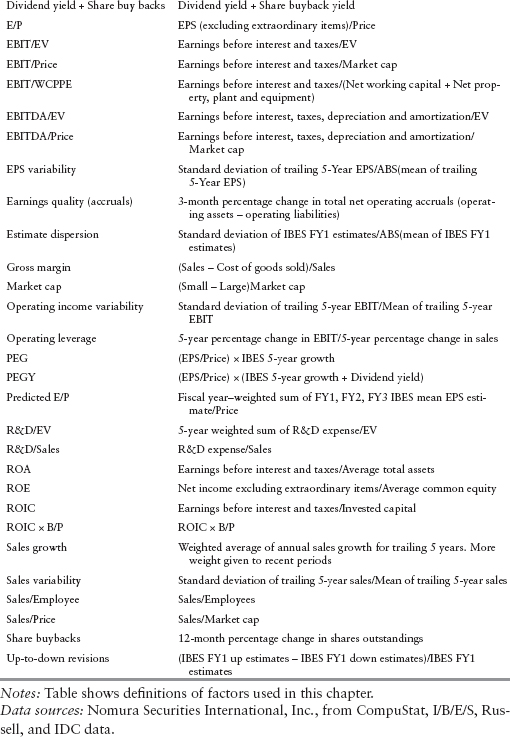
EXHIBIT 15.2 History of Factor Returns (as of August 31, 2010)
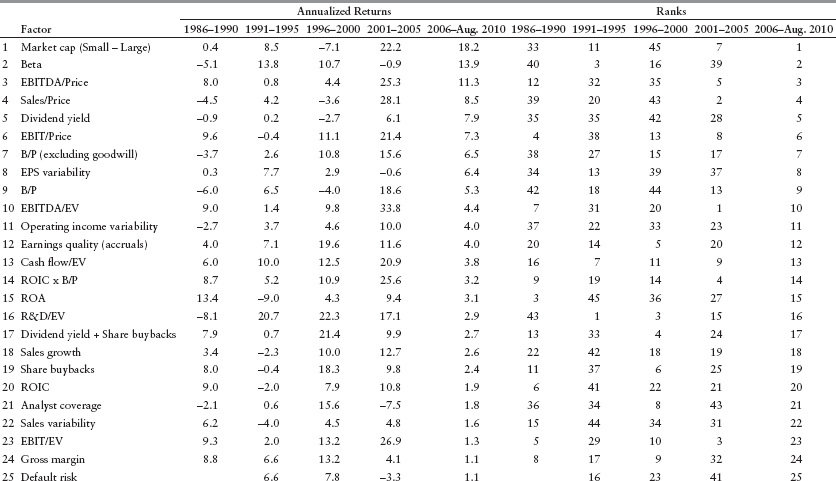
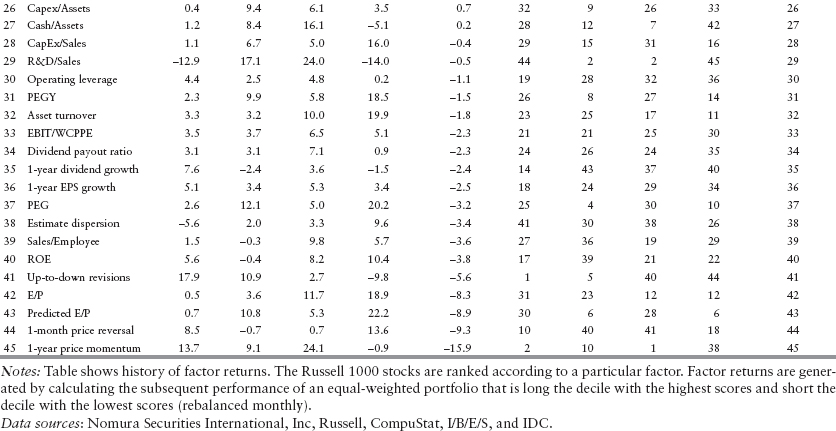
EXHIBIT 15.3 Rarity of Durability (as of August 31, 2010)
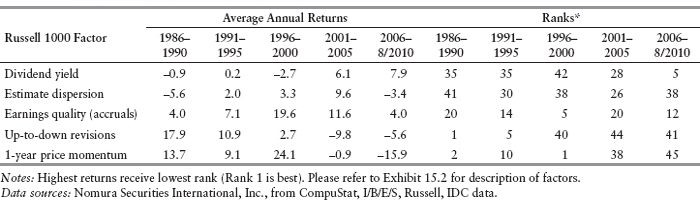
The ranks in Exhibit 15.3 are for the particular time period shown and are relative to the 45-factor set. In each period, the top strategy is ranked number 1 and the bottom strategy is ranked number 45.
Note how former winners became losers and how former losers became winners. Dividend yield, for example, recently touted as the thing to bet on was the top five strategy since 2006. But the exhibit shows that dividend yield's record prior to 2006 was very poor. Will dividend yield's recent success last?
Let's consider some previously celebrated strategies that have become disappointments. One-year price momentum was dead last since 2006, even though it was in the top 10 for 15 years in the period 1986–2000. Earnings quality (accruals) was a mediocre factor since 2001, while it was in the top five in the period 1996–2000. The best way to pick stocks in the period 1986–1990 was up to down revisions. This was also the fifth-best strategy in the period 1991–1995, but it was in the bottom 10 since 1996. As Exhibit 15.2 shows, of the top 10 strategies for the period 2006–August 2010, only five were in the top 10 in the period 2001–2005, only one in the top 10 in the period 1991–2000, and only two were in the top 10 in the period 1986–1990.
The changing nature of factor efficacy is illustrated graphically in Exhibit 15.4, which shows the cumulative returns to dividend yield, a recent winner, and the long-ago winner, estimate revisions. The reader is invited to peruse Exhibit 15.2 for more examples demonstrating the rarity of durable strategies.