29. Adding Tables to a Presentation
In This Chapter
• Understanding PowerPoint Tables
• Inserting Excel Spreadsheets
• Deleting Tables and Table Contents
Tables offer a great option for presenting and structuring related data on a PowerPoint slide in ways that are easy to read and aesthetically pleasing.
Understanding PowerPoint Tables
A table is an object that conveys related information in columns and rows. If you’ve created tables in other applications, such as Word, you know how valuable they are for communicating information. Tables are also efficient and flexible. For example, rather than creating three separate bullet list slides, each listing the five most important features of your three main products, you can summarize all this information in a table on a single slide. Alternatively, you can present information on individual slides and then summarize everything in a table at the end of the presentation.
You can include a table in a PowerPoint presentation in several ways:
• Insert a table from the content palette—PowerPoint’s basic table-insertion feature places a table into a slide, based on the number of rows and columns you specify. You can then format, customize, and add data to the table.
• Draw a table—When you need to create a complex table, one that the basic table feature can’t make, you can draw it right on your slide. It takes longer to draw your own table, though.
• Insert an Excel table—Insert a table that takes advantage of the table formatting and calculation options available only in Excel.
Inserting a Table
One of the easiest ways to insert a table in a PowerPoint presentation is to start with a slide layout that includes the content palette.
To add a new slide that contains a table, follow these steps:
1. On the Home tab, click the down arrow below the New Slide button. A gallery of slide layouts displays.
2. Select one of the layouts that includes a content palette, such as the Title and Content, Two Content, Comparison, or Content with Caption layout from the gallery. A new slide displays.
3. On the content palette, click the Insert Table button to open the Insert Table dialog box, illustrated in Figure 29.1.

 Tip
Tip
You can also open the Insert Table dialog box by clicking the Table button on the Insert tab. This option works best if you want to insert a table on a blank slide.
4. Choose the number of columns and rows to display and click the OK button. A blank table displays in your slide, as shown in Figure 29.2.

5. Click the title placeholder to remove the placeholder text and then enter a title for the slide.
6. Add the text you want in each cell of the table, clicking inside the table and then either tabbing to the cell or clicking in the cell.
You can format this text as you would any other text. For example, you might want to make the first row or column bold, or add other special formatting.
Drawing Custom Tables
If the default table options don’t give you what you need, create a custom table. Drawing your own table lets you make columns and rows of varying widths, for example. For some people, drawing a table is faster than customizing a table created from a table placeholder.
To draw a table, follow these steps:
1. On the Insert tab, click the Table button and select Draw Table from the menu that displays. The mouse pointer becomes a pencil.
2. Drag the mouse diagonally across the slide to create a box about the size you think the table should be.
3. On the Table Tools – Design tab, click the Draw Table button in the Draw Borders group. The mouse pointer becomes a pencil again.
4. Select the type of lines you want to draw from the Pen Style, Pen Weight, and Pen Color drop-down buttons.
5. Use the pen to draw lines inside the box to make columns and rows.
If you make a mistake or want to imitate the Merge Cell feature, select the line you want to delete and then click the Eraser button on the Table Tools – Design tab. Use this eraser to remove the lines between rows and cells as necessary.
Tip
To make it easier to create rows and columns, on the View tab, click Gridlines.
Inserting Excel Spreadsheets
If you want to take advantage of Excel’s formatting and calculation features in your table, you can insert an Excel table in your PowerPoint presentation. You can insert an Excel table on any PowerPoint slide, but this works best on blank slides or slides with the Title Only layout.
To insert a table you can format as an Excel spreadsheet, follow these steps:
1. On the Insert tab, click the Table button and choose Excel Spreadsheet. An Excel table displays on your slide.
2. Using the table handles, resize your table to fit your slide.
3. Enter your table data as you would in an Excel spreadsheet. The Ribbon now presents many Excel options, including the Formulas and Data tabs. Figure 29.3 shows a sample Excel table.

FIGURE 29.3 An Excel table enables you to use Excel’s formatting and calculation features in PowerPoint.
4. Click anywhere outside the Excel table to return to the normal PowerPoint interface.
Formatting Tables
When you click in a table cell, a contextual tab displays called the Table Tools tab. This tab includes two contextual tabs: Design and Layout. These tabs are contextual in that they display only in context with a table. If you’re not working on a table, they don’t display on the Ribbon.
Tip
The Table Tools tab doesn’t display when you click a table formatted as an Excel spreadsheet. Instead, double-click the Excel table to display Excel Ribbon tabs you can use for formatting.
Figure 29.4 illustrates the Table Tools – Design tab. Figure 29.5 illustrates the Table Tools – Layout tab. Combined, they contain the majority of the tools you need to format tables.


PowerPoint lets you format tables in a number of ways, including the following:
• Applying different border styles, widths, and colors
• Inserting and deleting rows and columns
• Merging and splitting cells
• Applying table effects, including gradients, textures, background, and 3-D effects
• Aligning cell text to the top, bottom, or center
Setting Table Style Options
The Table Style Options group on the Table Tools – Design tab offers the following options for formatting the rows and columns in your table:
• Header Row—Apply a different color to the top row in a table and make its text bold.
• Total Row—Apply a different color to the bottom row in a table and make its text bold.
• Banded Rows—Highlight every other row in a table, using alternating colors, for easier viewing.
• First Column—Bold the text in the first column.
• Last Column—Bold the text in the last column.
• Banded Columns—Highlight every other column in a table, using alternating colors, for easier viewing.
Figure 29.6 shows a table with a header row and a total row.

Applying a Table Style
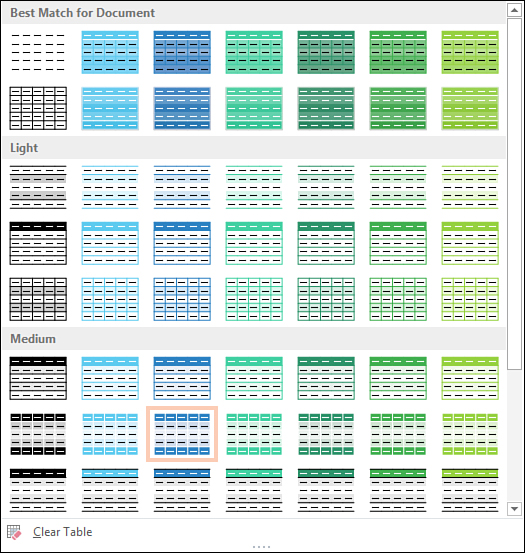
The Table Styles group on the Table Tools – Design tab displays suggested table style options. To view other options, click the down arrow on the right side of this group, as illustrated in Figure 29.7. If you want to remove formatting, click Clear Table.
Creating a Border
Use borders to draw attention to your table or even to specific information in your table. New tables get a black, solid line border by default, but you can change this. To format the border, select the table and use the Table Tools tab to change the border style, width, and color and to set where borders display.
Setting the Border Style
To set the border style, click the Pen Style drop-down list on the Table Tools – Design tab, which is located in the Draw Borders group. Choose the border style you prefer from the list, which includes the option to apply no border, a solid line, or a variety of dashed line styles.
Setting the Border Width
To set the border width, on the Table Tools – Design tab, click the Pen Weight drop-down list and choose the width you prefer. Options include point sizes from 1/4 point (a thin line) to 6 points (a thick line).
Setting the Border Colors
To set the border color, click the Pen Color button. The gallery that displays offers several possible colors, based on the presentation’s theme colors. For more color choices, click More Border Colors to open the Colors dialog box. Learn more in Chapter 5, “Working with Shapes and SmartArt.”
Creating Borders
You can specify which parts of your table contain borders: the whole table or only specific outside or inside areas. Applying creative borders such as diagonals is another option.
To set borders, on the Table Tools – Design tab, click the down arrow to the right of the Borders button. Select the border you prefer from the available options.
Setting Table Fill Color
You can change the color that fills one or more cells in your table.
 Caution
Be sure that your table text is still readable if you change a cell’s fill color. For example, if your text is black, don’t fill cells with dark blue.
To change table fill color, follow these steps:
1. Select the cells whose fill color you want to change.
2. On the Table Tools – Design tab, click the down arrow next to the Shading button.
3. From the palette that displays, you can perform the following actions:
• Choose from the colors on the palette. You can choose colors that complement your theme or any of a variety of standard colors.
• Click More Fill Colors to open the Colors dialog box. You can either choose from a large number of colors in this dialog box or create a custom color.
• Apply pictures, gradients, textures, and table backgrounds. See Chapter 5 for more information about these options.
To remove a fill you no longer want, select No Fill from the palette.
Applying Table Effects
The Table Tools – Design tab also offers the option to apply formatting effects such as bevel, shadow, and reflection to your table. Click the down arrow next to the Effects button to view available formatting effects. You can also select table text and choose any of the formatting options in the WordArt Styles group. Learn more in Chapter 3, “Working with Text.”
Working with Columns and Rows
It never fails: As soon as you create a table and format it just so, you find that you need to add or remove information.
To insert a row into your table, click in the row above or below where you want to insert the row. Then, from the Table Tools – Layout tab, choose Insert Above or Insert Below, as appropriate. PowerPoint inserts the row, as shown in Figure 29.8.

When you add or delete rows and columns, your table might no longer fit well on the slide. You then need to resize the table by dragging a corner. Be careful, however, that you don’t hide existing text by making the cells too small during resizing. If you want to insert multiple rows, select that number of rows before selecting the Insert command. For example, if you select two rows and then choose Insert Above in the Table Tools – Layout tab, PowerPoint inserts two rows above the selected rows.
To add a new column to your table, click in the column to the left or right of where you want to insert the column. Then choose Insert Left or Insert Right from the Table Tools – Layout tab.
Merging and Splitting Cells
One way PowerPoint makes tables flexible is by enabling you to merge and split table cells. For example, if you want a table to have a title centered at the top, you can merge all the cells across the top row. If you need to show two separate bits of information in one location, you can split one cell into two.
To merge cells, select the cells you want to merge. Then, on the Table Tools – Layout tab, click the Merge Cells button. Figure 29.9 illustrates five cells that were merged into one.

 Note
Note
If you already have text in each of the cells you merge, each cell’s text becomes a line of text in the new single cell.
To split a cell, select the cell you want to split, and then click the Split Cells button on the Table Tools – Layout tab. The Split Cells dialog box displays, where you can specify the number of rows and columns you want to insert in this particular cell.
Specifying Other Layout Options
The Table Tools – Layout tab offers other formatting options to explore. In the Cell Size group, you can set cell size options, such as the following:
• Table Row Height—Apply the specified height to table rows you select.
• Table Column Width—Apply the specified width to the table columns you select.
• Distribute Rows—Resize the rows you select so that they’re the same width.
• Distribute Columns—Resize the columns you select so that they’re the same height.
In the Alignment group, you can specify alignment, text direction, margins, and table size:
• Align Text Left—Align selected text to the left.
• Center—Center selected text.
• Align Text Right—Align selected text to the right.
• Align Top—Align text to the top of the cell.
• Center Vertically—Align text to the vertical center of the cell.
• Align Bottom—Align text to the bottom of the cell.
• Text Direction—Set the text direction as horizontal, rotated 270°, rotated 90°, or stacked.
• Cell Margins—Set text margins in a normal, narrow, or wide format, changing how far your text is from the cell’s edges. You can also remove all margins.
In the Table Size group, specify the exact height and width of the table. Optionally, you can also lock the aspect ratio as you make changes (to prevent the table from getting formatted out of perspective).
In the Arrange group, perform advanced multiple-object formatting, such as bringing objects to the front or sending them to the back.
Adding Bulleted and Numbered Lists Within Tables
To create a bulleted list within a table cell, select the cell. Then, on the Home tab, click the Bullets button. To create a numbered list within a table cell, select the cell. Then, on the Home tab, click the Numbering button.
Deleting Tables and Table Contents
If you no longer need your table or want to start over creating a table, you can delete an existing table in your PowerPoint presentation. You can also delete rows, columns, or selected table text.
To delete an entire table, on the Table Tools – Layout tab, click the Delete button and then click Delete Table from the menu that displays.
Tip
Another way to delete a table is to click the outside border of the table to select the entire table and then press the Delete key.
To delete rows or columns, select the rows or columns you want to delete. Then, on the Table Tools – Layout tab, click the Delete button. Select either Delete Rows or Delete Columns from the menu that displays. PowerPoint deletes the selected content. To delete text in a cell, select the text (not just the cell) and press the Delete key.