
11. Adding Tables and Charts
Tables in their simplest form are a grid of interconnecting rows and columns. The areas made by this interconnectivity are called cells. You can fill cells with text, numbers, artwork and pictures, or even with other tables. You can choose to create tables with or without borders, or add borders around certain cells, add background shading, and numerous other options.
Tables present data in an easy-to-read fashion. For example, you might need to present side-by-side lists in a document, or type up a household budget, create a form, or even design a web page. Because a table’s columns and rows are so easy to resize the way you want, there’s no limit to the things you can do with tables. Tables are ideal for making invoices, catalogs, newsletters, or any kind of situation in which text requires defined structure.
In addition, Word provides numerous options for modifying and styling tables and their data. Sometimes you might need to nudge a row or column size to add a little space around the cell contents, or add and subtract cells, columns, and rows. Other times, your table might require a complete makeover with new fonts and styles.
Charts offer another way to present related data, but with less detail and more visual impact than tables. Word includes 10 different chart categories—each with a unique purpose—such as column, line, pie, bar, or area charts. Like tables, you can edit, modify, and format charts to suit your exact needs.
Inserting Tables
Word offers several ways to create a table, from simple to sophisticated. You can
• Insert a basic table from a grid
• Insert a table using the Insert Table dialog box
• Create a Quick Table
• Draw a custom table
• Insert an Excel spreadsheet as a table
Inserting a Basic Table
The easiest way to create a table is to click the Table button on the Insert tab and specify how many columns and rows you want simply by dragging the mouse across the grid, as shown in Figure 11.1. As soon as you release the mouse button, your new table instantly appears in the document at the current cursor location, as shown in Figure 11.2.

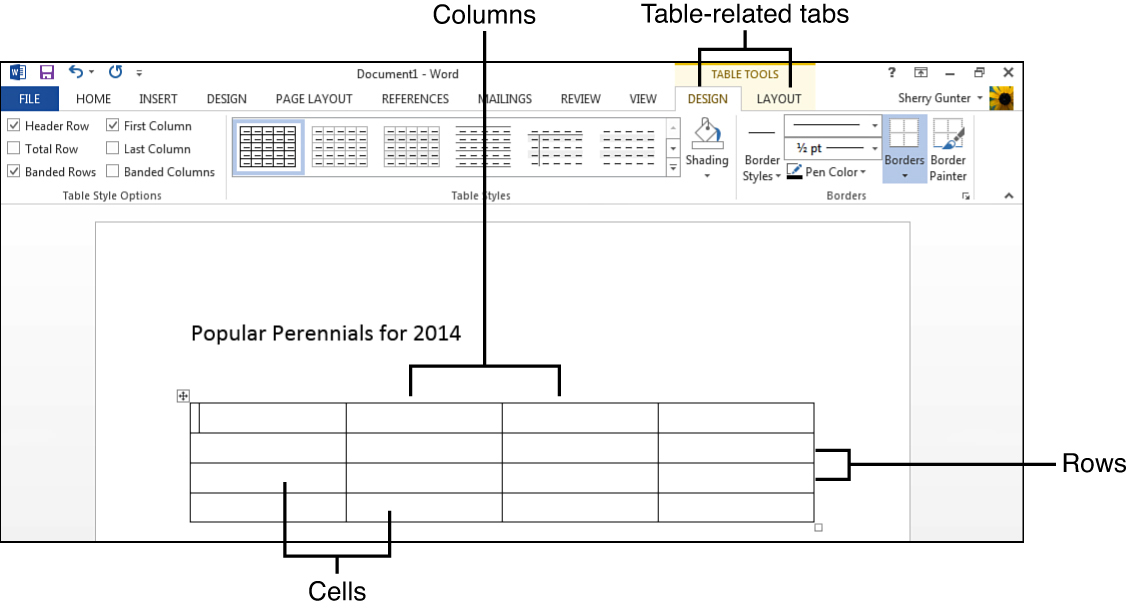
Any time you add a table or click anywhere in one, the Ribbon immediately displays the Table Tools tabs, which include the Design tab, which is filled with various table style options and design features, and the Layout tab, which includes tools for changing the table’s columns, rows, cell size, alignment, and so on.
Word assumes you want to begin filling your table starting with the first cell, so the cursor sits in the first table cell ready for you to type in text. At this point, you might be wondering how to navigate your tables. Here are a few methods to help you move around in them:
• Press the Tab key on your keyboard to navigate from cell to cell.
• Press Shift+Tab to move back to the previous cell.
• Use the arrow buttons on your keyboard to navigate up and down, right and left in a table. Each click of the button moves the cursor to the next cell.
• Press Ctrl+Home to move to the first cell in the table.
• Press Alt+Page Up to move to the top cell in the current column.
• Press Alt+Page Down to move to the last cell in the current column.
Of course, you can always use the mouse to navigate between cells, clicking which cell you want to work in.
Inserting a Table Using the Insert Table Dialog Box
If you want to control not only columns and rows, but also how text behaves within the table cells, you can create a table using the Insert Table dialog box, shown in Figure 11.4, and choose from the AutoFit options available. To do so, follow these steps:
1. On the Insert tab, click the Table button.
2. Click Insert Table.
3. Specify the number of columns and rows (see Figure 11.3); click the spinner arrows or just type in a value in the appropriate box.

4. Select an AutoFit behavior; you can choose a particular column width, fit the contents to the table (which means the columns expand to fit whatever you type), or fit the table to the window (which means the table fits the size of your document).
5. Click OK. Word creates your table.
You can convert existing text into a table using Word’s Convert Text to Table command. First select the text you want to turn into a table, click the Table button, and then choose Convert Text to Table from the menu. You can then specify the number of columns you want or let Word determine the quantity for you, and instruct Word how you want the text separated (such as paragraphs or commas). Click OK, and Word carries out your instructions.
Inserting and Creating a Quick Table
Although design-it-yourself tables are fun, you might prefer to speed up your table creation using one of Word’s built-in Quick Tables, which are part of Word’s library collection of Quick Parts and built-in building blocks. You can use the Quick Tables gallery to insert calendars, tabular lists, and preformatted tables with preset subheadings. Basically, building blocks are tiny templates you can reuse for formatting new content. To access the gallery, click the Table button on the Insert tab and click the Quick Tables command to view the gallery, shown in Figure 11.4.

When you see a Quick Table you like, click it in the gallery to insert it into your document and add your own text to personalize the table. All the built-in tables include placeholder text for things such as column headings or calendar months. Figure 11.5 shows an example of a Quick Table with subheadings.

 Tip
Tip
To learn more about using building blocks or Quick Parts, see Chapter 10, “Applying Advanced Formatting.”
When you customize a Quick Table, or any table for that matter, you can turn it into a Quick Part and use it again. Click the finished table’s upper-left corner icon to select the table, click the Table button and choose the Quick Tables command, and then click Save Selection to Quick Tables Gallery. This opens the Create New Building Block dialog box where you can name the table and add a description. By default, the table you save becomes part of the building blocks library and appears in the Quick Tables gallery along with the other table templates.
Drawing a Custom Table
Another way to insert a table into your document is to draw it yourself. For example, you might have a plan for a particular layout for your table that includes one really wide column and several smaller ones, or perhaps your content needs both small and large cells in the same table. With Word’s Draw Table feature, you can control how big the table is, how many columns and rows it contains, and the size and spacing of those columns and rows.
To draw a table, follow these steps:
1. On the Insert tab, click the Table button.
2. Select Draw Table. The mouse pointer turns into a pencil icon.
3. Click and drag the size of the table you want to create.
4. Click and drag each row and column you want to appear inside the table, as shown in Figure 11.6.
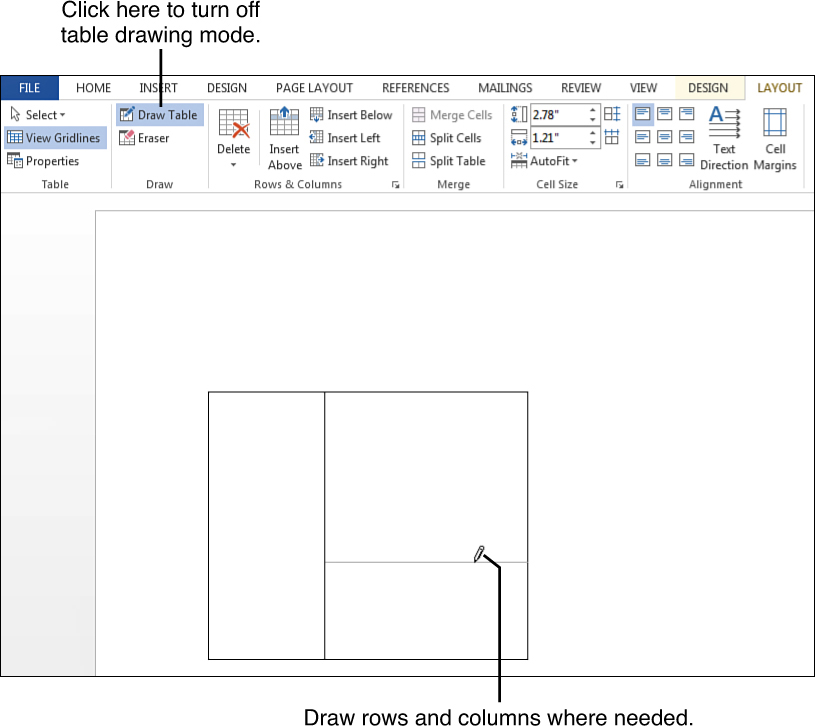
5. When the table is finished, click the Draw Table button on the Table Tools – Layout tab to turn off drawing mode.
You can edit your table by drawing new lines, erasing existing lines, or dragging lines to resize cell borders. Try some of these techniques to fine-tune your newly drawn table:
• To erase a line, click the Eraser tool on the Table Tools – Layout tab and drag across the line you want to erase.
• To add a new line to create a new column or row, click the Draw Table button on the Table Tools – Layout tab and draw the line. The button toggles the drawing mode on or off.
• To reposition a row or column border, drag the border line.
Inserting an Excel Spreadsheet as a Table
What if you need a table that acts more like a spreadsheet than like Word content? Word has a tool for that—the Excel Spreadsheet command inserts a spreadsheet right into your document. Best of all, when you activate this feature, you can tap into tools for adding formulas and functions, sorting and filtering, and more, thus putting powerful spreadsheet features at your fingertips.
When you insert a spreadsheet, you might suddenly think you’ve opened the Excel program window. As you can see in Figure 11.10, Word’s Ribbon immediately switches to reveal Excel tabs and tools. Don’t worry; as soon as you click outside the Excel spreadsheet table, you’re back in the familiar Word environment again.
To insert an Excel spreadsheet as a table, click the Table button on the Insert tab and select Excel Spreadsheet.
Word opens a blank spreadsheet for you, as shown in Figure 11.7. Excel spreadsheets act a lot like a regular Word table; you can enter text or numbers, resize columns and rows, add pictures, and so on. The row and column labels (numbers for rows and letters for columns) don’t print with your table; rather, they are used with formulas and functions you might add to the table. The table gridlines appear in printouts, but you can format them to your liking.

FIGURE 11.7 You can insert an Excel-style table into Word and use Excel tools to populate the table.
Tip
You can also use the universal Copy and Paste commands to copy Excel data into Word. See Chapter 2, “Working with Office Applications,” to learn more.
Selecting Table Parts
Before you can apply formatting or other changes to your table data, you need to learn how to select the various parts of your table. Selecting table parts is similar to selecting regular document text. Figure 11.8 shows an example of a selected row; notice all the row cells are highlighted in gray to signify that they’re selected.

FIGURE 11.8 You can easily select parts of the table in order to apply formatting or make other modifications.
Use these selection techniques to select parts of the table:
• Select a single word or number by double-clicking it.
• Select a cell by moving the mouse pointer to the left border of the cell until the pointer looks like a thick arrow icon and then click.
• Select a cell by triple-clicking it.
• Select multiple cells by dragging across them.
• Select an entire row by moving the mouse pointer to the left border of the row until it takes the shape of a thick arrow pointer and then double-click.
• Select an entire column by clicking the top border of the column. (The mouse pointer turns into a thick downward-pointing icon when you’re hovering over the column border.)
• Select the whole table by clicking the tiny square in the upper-left corner of the table.
• Select parts of your table by clicking the Select button on the Table Tools – Layout tab and choosing an option from the menu.
To deselect any selected area or item in a table, just click anywhere outside the selected element.
Modifying Tables
Word tables are extremely flexible. You can modify columns and rows, add and delete cell content, merge and split cells, modify alignment, reposition and resize tables, and enhance tables with styles and borders.
Changing Column Widths and Row Heights
Every column and row in a table is resizable. You can expand and contract columns and rows to modify the appearance of your table. For example, if the cell contents look too tight, adjust the column width, or if you need to insert more lines of text in a cell, you can adjust the row height to fit more text.
Resizing by Dragging
One of the most direct ways to change the column width or row height is to move the border yourself. You can do this by dragging the row or column border. Move your mouse pointer over the border you want to adjust until the icon changes to a double-sided arrow pointer, as shown in Figure 11.9. Next, click and drag the line to the size you need. When you drag a row or column border, it affects the entire row or column. Depending on what line you’re dragging and which direction you’re dragging it, the column width grows or shrinks, or the row height gets taller or smaller.

Using the Tab Tools
You can also adjust the cell size using the controls found on the Table Tools – Layout tab, one of the two Table Tools tabs displayed whenever you work with a table. In the Cell Size group, shown in Figure 11.10, you can see and set measurements for columns and rows. The first measurement (Table Row Height) shows row height, and you can adjust it using the spinner arrows or you can type in a precise measurement (based on inches). The second measurement (Table Column Width) shows column width, and again, you can click the spinner arrows or type in a value to change the setting. Simply click in a cell in the row or column you want to change and then specify another value on the Table Tools – Layout tab.

Under the Table Row Height and Table Column Width controls on the Table Tools – Layout tab sits the AutoFit command. AutoFit does exactly as its name suggests—it automatically adjusts the row or column to fit the content, resizes to fit the page, or enables you to set a fixed width. Click the AutoFit button and make your selection. AutoFit Contents is the default setting unless you specify something else.
Using the Table Properties Dialog Box
Yet another way to set column width and row height is through the Table Properties dialog box, shown in Figure 11.11. You might use this route if you want to set a few additional options along with resizing your columns and rows, such as controlling how a row or column breaks across pages; specifying a minimum width or height; or changing the measurement from inches to percentage.

Use one of the following options to open the dialog box:
• Click the dialog box launcher in the lower-right corner of the Cell Size group on the Table Tools – Layout tab.
• Right-click the table and choose Table Properties from the pop-up menu.
• Click the Properties button on the Table Tools – Layout tab.
Next, click either the Row tab or the Column tab within the dialog box to view the associated settings.
Here’s something interesting about the Table Properties dialog box: The Row and Column tabs both offer two buttons labeled Previous and Next that you can use to set different row height or column width values for each row or column in your table. Set a value for the current row or column, click the Previous or Next button (depending on which direction in the table you’re going), and set another value for the next row or column.
Adding and Deleting Columns and Rows
An essential part of working with tables is the ability to add and subtract columns and rows. For example, you might need to add some columns to include more data in a table, or you might want to remove rows you no longer need.
One technique that’s quick and easy is to just move your mouse pointer over to the left of a row line, as shown in Figure 11.12, and click. Word inserts a new row immediately. If it’s a new column you want, move the mouse pointer over the top of a column border line, as shown in Figure 11.13, until it becomes a plus icon, and then click to instantly insert a column.


Another option is to right-click a cell in the column or row to display the pop-up shortcut menu, click the Insert command, and then click an Insert option. You can insert a column to the left or right of the current location in the table, or insert a row above or below the current location.
Just as easy as the right-click method is to use the tools on the Table Tools – Layout tab (refer to Figure 11.10). The Rows and Columns group offers four buttons for managing your layouts: Insert Above, Insert Below, Insert Left, and Insert Right. For example, clicking Insert Above adds a new row directly above the current row, clicking Insert Left adds a new column directly to the left of the current column, and so forth.
If it’s removal you want, you can click the Delete button on the Table Tools – Layout tab (refer to Figure 11.10), and remove columns and rows using the Delete Columns or Delete Rows commands. To remove multiple columns or rows, first select them, and then activate the appropriate command.
Do you want to add multiple rows and columns? That’s easy—first select the number of columns or rows adjacent to the spot where new columns and rows are to be inserted. Now when you activate the Insert command, Word inserts the same number of new rows and columns. (Repeat, if necessary; for example, if you want to insert four columns but can’t select that many because you have only three columns, select two of the columns and then choose Insert twice.)
You can also remove multiple rows or columns by selecting them before applying a deletion technique.
Tip
Did you make a mistake and delete the wrong column or row? No problem; just click the Undo button on the Quick Access toolbar (upper-left corner of the program window, above the Ribbon’s tabs).
Adding and Deleting Cells
Adding and removing columns and rows might seem like a no-brainer, but adding and removing individual cells might require a little more thinking. When you insert a new row, you’re inserting new cells spanning the entire table. However, some table structures you work with might only require an additional cell, not a bunch of cells. You can choose to add and delete individual cells in a table.
The Delete Cells dialog box, which you were introduced to in the previous section, enables you to remove a cell and specify how you want the other cells to adjust. For example, if you remove a cell in a column, you might want the cells below the deleted cell to shift up, filling the hole created by the removal process.
To access the Delete Cells dialog box, right-click over the cell you want to remove and choose Delete Cells. You can also click the Delete button on the Table Tools – Layout tab and choose Delete Cells. Click either Shift Cells Left or Shift Cells Up, and then click OK to apply the changes to your table.
The Insert Cells dialog box works in a similar fashion, except your table cells are making room for the new cell you add. Start by clicking where you want to insert a new cell; then right-click and choose Insert, Insert Cells. Next, click either Shift Cells Right or Shift Cells Down; click OK to apply the changes.
 Note
Note
Naturally, you might assume the Delete key on your keyboard deletes table elements, such as cells, but that’s not the case. Pressing Delete only deletes the cell contents. Pressing Insert also doesn’t insert table elements.
Do you need to delete the whole table? On the Table Tools – Layout tab, click the Delete button and then select Delete Table.
Merging and Splitting Table Cells
You can use the Merge Cells command to turn two or more separate table cells into one big cell (see Figure 11.14). For example, you might combine two side-by-side cells to create a large cell for a title across the top of your table, or combine two cells vertically to insert a large logo or picture.

To merge selected cells, click the Merge Cells button on the Table Tools – Layout tab. Word immediately merges the cells, including any content each might have held.
Splitting cells is the reverse of merging them. When you split a cell, you are creating two new separate cells out of one cell (see Figure 11.15).

To split cells, follow these steps:
1. Select the cells you want to split.
2. On the Table Tools – Layout tab, click the Split Cells button. The Split Cells dialog box opens, as shown in Figure 11.16.

3. Specify the number of columns or rows you want to create; type in a number or click the spinner arrows to set a number.
4. Click OK.
Tip
You can also split a table into two separate tables using the Split Table button on the Table Tools – Layout tab.
Changing Cell Alignment and Margins
Don’t forget you can use any of Word’s formatting tools to enhance the appearance of your table, such as changing the font, size, color, and so forth. You can also change table alignment—the way in which text is positioned within a cell. The Table Tools – Layout tab offers all the alignment options as buttons listed in the Alignment group (refer to Figure 11.10). Not only do these commands pertain to horizontal positioning of text (left, center, right), but also the vertical positioning (top, center, bottom). To assign an alignment to a cell, click in the cell or select the group of cells and activate an alignment setting.
Tip
Pause your mouse over each button in the Alignment group to view a description of what it aligns.
Word automatically assigns some default margins to your table cells, giving them a little bit of breathing space between the text and the sides of the cell. You can make adjustments to these inner margins using the Table Options dialog box, shown in Figure 11.17. Click the Cell Margins tool on the Table Tools – Layout tab to open the dialog box.

You can change the margin settings by clicking the spinner arrows or by typing a value (measured in inches). Click OK to exit the dialog box and apply the changes to the current cell. Be sure to select the entire table if you want to apply the margins to all the cells.
Note
You can use the Text Direction button on the Table Tools – Layout tab to change the direction of text in a cell, thus creating text that reads vertically in the cell. Each click of the button rotates the cell’s text.
Repositioning and Resizing Tables
When you insert a table into your document, default settings determine its positioning on the page. Mainly, the table is automatically left-aligned on the page itself, and no text wrapping is applied. Text wrapping refers to how text flows around an object you add to a page, such as a picture, logo, drawn shape, or, in this case, a table.
To find positioning controls for the entire table, click the Properties button on the Table Tools – Layout tab. This opens the Table Properties dialog box to its Table tab, shown in Figure 11.18. You can use the options on this tab to set a different alignment and turn on text wrapping, which is helpful for a smaller table that you want paragraphs to flow around. You can even use the Table Properties dialog box to indent the table’s position from the left margin or set a preferred width for the table.

If the Table tab is not displayed, click it to view its contents. After you make changes to the settings, click OK to exit the dialog box and apply them to the current table.
You can move a table and drop it anywhere you want it to appear in your document. When you click inside a table, the table icon appears in the upper-left corner of the table, as shown in Figure 11.19. You can click and drag the icon to move the table.

You can also resize a table by dragging the bottom-right corner of the table. Resizing a table automatically resizes all the rows and columns in the table to fit.
Enhancing a Table with Table Styles and Borders
If you need to speed up your table design work without all the effort of applying various formatting, consider assigning a style instead. Table styles let you enhance a table using one of Word’s built-in table designs that include colors, borders, background cell shading, fonts, and more. You can find the Table Styles gallery on the Table Tools – Design tab, shown in Figure 11.20.

A style gives your table an instant makeover. For example, Figure 11.21 shows a simple table, and Figure 11.22 shows the same table with a style applied. As you can see, a style adds immediate impact and gives the table visual depth and emphasis in the document. Styles are a great way to make your table stand out, plus you can tweak the style after you assign it to make the table look the way you want. As part of Word’s Quick Parts, templates, and built-ins, table styles are easily modified.


To assign a preset style to selected table content, choose a style in the Table Styles group on the Table Tools – Design tab (see Figure 11.23). Word immediately applies the chosen style. You can preview all the styles from the Table Styles gallery simply by moving your mouse pointer over each style. Word previews the effect on the current table.

Note
You can modify an existing table style and save it as a new style in the gallery. Start by applying all the necessary formatting to the table and then click the New Table Style button at the bottom of the full Table Styles gallery. This opens the Create New Style from Formatting dialog box where you can type a name for the style and change any other settings as needed. Click OK when you finish, and Word adds the style to the gallery. Now it’s ready to go the next time you need it.
To the left of the Table Styles gallery sit the Table Style Options. You can turn these on or off to customize your table style. For example, if you choose a style with banded rows, you can turn off the shading for the bands to change the appearance of the style. You can experiment with the options to see what looks best on your particular table.
To the right of the Table Styles gallery is a Shading drop-down menu, shown in Figure 11.24. Click the button to display a palette of background shading you can add to your table cells. You can apply shading to a selected cell or the entire table.

The far-right side of the Table Tools – Design tab offers a variety of tools to create borders in your tables. You can change the border style, line thickness, and color, and create custom borders for certain sides of a cell. For example, to change the border style, click the Border Styles drop-down arrow and choose from the Theme Borders gallery. You can experiment with the various formatting features here to create just the right framework for your table or table cells.
Inserting Charts
Microsoft Word’s charting feature taps into the power of spreadsheets and helps you create visuals to illustrate quantitative and qualitative data, such as a graph showing sales figures for last month or a pie chart of total expenses. You can access charting tools directly in Word without ever having to open Excel or another spreadsheet program. Figure 11.25 shows an example of a pie chart.

If you’re new to creating charts, review what chart types are available and familiarize yourself with chart terminology. Then, you can start inserting charts and learning how to tweak them with a little formatting.
Understanding the Chart Types
First, determine what sort of chart you want to create. You can choose from 10 different chart categories, and each one has a specific purpose. Word enables you to create the following chart types: column, line, pie, bar, area, X Y (scatter), stock, surface, radar, and combo. Within each category, you can find a variety of styles to depict the data. For example, if you go with a bar chart, the bars measure something of quantity, such as dollar amounts, and you can choose stacked or clustered bars, or bars rendered in 3-D style. Before thinking about styles, decide on a chart type. To help you out, take a look at this list describing the categories:
• Column—Shows changes in data over a period of time or compares data.
• Line—Shows trends in intervals, such as time.
• Pie—Shows how individual values are proportional to the sum of the whole.
• Bar—Compares data using rectangular horizontal bars.
• Area—Shows trends or amounts of change over time or across categories.
• X Y (Scatter)—Illustrates relationships between numerical values or trends across uneven time periods.
• Stock—Illustrates fluctuating stock prices.
• Surface—Looks like a topographical map; illustrates combinations between data values.
• Radar—Shows changes in values relative to a center point. This chart type looks like a spider web.
• Combo—Uses a combination of chart types to illustrate up to three data series.
Note
Two more categories are listed in the Insert Chart dialog box: Recent and Templates. The Recent category keeps track of recently used charts so you can quickly insert them again without wading through the chart types. The Templates category lists any charts you’ve saved as templates to reuse in more chart creation.
Understanding Chart Parts
Not all charts look the same, but the general elements are fairly common. Charts are typically composed of several key parts, and naturally those parts have distinct names:
• Data points—The individual values you plot in a chart. For example, if you’re creating a chart that tracks monthly sales, the total for each salesperson is a data point on the chart.
• Data series—A group of related values in a chart. Back to the monthly sales total example used previously, if you’re charting three months’ worth of sales for each salesperson, you’re using a data series—three totals for the same person makes it a series, you see.
• Data categories—When you organize data for a chart, such as the three months you’re tracking for sales, the name of each month becomes a data category in your chart.
• Axes—The display of horizontal and vertical scale upon which the data is plotted. The X axis, also called the category axis, is the horizontal scale, and the Y axis, also called the value axis, is the vertical scale. In the monthly sales example, the X axis lists the individual salespeople by name and the Y axis lists the monetary values by which you are measuring their success, such as increments of $1,000 or $10,000.
• Axis labels—Text that identifies what data is being plotted on the chart, such as time intervals, categories, or monetary scale.
• Plot area—Shows the measurement for the given values in the chart, such as how much money each salesperson generated displayed in bars or lines, and so on.
• Legend—A summary or key indicating what the chart is mapping. Depending on the type of chart, the legend identifies the data series or differentiates between the series.
• Chart area—Refers to the entire chart and all its parts, including any borders you assign.
• Gridlines—Also called tick marks, these are the lines that appear in the plot area to help you read your chart and line up the chart data with the scale it’s illustrating.
• Data table—The chunk of worksheet cells you use to enter the chart data. You can include the cells in the final chart, if you want, if you need to show how you built the chart.
• Chart text—You can add chart titles, subtitles, and other information text to a chart. You can also format the text to correspond with the rest of the document.
Figure 11.26 shows some of these chart terms pointed out on an actual chart.

Inserting a Chart
Decide where you want your chart to appear with a click on the page and then follow these steps:
1. On the Insert tab, click the Chart button to open the Insert Chart dialog box (see Figure 11.27).

2. Select a chart type.
3. Select the chart you want to create.
4. Click OK. Word creates the chart, similar to Figure 11.28.

The Word program window displays a worksheet grid, a large chart area filled with placeholder chart elements. In addition, two new tabs appear on the Ribbon: Chart Tools – Design and Chart Tools – Format.
Entering Chart Data
Now it’s time to start entering chart data. On a chart, the grid of columns and rows is the datasheet, the spot where you record all the data you want to turn into a chart. The datasheet window even presents some helpful placeholder data to help you get started, and names it appropriately to give you a clue as to what might go where.
To begin, click in a cell and type your data. As soon as you type something, Word updates the chart with the new data. Let’s reuse that monthly sales totals example we’ve been talking about so far. For this example, use a Column chart. To display three salespeople’s totals across three months, you can type the month names as your column headings, as shown in Figure 11.29.

Next, add the individual names of your sales force in the row headings, shown in Figure 11.30.

The intersecting cells hold all the sales figures for each person, as shown in Figure 11.31. Type in the sales amounts for each person in their corresponding columns and rows.

When you finish typing in all the chart data, you can close the datasheet by clicking the little window’s Close button. You can also drag it by its title bar to move it out of the way, or minimize it. If you do close it and want to open it again, right-click the chart and click Edit Data or click the Edit Data button on the Chart Tools – Design tab.
Editing Charts
As soon as you click anywhere on a chart, the Chart Tools – Design and Chart Tools – Format tabs appear. The Chart Tools – Design tab offers tools for fiddling with the design elements of the chart, and the Chart Tools – Format tab has tools for changing the appearance of chart shapes, text, and arrangement.
To add items to your chart, go to the Chart Tools – Design tab, shown in Figure 11.32. If you click the first button on the tab, the Add Chart Elements button, a drop-down menu appears listing various elements you can add. Click a category to open a submenu and then click the item you want to insert. For example, if you want to include a legend—a key to what all the colors or data series stand for—click the Legend category and click a location for the item. You can easily experiment with each of the items listed to see what they look like in your chart. As you move the mouse pointer over each, the chart reflects the addition.

The Chart Tools – Design tab offers other chart-changing tools you can apply:
• Don’t like your original layout? Click the Quick Layout button to select another. (These are the same layouts you viewed in the Insert Chart dialog box.)
• Don’t like the chart color scheme? Click the Change Colors button and choose another color set to apply.
• Don’t like the chart’s overall style? Swap it out with something different from the available styles listed in the Chart Styles gallery. Chart styles include colors, fonts, and backgrounds.
• Don’t like your chart type? Click the Change Chart Type button to open the Change Chart Type dialog box and select another chart type.
If you need to edit your chart’s data, you can click the Edit Data button and select Edit Data from the drop-down menu. This opens the datasheet window you used to enter all the chart data. If you would rather do your editing in Excel instead, click the Edit Data in Excel 2013 option.
The Chart Tools – Format tab, shown in Figure 11.33, displays tools for changing the formatting attributes of your chart parts and controlling the position of the chart. Most of the tools are the same tools used to format SmartArt, shapes, and pictures, so this section doesn’t discuss them, except to talk about a few unique to charts.

FIGURE 11.33 Use the tools on the Chart Tools – Format tab to change the appearance of various chart elements.
On the left side of the tab is a group of tools labeled Current Selection. You can use these tools to format a particular selection in your chart, such as the legend or data series. When you click the Format Selection button, a pane opens with additional options you can apply to format the selection, as shown in Figure 11.34. The pane changes based on what item you’re formatting and you can click the tools within the pane to make different types of changes, such as changing a fill color or plotting the series on another axis. Many of the tools duplicate what’s already offered on the Chart Tools – Format tab, such as the Shape Fill or Shape Effects tools. But the pane handily groups tools related to the task at hand in one spot so you can easily change the settings for the selected item all at once. When you finish using the pane, click its Close button.

In addition to Ribbon tabs, you can also jump right to task-related chart-editing features using some special shortcuts, shown in Figure 11.35. When you work with a chart, four icons appear to the right of the chart:
• Layout Options—Displays text wrapping settings to control how the chart interacts with the rest of the document page.
• Chart Elements—Add or subtract chart elements using this pop-up list.
• Chart Styles—Gives you quick access to the Chart Styles gallery to change the chart appearance.
• Chart Filters—Edit data points and names on the chart using this pop-up list.

Click an icon to view its related information.
Tip
You can right-click on a chart to view a shortcut menu of commands to help you edit and format chart elements.