
If you encounter service disruptions, interruptions, or performance issues, you may need to perform investigations. In the event of performance issues, you should pay particular attention to site design and customizations that have been deployed, especially in SharePoint classic sites.
While extensive troubleshooting techniques for SharePoint Online performance issues are outside the scope of the MS-300 exam, it is important to be familiar with the availability of tools used to investigate issues. Two common tools used in troubleshooting include the Internet Explorer or Microsoft Edge F12 Developer Tools and the third-party tool, Fiddler:
- Internet Explorer F12 Developer Tools are available by pressing F12 while the browser is running.
- Microsoft Edge Developer Tools are available by pressing F12 while the browser is running.
- Fiddler is available from the developer's website at http://www.telerik.com/fiddler.
The browser's Developer Tools' Network tab can be used to time page load times and help to determine which components are taking longer to load. To investigate load times of components, follow this procedure:
- Launch either Microsoft Edge or Internet Explorer and navigate to the SharePoint Online site that is taking a long time to load.
- Press F12 on the keyboard to enable the Developer Tools.
- If you are running Internet Explorer, the Network tools may be indicated by the presence of a Wi-Fi network icon. If you are running Microsoft Edge, the Network tools are indicated by the word Network and a play button, as shown in the following screenshot. Select whichever applies to your environment:

- After it has brought up the page, click the Refresh button on your browser to reload the page.
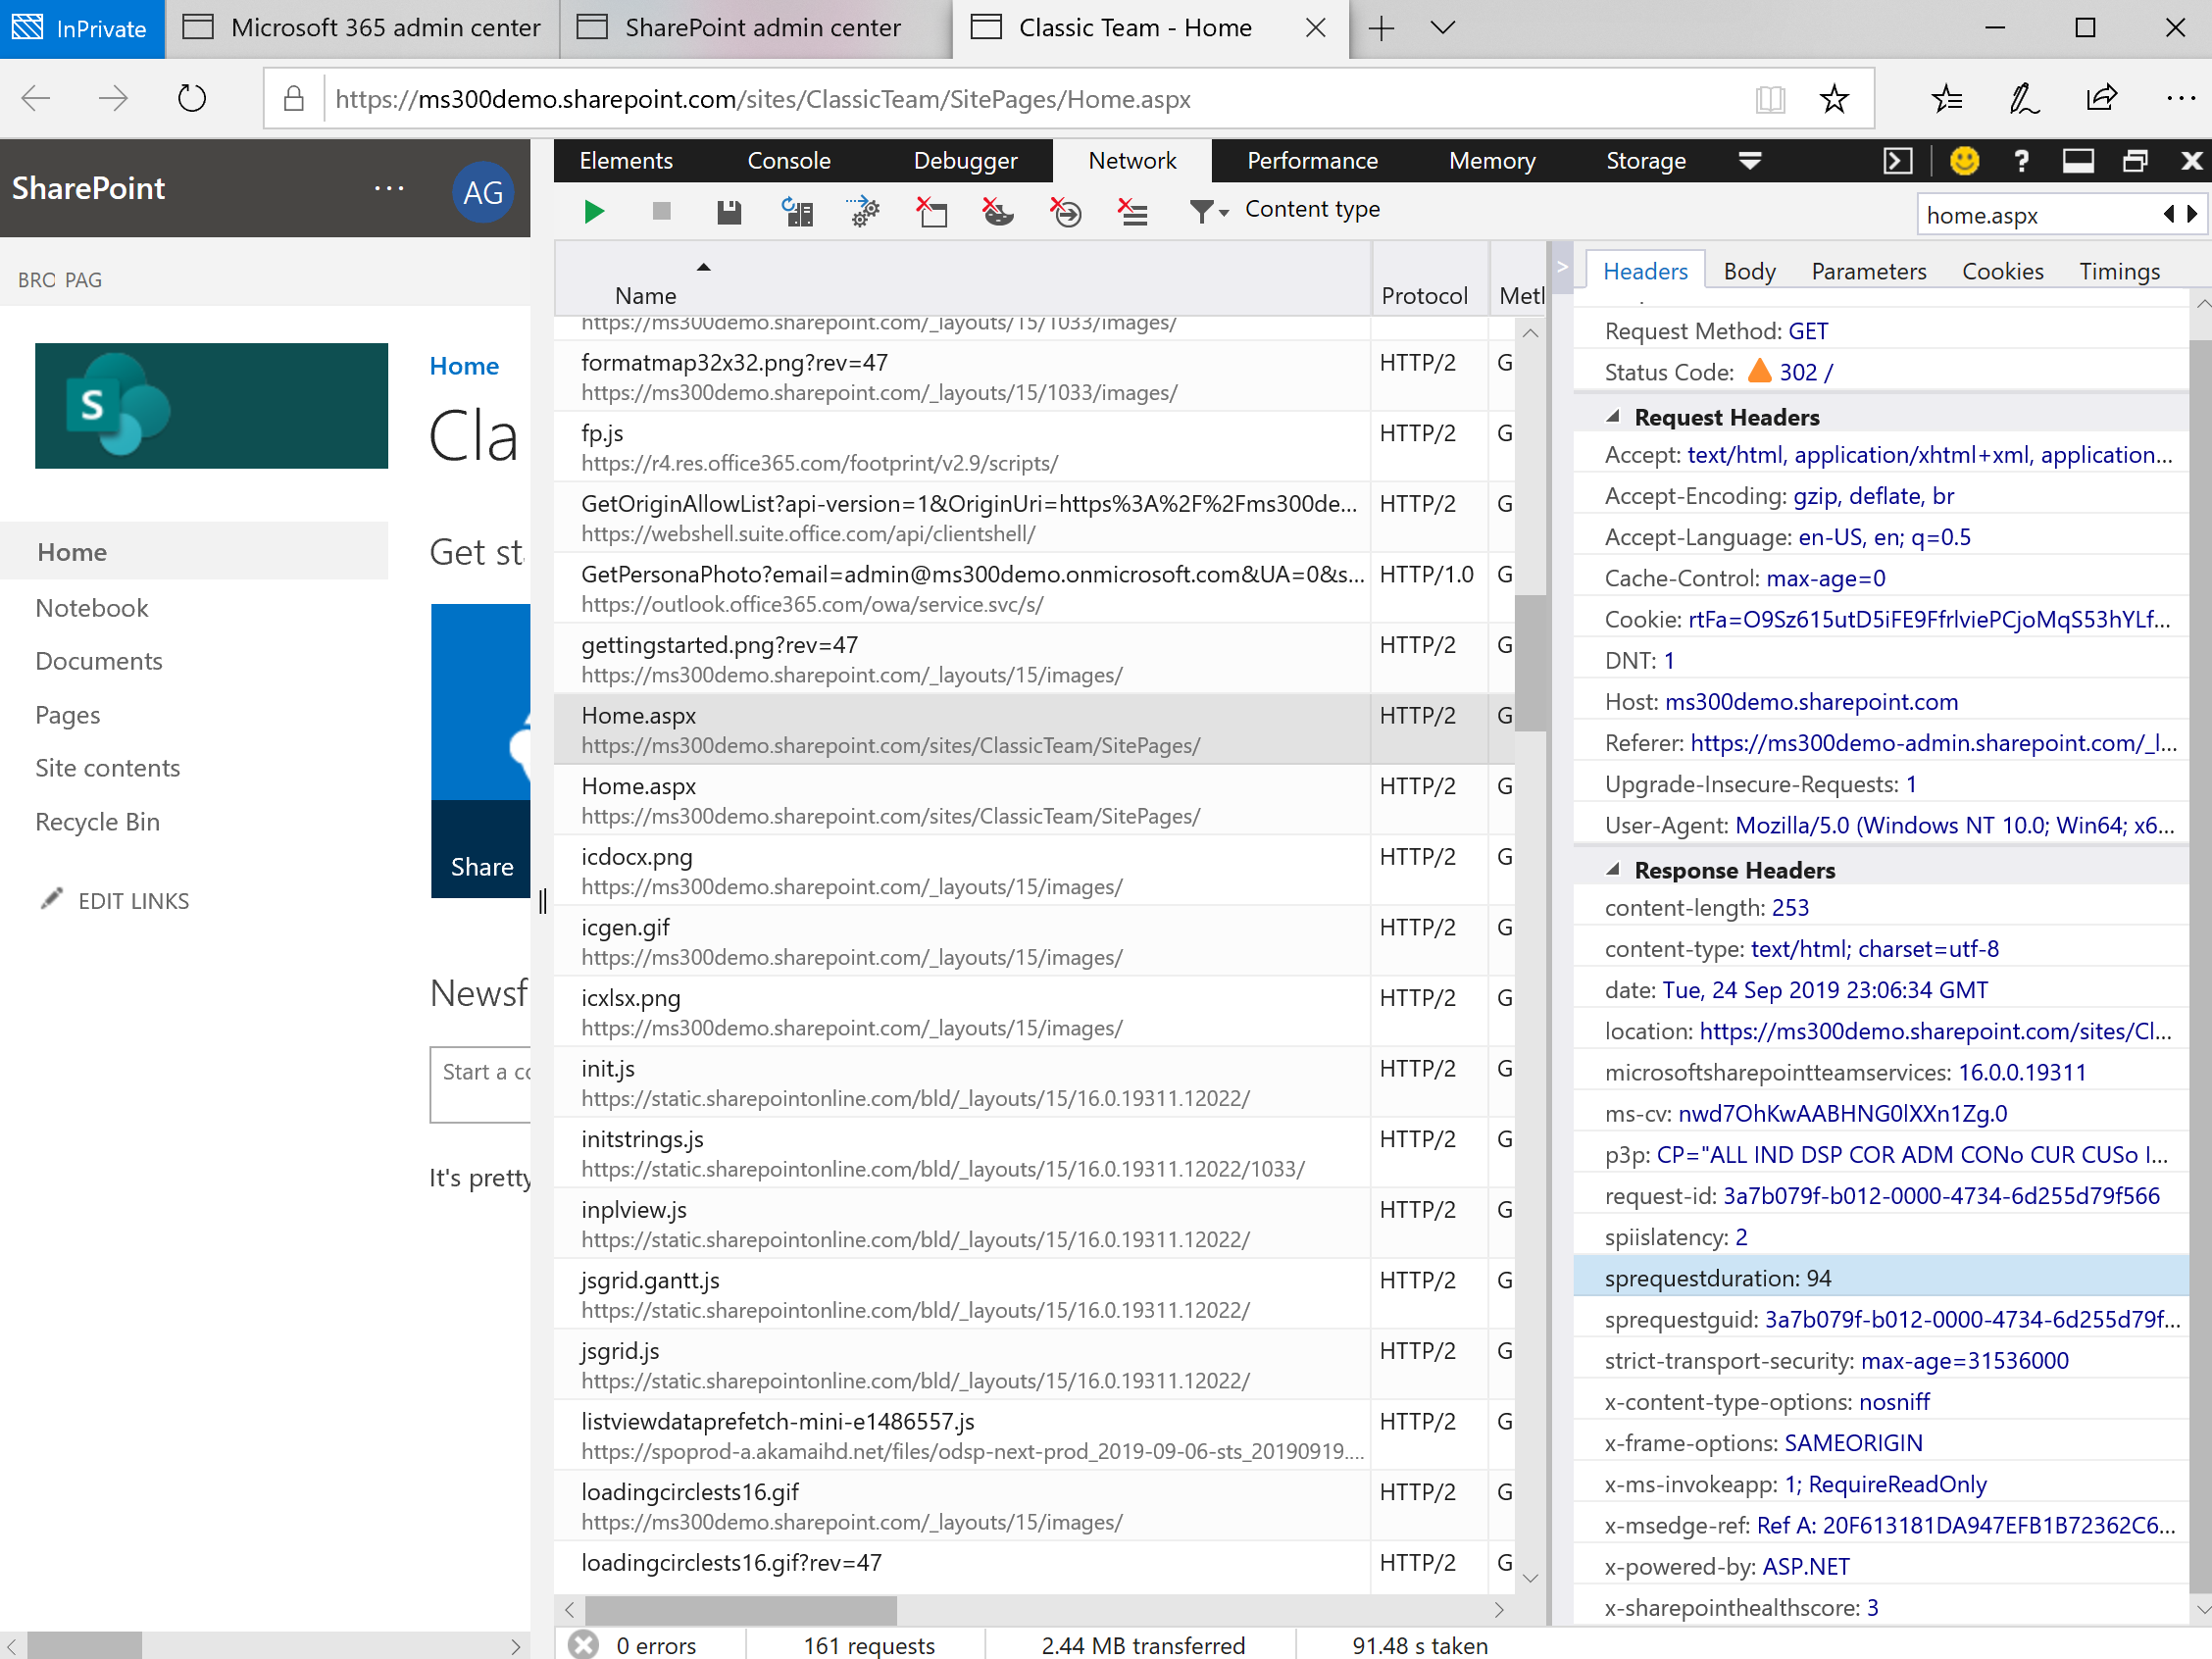
- Select one of the .aspx pages that is loaded (such as Home.aspx) in the list:

- Expand the Response Headers, and locate sprequestduration. Note the value for each .aspx page loaded:
- Create a new site or site collection without any customizations and repeat the process (creating a baseline), comparing the sprequestduration values for each of the pages in the baseline versus the poorly performing site.
- Investigate the custom code deployed on the pages where the sprequestduration values are higher than the baseline.
For additional performance tuning information, see https://docs.microsoft.com/en-us/office365/enterprise/tune-sharepoint-online-performance.
For service interruptions or disruptions, you should start at the Service Health dashboard, which is covered in the next section.