
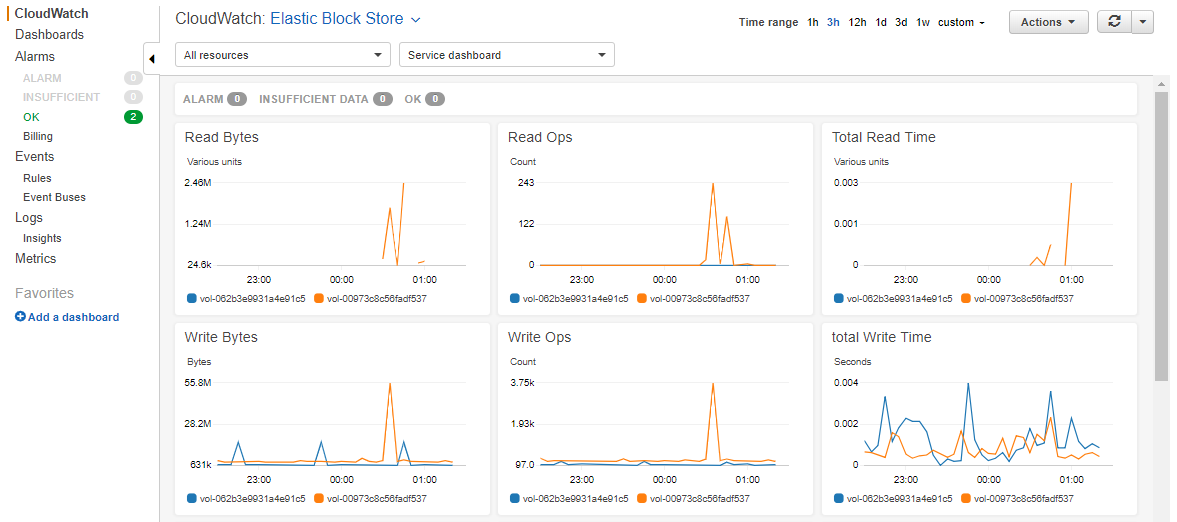
Like the EC2 instances, monitoring block volumes is critical to understanding the operating pattern of our application. Critical information about the performance of our disk, the latencies, I/O operations, and response times can be obtained through the CloudWatch service. We can overview the EBS metrics in the CloudWatch overview section by selecting Elastic Block Store, as shown in the following screenshot:
It is recommended to create a dashboard and appropriate widgets that represent a complete overview of the volumes being used by your applications. Remember that there are sometimes multiple volumes attached to one instance and the EBS metrics are bound to get even more complicated when looking at them in the overview section.
A dashboard for EBS volumes might look something like this example:
