
This chapter discusses tasks to perform after installing Microsoft System Center Operations Manager (OpsMgr). As we begin this chapter, we assume you have previously installed the PowerShell Command Shell and the core server-side components of OpsMgr on one or more servers. The core components we will refer to are listed here:
The OpsMgr operational database
The Root Management Server (RMS)
Reporting components, including the Data Warehouse database
The Web Console Server
After a default installation of OpsMgr with reporting, all these components are installed and will function at a baseline level.
If the core OpsMgr components are not installed, you may want to first read Chapter 6, “Installing Operations Manager 2007,” to step through a fresh install, or Chapter 7, “Migrating to Operations Manager 2007,” if you are migrating from Microsoft Operations Manager (MOM) 2005.
If you are familiar with any version of Operations Manager, you most likely will approach this chapter to become acclimated to the new System Center-based release of Microsoft’s server-monitoring software and its user interfaces. In this case, we suggest you read Chapter 2, “What’s New,” as an introduction. Chapter 2 describes the differences between Operations Manager 2007 and MOM 2005, as well as the different functionality in Operations Manager 2007 versus System Center Essentials 2007. If you are entirely new to Microsoft management products, focus instead on this chapter to familiarize yourself with Operations Manager 2007.
This chapter discusses basic configuration and administration of Operations Manager 2007, beginning with several mandatory post-installation tasks. You will learn about the functions and components of the Operations console, and how to install the console on remote machines. We step through wizards in the console to install agents and management packs. We also discuss Operations Manager security groups and their utilization in the Operations console, maintenance for the Operations database, and Operations Manager Reporting administration. In several sections of this chapter, we will also demonstrate how to perform tasks using PowerShell as an alternative to, or in preference to, the console.
After you successfully install the core management group components, two major configuration activities must take place before Operations Manager can start working for you. These actions are to import management packs and to discover objects to manage. We will walk you through these activities after we confirm the basic health of the management group.
Before you import management packs and discover objects to manage, we recommend a waiting period of about 24 hours after initial installation of the core components. This is particularly the case when you have distributed OpsMgr components across two or more computers, or when you need to wait to allow domain Group Policy-based Windows Firewall exceptions to propagate. Many interconnected components must cooperate to establish a management group; some workflows occur only periodically, and there is a lag between when you add an object and when the data for that object is available for the first time in the various reporting views. To let all the initial workflows progress completely and identify any problems, let the new management group components “percolate” for a business day or two before continuing. If you are in a hurry, you can also restart the OpsMgr-related services to kick-start this process.
After installing the core OpsMgr components, you will have a Root Management Server, Operations and Data Warehouse databases, a Reporting Server Component, and at least one Operations console. We begin our discussion with such a baseline management group configuration, which has just been deployed across three servers and has been running for a few days. If your deployments are more complex (for example, if you are clustering the RMS or deploying redundant management servers or gateway servers), we recommend you build out and validate the core components before implementing additional components. Figure 8.1 shows our sample management group, with server names listed, to help you follow the validation steps we will be performing.
We are going to “kick the tires” a little to make sure we have a stable foundation before moving forward with bringing this management group into a monitoring environment. Start with verifying that all instances of the console are closed; then open a new instance of the Operations console. (After you install the Reporting Component, this is necessary to make the Reporting features appear in the console.) Even better, we recommend installing the Operations console on an administrator workstation and performing all tests and production work using Operations consoles not installed on management servers.
Tip: Where to Run the Operations Console
We do not recommend running the Operations console on the RMS desktop or using a Remote Desktop Protocol (RDP) session to the RMS during the tests. It is not a good practice to run the Operations console on the RMS itself—you want to dedicate all RMS resources for the critical OpsMgr services it hosts.
In addition, using the Operations console from a computer other than the RMS tests several important communication channels between components in the management group. We will get a more complete checkup of OpsMgr’s health using a separate Operations console installed on a workstation or uninvolved server. For validation purposes, the computer running the console should be a member of the domain and on the same network segment as the Root Management Server and Reporting components.
Procedures for installing the Operations console on separate computers appear later in the “Deploying and Using the Operations Console” section of this chapter.
After connecting the console to the RMS, and possibly authenticating with the domain, we will expect to see a screen similar to Figure 8.2. This is the initial view of the Operations console, in a new management group with the Reporting Component installed. The first view of the Operations console displayed is the Administration Overview page, also seen when the root of the Administration hierarchy is selected in the Navigation pane on the left side of the console.

The Administration Overview page shown in Figure 8.2 includes an information element that will go away once mandatory initial configuration procedures are complete; this is the Required Configuration Incomplete banner with the comment:
In order for System Center Operations Manager to manage and monitor your network, you must complete the following steps.
The two steps listed are:
These two steps are just links to the same-named tasks on the right side of the Administration Overview page in the Actions section of the page.
We will perform these mandatory configuration activities after we check out the health of the core management group components. Begin by clicking the Monitoring navigation button. The Operations console reconfigures to display its default view of the Monitoring pane. Figure 8.3 shows the Monitoring Overview page, displayed when you select the root of the Monitoring hierarchy in the Navigation pane on the left side of the console.

The distinctive feature of the Monitoring Overview page is its dashboard-style chart of the quantity of computers and distributed applications in the Critical, Warning, Success, Maintenance Mode, and Unknown states. We expect to see a small number of computers at this point, because we have not added any objects to manage! The only managed computers in the new management group so far are the management server and the system running the operational database.
On the left side of the console, below the root of the Monitoring hierarchy in the Navigation pane in the upper corner, are seven view folders and the five default global views:
Active Alerts
Computers
Discovered Inventory
Distributed Applications
Task Status
Global views are views located immediately under the root of the Monitoring hierarchy. You can create new, custom global views under the Monitoring hierarchy root, as well as new view folders and hierarchies of folders. Notice the Show or hide views... link at the bottom of the Navigation pane. Clicking this link pops up the Show or Hide Views control shown in Figure 8.4.
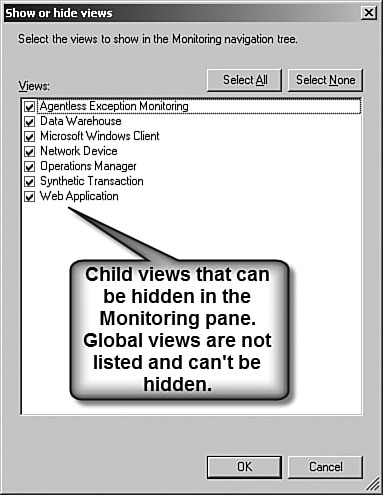
As you can see in Figure 8.4, you cannot toggle on or off the visibility of the global views—these views are always visible to those users who have permission to access them. The Show or Hide Views dialog box only applies to child view folders. The user role associated with the user running the console individually controls access to every view; this includes global views as well as each view in each child view folder. (We discuss user roles in detail in Chapter 11, “Securing Operations Manager 2007.”) Whereas users only see the views they have rights to, they can choose which child view folders to display in their console.
Selecting to look at just some of the view folders is useful when the organization has a large number of management packs installed and/or has created custom views; in these cases, an operator can hide the view folders that are not involved in performing their job. The three most important global views are the Active Alerts, Computers, and Distributed Applications views. You will access these views frequently when using OpsMgr. The Actions area on the top of the right side of the Monitoring Overview page includes shortcuts to these views. (The Go to Computers State view and Go to Distributed Applications State view links in the dashboard area are also shortcuts to the same views.)
Tip: Don’t Overdo the Number of Global Views You Create!
Because the operator cannot hide global views, OpsMgr administrators should avoid creating so many custom global views that the list of child view folders is pushed out of the Navigation pane.
We are going to check out the health of our new management group using the distributed applications monitor for the management group, created during installation of the OpsMgr 2007 product. The Monitoring Overview dashboard indicates that two distributed applications are monitored: One is in the success state and one is in the unknown state. To investigate further, we can click one of the convenience links to the Distributed Applications state view on the Monitoring Overview page, or navigate directly to the Distributed Applications state global view in the Navigation pane.
In a default installation of OpsMgr 2007, two objects are listed in the Distributed Applications state global view. Because of our dashboard view, we expect one to be in the unknown state, and the other we hope is in a success state. The distributed application in the unknown state is clarified in the state view to be in a “Not monitored” status, and it’s identified as “A connector used by MOM components to insert discovery data, please create your own connector do not use this connector” (partially displayed in Figure 8.5). This object is “MOM shrapnel,” and we are going to ignore it. However, we do have to get used to seeing that particular distributed application in a perpetually “Not monitored” state.
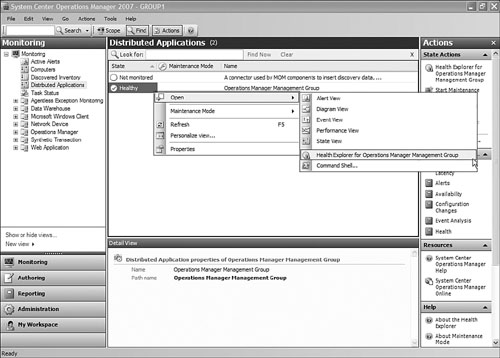
The other object listed in the Distributed Applications state global view is valid and important to us—this is the Operations Manager Management Group distributed application. Figure 8.5 shows us navigating to the Distributed Applications state view, right-clicking the Operations Manager Management Group distributed application, and expanding the context-sensitive menu choices available for selection. Our cursor is over the command to invoke the Health Explorer for Operations Manager Management Group.
This distributed application object represents the health of our management group and is a convenient and centralized vehicle to oversee the end-to-end monitoring capabilities of OpsMgr.
Note: Tools for Reviewing Distributed Application Health
The best OpsMgr tools for reviewing the health of distributed applications are the Health Explorer and the Diagram view.
The Health Explorer for a distributed application clearly shows that data from multiple managed objects is included in the health model for that application. Figure 8.6 shows the Health Explorer for the Operations Manager management group. The Health Explorer opens in its own window. In this figure, we expanded some paths in the health model to verify that monitors in the success state exist for multiple components of our management group.
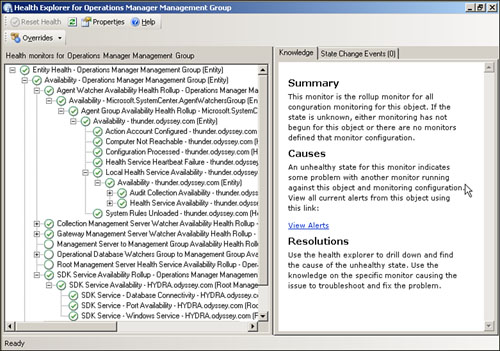
Notice in Figure 8.6 that availability data of various services and features is included from both the OpsMgr Operations Database Component (on Thunder in our environment) and the OpsMgr Root Management Server Component (Hydra). The availability monitor for the management group appears as a rollup of the availability state from several perspectives. The Thunder computer (database server) is hosting the watching processes for agent group availability, whereas Hydra (RMS) is reporting on availability of the SDK service.
Agents connect to the RMS, but the Health Explorer shows that the computer hosting the Operations Database Component watches this process. Likewise, the SDK service connects to the operational database, but the RMS watches this process. At first glance, these monitoring perspectives seem contrary; that is, one might expect to monitor the database from the database component. In fact, the concept of externally watching a process from a separate component is a chief design feature and strength of the OpsMgr 2007 architecture.
With the health model showing success indicators for the Operations Manager Management Group, we can close the Health Explorer. Returning to the distributed application menu choices displayed in Figure 8.5, we will select the Diagram view to continue our validation of a successful installation of OpsMgr 2007. The Diagram view opens in its own window, similar to the Health Explorer. When we select a view by right-clicking an object and that view opens in its own window, we are said to be pivoting to that view.
Figure 8.7 shows the Diagram view of the Operations Manager Management Group after pivoting from the Distributed Applications global view to the Diagram view. We observe a simplified presentation of the health model, specifically calling out dependencies and relationships between the managed objects that constitute the management group.
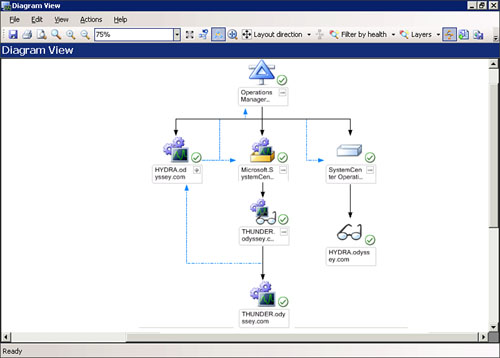
Notice in Figure 8.7 the object icons with the eyeglasses element. When you see those eyeglasses in a Diagram view, it means the object is a watcher node for one or more other objects. Follow the connection arrows in the Diagram view to discover the dependencies and relationships between objects and their watcher nodes.
Just as we validated in the Health Explorer (refer to Figure 8.6), we observe in the Diagram view in Figure 8.7 that Thunder, which hosts our Operations Database Component, is watching the availability of the agent group. Notice how the highlighted object, the Health Service Watcher Group, has an arrow pointing down to the Thunder Health Service Watcher. Similarly, notice the desk tray icon to the right of the highlighted object. This desk tray icon represents the Operations Database Watchers Group, and the arrow to the Hydra watcher icon below that indicates that Hydra is the watcher node for the health of the operational database.
For a large, complex distributed application, the Diagram view is the best way (or perhaps the only way) to visually diagnose cross-platform interdependencies. The Diagram view makes clear what objects are watching what other objects. This is invaluable to enable you to rule out that an alert of a failed distributed application is not simply a failure of a watcher node process.
Another unusual icon you might notice in Figure 8.7 is the top-level (or rollup object) triangle laid over a T-shaped intersection of pipes. This icon represents a distributed application in OpsMgr Diagram views. We can select this rollup object in our Diagram view and read useful high-level information about the distributed application in the Details pane. Figure 8.8 shows the management group details when you select the rollup object in the Diagram view.

Closing the Diagram view, we return once more to the Distributed Applications global view in the Monitoring pane, shown previously in Figure 8.5. Now we want to test our PowerShell installation and integration with OpsMgr. Right-clicking again the distributed application Operations Manager Management Group, we will select Open -> Command Shell... to launch PowerShell in the OpsMgr group context. We type in the cmdlet get-State and observe the reply in Figure 8.9.
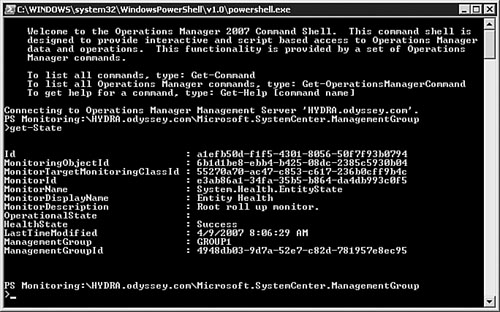
Notice in Figure 8.9 the prompt line after the line Connecting to Operations Manager Management Server ‘HYDRA.odyssey.com’. From the prompt line, we confirm that the PowerShell (PS) context is
Monitoring:HYDRA.odyssey.comMicrosoft.SystemCenter.ManagementGroup
This context represents the rollup monitor of the distributed application—the same triangle-and-pipes object we reviewed the properties of in Figure 8.8. The response from PowerShell to the get-State cmdlet returns the health state and some descriptive details related to the shell’s context. We are looking for the response line HealthState: Success. This is the command-line equivalent to the green check mark of the Success state in the Operations console!
Another functionality we want to validate is graphing performance counters in the Operations console. After closing the PowerShell window, we right-click once again the distributed application Operations Manager Management Group and pivot to the Performance view by selecting Open -> Performance View. A new Performance window will open with an initially empty Results area and rows of counters to select for display in the Details area. The empty Results pane will have neither a units nor a time scale, and there will be a reminder that we need to select some counters to see data on the graph.
In Figure 8.10, we sorted the list of counters by the type of counter; then we scrolled down to locate the System Up Time counters. Because there are counters from two managed computers forming part of the Operations Manager distributed application, we notice two System Up Time counters—one for each computer. We tick the check boxes for those counters in the Show column and immediately see the graph populated with linear data; units appear on the left scale and time on the lower scale (see Figure 8.10).

Our test of the console’s graphical performance counter display function is successful, as shown in Figure 8.10. In the instance of System Up Time performance counters, the units on the left scale are seconds. The chart correctly reflects that both computers were restarted about 5:00 p.m. the previous day, so their chart lines, although of different colors, are almost superimposed on one another. The counters increment steadily to the right as the quantity of seconds of uptime accumulates. Now that we have confirmed that rendering of performance graphs is functional, we want to unselect the check boxes in the Show column to clear the charted results pane and restore the view to its defaults. Then we can close the Performance window.
These checks verify the Operations Manager distributed application is healthy. There are just a few more items to check before we are ready to import management packs and discover objects to manage. We need to look at any unresolved alerts in the management group, and we want to validate that the Reporting Component is installed correctly and working.
To view alerts, we need to change our focus to the Active Alerts global view. The quickest way to do this is to click directly the Active Alerts view immediately under the root of the Monitoring hierarchy in the Navigation pane on the left. Or, if you prefer, you can return via the Monitoring Overview page by clicking the root of the Monitoring hierarchy. Then in the Monitoring Overview page, click the View All Active Alerts shortcut in the Actions area on the right.
Because we have not imported any application or operating system management packs, we will only observe alerts created by the base Operations Manager management pack. These alerts will relate to the health of the management group itself, and we will want to resolve any critical alerts before proceeding. Figure 8.11 shows our initial view of the active alerts in our new management group.

It is normal for there to be just a few alerts here, which we hope were transitory and coincide with installing the management group components. It’s certainly possible for certain OpsMgr components to raise alerts during the installation of other components and then not properly auto-resolve—we call this a transitory alert because such events occurred during atypical conditions and are not expected to reoccur during normal operation of the management group.
Alerts we do not expect to reoccur can be resolved. These would include alerts with a low alert repeat count, or an alert where a reasonable interval of time has passed without that alert reoccurring. You can check the age and repeat count for an alert by right-clicking the alert and selecting Properties, which brings up a dialog box similar to the one shown in Figure 8.12.

This figure shows the General tab of an alert, involving a monitoring script failure, after we selected to view alert properties. In this case, we have a Warning alert, which is less serious than a Critical alert. The alert has only occurred twice, and not in the past 5 days.
Reading the alert description tells us the script failed, reporting that the specified domain does not exist or cannot be contacted. This could have been due to temporary connectivity issues, or because domain controllers or DNS servers were being restarted. It is safe in this case to close this alert; if it reoccurs, we can escalate our investigation. We close the alert by changing the alert status from New to Closed and clicking the OK button.
On the other hand, if there are many alerts, particularly if they do not appear to be transitory, these need to be resolved before going further. In particular, you should not import management packs or add additional managed objects if there are critical alerts that you cannot resolve or perhaps do not understand.
Techniques for Resolving Alerts
Here are some tips on getting past critical alerts:
Locate and investigate monitors in the Warning (yellow) and Error (red) states in the Health Explorer of the computer that was the source of the alert. (Open the Health Explorer by right-clicking the alert and selecting Open -> Health Explorer.) If there are unhealthy monitors, they may correlate with the alert you are researching. Check out the Context pane of the State Change Events tab for possible additional clues to the root cause.
Read all the text in the alert properties. (Right-click the alert and select Properties.) In particular, carefully review the Alert Description field on the General tab and the Description field on the Alert Context tab.
Right-click the alert and pivot to the Event view (select Open -> Event View). Sort the events by the Level column and then locate the events with the Error and Warning event levels. Events may correlate with the alert you are investigating and provide insight to its resolution.
Review the complete Event logs of the computer that is the source of the alert. Do this via an RDP session to the computer or by remotely connecting your computer’s Event Viewer to that computer. Look for clues in the usual System and Application logs (or other applicable Event logs based on the computer’s role in the domain). If your local or domain security policy enables logging for security events, there may be security-related clues to the problem found in the Security Event log.
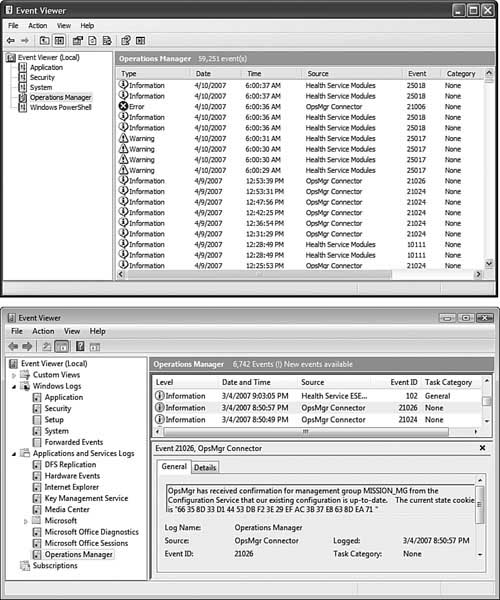
Examine the Operations Manager Event log on the involved computers. You will find the Operations Manager Event log on any computer with an installed OpsMgr component, including the Agent and Operations Console components. Figure 8.13 shows the location of the Operations Manager log in the Event Viewers for the Windows 2003 and Windows XP operating systems and for the Windows Vista operating system. Notice in the Vista Event Viewer that the Operations Manager log is located in the Applications and Services Logs group. You may not understand the meaning of every event in the Operations Manager log, but Warning and Critical events found there may help you make progress on resolving your issue.
Make sure to restart all the involved systems, including the Operational Database and RMS components. Review each system’s Event logs after restarting.
Invest a couple of hours in viewing the TechNet Support webcast “Troubleshooting Microsoft Operations Manager Top Issues,” found online at http://support.microsoft.com/kb/828936. A PowerPoint presentation is also available at that location for offline download if you want to skim the troubleshooting topics without watching the entire webcast.
Review the resources available at http://www.microsoft.com/technet/community/en-us/mom/default.mspx. Resources include blogs, links to newsgroups, top product support issues, and other online venues to assist you. You can also use your preferred general-purpose search engines such as Google, Yahoo!, and MSN Live.
Install a temporary management group on a second set or subset of computers and attempt to replicate or isolate the issue occurring in the first management group.
Attempt a Repair installation from the OpsMgr 2007 setup media on some or all of the components of the management group.
Uninstall and perform a clean setup of the management group components (basically, start over). If the same issues persist after a complete uninstall and reinstall of all OpsMgr components, reattempt installation but modify the setup environment. Examples of elements to alternate during reinstallation include using different or rebuilt Windows servers for management group components, modifying the proposed architecture to reallocate components in a different manner, and using different options for running the services. For example, in subsequent setup attempts, you can vary running the SDK service on the RMS as Local System, Network Service, or as a named user account.
Although some of these later tips may require a significant time investment, the goal is for you to end up with a management group installation that functions properly.
The last feature to validate for our new management group is the reporting function. This is particularly important to test when the Reporting Server and/or Data Warehouse Server components are on distributed servers. Because the Reporting Component installation uses a separate setup procedure than the one shared by most of the other core management group components, issues may come up with a distributed installation.
Because the reporting function in the OpsMgr console also depends on the IIS services of the Reporting Server component, you will want to test that the dependency is working properly. It is best to wait at least 24 hours after installing the reporting function before running a report in the Operations console.
To check out the reporting feature, we will return to the Operations Manager Distributed Application view. Click the Distributed Applications view in the Monitoring hierarchy in the Navigation pane on the left side of the Operators console.
Reports are views that you cannot pivot to in the Monitoring space by right-clicking an object. Although we are now at the same view shown in Figure 8.5 (the Distributed Applications State view), we see that Reports and Reporting are not options on the context-sensitive menu. To view the reports involving an object, select the object in the Results pane that you want the report on using a single left-click. Then in the Actions pane on the right, a collection of context-relevant reports appears to select from, as shown in Figure 8.14.

We are going to select the Health report to validate that the management group has been in a healthy state for at least the last 24 hours. The Health Report Setup and Run window appears; we show the top part of that window in Figure 8.15.
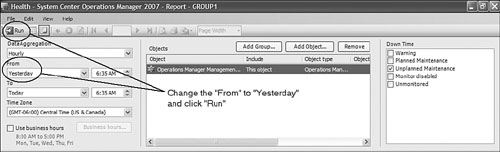
When the report window opens, the period of the report setup defaults to start and end times equal to the current date and time; so if you run the report without changing the time period, there would never be any data in it. We change the From (or start) date of the report from Today to Yesterday, creating a 24-hour interval to sample for the report. Click the Run button, and the report results appear shortly in the report window, as shown in Figure 8.16.
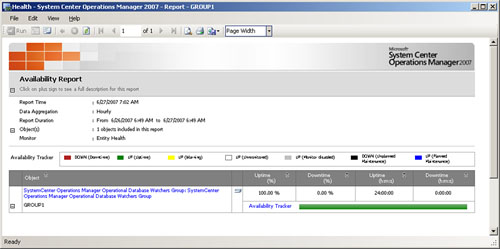
What we hope to see in the Availability Report shown in Figure 8.16 is 100% in the Uptime (%) column and 24:00:00 in the Uptime (h:mm:ss) column. This indicates that the health status of the management group was “success” for the 24-hour period of the report. We can drill down into each hour of the previous day by clicking the Availability Tracker link at the bottom of the Uptime column. This action generates an Availability Time report like the one shown in Figure 8.17, confirming the uptime of the management group for each of the preceding 24 hours.

If the reporting windows contain data and appear similar to those shown in Figures 8.16 and 8.17, consider your OpsMgr management group baseline installation complete and successful; you are ready to proceed with build-out activities such as importing management packs and discovering objects to manage. If your reports did not contain data or they did not render correctly in the Operations console, we recommend you troubleshoot and repair the reporting function before proceeding.
Tip: The Importance of Validating Before Going Further
When you import management packs, you also want accompanying reports to import correctly into your management group. If there is a problem with OpsMgr reporting functions, even before importing management packs, the reporting features of the management packs may not import or work correctly.
General data warehouse troubleshooting guidelines include the following:
All error information is contained in the errors posted in the Operations Manager Event log, under the Data Warehouse category. Examine the log for errors. If you suspect the Error log has wrapped, restart the OpsMgr Health service to freshen up errors on that box. The data warehouse does not report errors after their first occurance, unless there was a recovery in between; restarting the service causes the data warehouse to forget it had already reported the error.
Verify that the synchronization process is working. Check the contents of the ManagementPack table in the Data Warehouse database. This table normally has a list of the management packs installed in your management group (if you have more than one management group in your data warehouse, also check the ManagementGroupManagementPackVersion table). If the ManagementPack table is empty, check the Operations Manager Event log for errors concerning synchronization.
Check that your system is synchronizing Managed Entity information by viewing the contents of the ManagedEntityStage and ManagedEntity tables. If these tables do not have data, check the Event log for errors.
Verify that the SQL Services Reporting (SRS) component has all reports deployed by opening http://<reportserver>/Reports. See whether you have management pack folders that contain a Guid.mp file in them and whether the System Center Data Warehouse Report Library Management Packs reports are deployed.
After stepping through the management group installation validation procedures outlined throughout in this chapter, we now have a solid foundation on which to build our production management solution. Congratulations on getting this far, and we hope your understanding of some basic OpsMgr functionality is already enhanced! Now we are ready to import management packs into our new management group.
The installation process automatically imports a number of management pack libraries. These libraries provide a foundation of object types on which other management packs depend, and they contain basic settings used by OpsMgr for the minimum functionality to manage the OpsMgr application itself, such as the management pack for Operations Manager 2007. To see the list of default libraries and management packs, navigate to the Management Pack node of the Administration workspace as displayed in Figure 8.18. (We turned off the Actions pane in this screenshot, normally on the right side of the Operations console, to allow you to read more of the Description column in the list of management packs.)

Just to the right of the Management Packs heading in the Details pane of Figure 8.18 you can see the quantity (40). These are the management packs automatically imported in a new management group with the reporting component installed. Notice the listing of the Default Management Pack, which does not have a Yes in the Sealed column. The Default Management Pack is where new, custom management pack objects such as monitors, alerts, and rules may be stored. In addition, overrides to customize default settings in a sealed management pack are saved to the Default Management Pack, by default.
Source files for currently installed management packs are located on each management server at %ProgramFiles%System Center Operations Manager 2007Health Service StateManagement Packs. Do not import from this folder when performing future management pack import operations because these management packs are already part of your OpsMgr environment.
You must import other management packs into the OpsMgr management group to monitor specific applications. These management packs fall into several categories:
Management packs designed for OpsMgr 2007. These are included with the OpsMgr software distribution (that is, on the OpsMgr 2007 installation media in the ManagementPacks folder). The OpsMgr 2007 RTM software distribution includes 41 additional management packs, listed in Table 8.1.
Table 8.1. Management Packs Included with the OpsMgr 2007 Installation Media[1]
Software/Product
Related Management Pack(s)
Exchange
Exchange.Server.2003.Discovery
Exchange.Server.2003.Monitoring
Exchange Server Library
Information Worker
InformationWorker.CommonLibrary
InformationWorker.Office.2003
InformationWorker.Office.2007
InformationWorker.Office.XP
InformationWorker.Windows.Explorer
InformationWorker.Windows.Internet Explorer
InformationWorker.Windows.MediaPlayer
InformationWorker.Windows.Outlook ExpressandMail
InformationWorker.Windows.WindowsAndMSNMessenger
SharePoint
SharePointPortalServer.2003
SharePointPortalServer.Library
SQL Server
SQLServer.2000.Discovery
SQLServer.2000.Monitoring
SQLServer.2005.Discovery
SQLServer.2005.Monitoring
SQLServer.Library
System Center ASP.NET
SystemCenter.ASPNET20.2007
Windows Client
Windows.Client.2000
Windows.Client.BusinessCritical (XML)
Windows.Client.Library
Windows.Client.XP
Windows Server Internet Information Services
Windows.InternetInformationServices.2000
Windows.InternetInformationServices.2003
Windows.InternetInformationServices.CommonLibrary
Windows Server
Windows.Server.2000
Windows.Server.2003
Windows.Server.Library
Windows Server Active Directory
Windows.Server.AD.2000.Discovery
Windows.Server.AD.2000.Monitoring
Windows.Server.AD.2003.Discovery
Windows.Server.AD.2003.Monitoring
Windows.Server.AD.ClientMonitoring
Windows.Server.AD.Library
Windows Server Terminal Services
Windows.Server.TerminalService.2000
Windows.Server.TerminalService.2003
Windows SharePoint Services
Windows.SharePointServices.2003
Windows.SharePointServices.Library
Management packs designed for OpsMgr 2007, available from Microsoft and other vendors. Check the online System Center Pack Catalog at http://go.microsoft.com/fwlink/?linkid=71124.
Management packs converted from MOM 2005 format. These would include management packs that do not have an OpsMgr 2007 version available yet.
Custom OpsMgr 2007 and converted custom MOM 2005 management packs that you or a technology partner authored for specific situations.
It is a best practice to import only the management packs required to meet your monitoring and management goals. Specifically, it is a poor practice to import “every management pack you can find.” Each imported management pack incrementally increases the overhead load of the management group. Too many unused or unnecessary management packs can clutter the Operations console to the point that you miss indications of issues with the applications you do need to monitor.
In the next section, we will import some of the additional operating system and application management packs provided by Microsoft on the installation media. You might ask, “Why not import all of them?” Although you certainly may do that, we recommend you carefully review the list of management packs in Table 8.1 and import only those you will use in your environment.
You can use the Operations console or PowerShell to import management packs. Using the console provides visual feedback on the progress and status of the import operation, whereas using PowerShell offers opportunities for automating and error-proofing the import process. We will import some management packs using the console and then import some with PowerShell to demonstrate both methods. Perform the following steps:
Log on to the computer running the Operations console using a user account that is a member of the OpsMgr Administrators security group.
Navigate to the Administration pane, returning to the view shown in Figure 8.2 at the beginning of this chapter. Either click the Import management packs link in the Actions area of the Administration Overview or right-click the Management Packs node in the Navigation pane and select Import Management Packs....
The wizard prompts you for the location of the management packs to import. To import some or all of the management packs distributed with the OpsMgr setup media and listed in Table 8.1, navigate to the OpsMgr CD or software distribution folder and then to the ManagementPacks child folder. You will see the list of sealed management packs with .mp file extensions (and one unsealed management pack with the .xml file extension), as displayed in Figure 8.19.
Caution: Use the Most Current Version of Any Management Pack
Check the System Center Pack Catalog for more current versions of any of the management packs included on the installation media. You will definitely want to install the updated version of the Operations Manager management pack. The update includes bug fixes, several enhancements, and updates content for some of the rules and monitors. You can download the updated version from the System Pack Catalog.
To demonstrate some features of the import process, we will initially (and incorrectly) select only the Microsoft.SQLServer.2005.Monitoring.mp file. Choosing that file and clicking the Open button returns the error message shown in Figure 8.20.
There is a red “X” error symbol in the column to the left of the management pack name. In the Details section of the error message in Figure 8.20, we can read that the SQL 2005 Monitoring management pack depends on the SQL 2005 Discovery management pack and the SQL Server Library management pack. Because the SQL Server 2005 Monitoring MP is dependent on these two management packs, we cannot import the SQL 2005 Monitoring management pack without importing those required management packs as well.
Using the Add button in the Import Management Packs dialog box, we will include the required SQL 2005 management packs, as well as select the necessary management packs to monitor SQL 2000, Windows 2003 Server, and Terminal Services and IIS on Windows 2003, for a total of 11 management packs.
We recommend that you extend your management group initially with a subset of the available management packs—import only management packs for applications you know you will be actively monitoring. Although we will be monitoring Exchange and Active Directory, we will wait and import those management packs later, after confirming that this first, smaller group of management packs imports properly and begins working correctly.
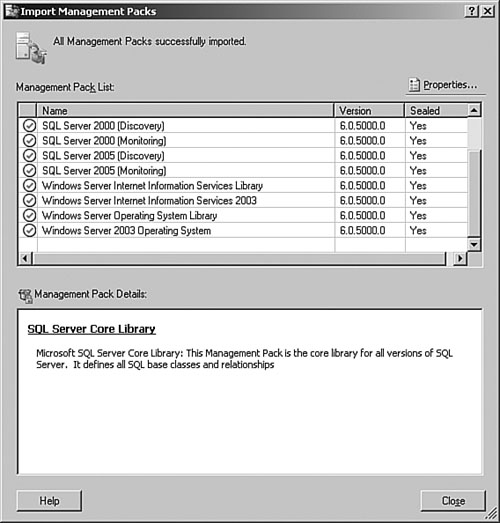
After adding these management packs to the list to be imported, we confirm that a large green check mark appears in the leftmost column, next to each management pack. The check mark indicates you have already installed the prerequisites for each management pack or they are in the list you just built. Clicking the Import button begins the process of importing each management pack in alphabetical order as it appears in the display, and we can observe the progress of the import job.
As each management pack is successfully imported, the large green check mark to the left of the management pack name changes to a smaller green check mark inside a green circle. Figure 8.21 confirms the successful import of the selected packs.


After the selected management packs have been imported, our new management group is ready to begin monitoring the SQL 2000 and SQL 2005 database server applications, the Windows 2003 operating system, and the IIS and Terminal Services features of Windows 2003. Before these management packs were imported, the only monitored application was Operations Manager 2007 itself! The discovery rules contained in the management packs immediately go to work, detecting which monitored computers the new management packs apply to, and deploying appropriate monitors and rules to those computers.
Next, we will import some management packs using the PowerShell command shell. We will add monitoring support for Microsoft Information Worker applications and the Windows Client operating systems to our new management group by importing the applicable management packs. We could import the management packs with PowerShell one at a time using the install-ManagementPack cmdlet. Perform the following steps:
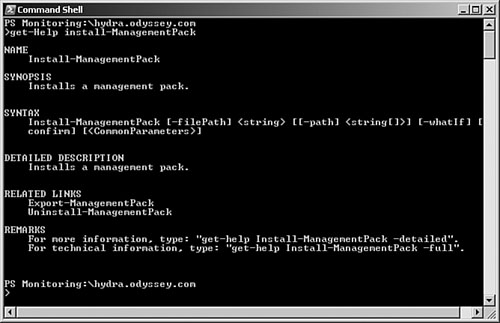
Figure 8.22 shows the PowerShell output to the command
get-Help install-ManagementPack.As you can see in Figure 8.22, the
get-Helpcmdlet provides us with the correct basic syntax to use theinstall-ManagementPackcmdlet. Notice in the Remarks section of the output that you can get even more help and details by adding the-detailedor-fullswitch to thegetHelpcmdlet line; this is true for most PowerShell cmdlets.Rather than running the
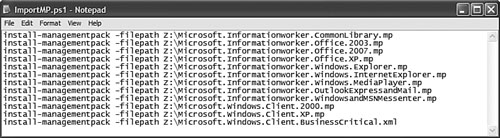
install-ManagementPackcmdlet each time for the dozen management packs we want to import, we will perform a batch import. To do this, we can create a PowerShell script and run the script inside a PowerShell instance. The script in this case is just a collection ofinstall-ManagementPackcmdlets, one on each line of the script. Figure 8.23 shows Notepad open to the ImportMP.ps1 PowerShell script we created to import the Information Worker and Windows Client management packs.Our script is a text file that contains an
install-ManagementPackcmdlet line for each management pack. To run the script shown in Figure 8.23 (saved as Z:ImportMP.ps1), we open a PowerShell instance (Start -> Program Files -> System Center Operations Manager 2007 -> Command Shell) and type Z:ImportMP.ps1 at the PowerShell prompt.Unlike the Operations console when we import management packs, using PowerShell does not provide feedback during the import process. If the import completes successfully without errors, you return to the PowerShell prompt without any status notifications. If errors occur during the import, PowerShell provides feedback with some details on the error(s) when the script completes.
Management pack dependencies are something to watch out for when using PowerShell to import management packs. Whereas the Operations console validates dependencies and will not proceed with management pack import if there is a problem, PowerShell batch operations fail unexpectedly when dependent management packs are not previously installed. It is a good idea to use the Operations console’s Import Management Pack feature to investigate management packs for their dependencies before creating a PowerShell script for bulk import. Then ensure your PowerShell script lists the management pack import cmdlets in a sequence that considers any dependencies.
Tip: Client Business-Critical Operating Systems
All the management packs distributed on the OpsMgr 2007 installation media are in the sealed .mp file format, except the Client Business Critical Operating System management pack, which is in unsealed .xml format. This management pack discovers and manages business-critical Windows client operating systems. This management pack has a dependency on the Windows 2000 Client OS Management Pack, as well as a dependency for the Windows XP Client OS Management Pack. Even if you are only going to manage business-critical Windows XP desktops, you also need to import the Windows 2000 Client OS Management Pack.
Now we will perform two quick checks to verify that the imported management packs are installed correctly and working. We will exit the Operations console and start it up again after the import operations, to make sure our console loads the new management pack elements.
You will recall that after completing our initial installation of OpsMgr 2007 with the reporting component, 40 management packs were installed in our management group. We observed the count of the number of installed management packs in the results pane header shown in Figure 8.18. We know we added 11 management packs using the Operations console and 12 with our PowerShell script (for 23 total additional management packs imported). Now, when we return to the list of installed management packs in the Administration space, we confirm with pleasure that there are 63 (40 + 23) management packs installed in our management group.
You can note in Figure 8.3, earlier in this chapter, that prior to any management packs being imported, seven child folders of views were present below the global views in the Navigation pane. After importing these 23 management packs, we expect some new views to be available in the Monitoring space. As a final check, we will navigate to the Monitoring space and open a view added by one of the newly imported management packs.
Figure 8.24 shows the Monitoring space after the additional management packs have successfully been imported. In the Navigation pane, we observe 11 view folders, four of which are new: Microsoft SQL Server, Microsoft Windows Internet Information Services, Microsoft Windows Server, and Microsoft Windows Terminal Services. The imported management packs added these folders of views, as well as new views in the Microsoft Windows Client folder.
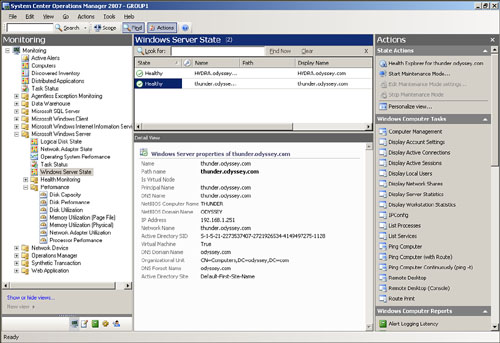
To verify we are getting the correct functionality of the Operations console after importing the new management packs, we can open one of the new view folders shown in Figure 8.24. The Windows Server State view in the Microsoft Windows Server view folder correctly shows that the operating systems of the two OpsMgr core component servers are in a Healthy state.
Our carefully deployed OpsMgr management group is now prepared to start doing work! That means identifying the objects we want to manage with OpsMgr, determining a method to bring those objects into a managed state, and making it all happen.
Operations Manager 2007 can manage computers and network devices. A computer is a Windows computer running one of the following operating systems: Windows 2000, Windows 2003, Windows XP, or Windows Vista. A network device is any computer or appliance that responds to Simple Network Management Protocol (SNMP) queries, such as a router, switch, print server, or even a computer running a non-Windows operating system such as Unix or Linux.
Computers can be monitored using the Operations Manager Agent Component (agent-managed) or with agentless monitoring. Because we are just doing the simple stuff in this chapter, we will illustrate a simple agent-managed deployment. See Chapter 9, “Installing and Configuring Agents,” for a full description of the different ways to deploy and use agents and network devices in your OpsMgr environment.
The simplest method for discovering objects is invoking the Computer and Device Management Wizard in the Administration space of the Operations console. Launch the wizard by right-clicking any node in the Navigation pane of the Administration space and selecting the Discovery Wizard option. You can also launch the wizard by clicking the Configure computers and devices to manage link in the Actions area of the Administration Overview page.
Note: Configuring the Windows Firewall
For any computer running the Windows Firewall, which includes Windows Server 2003 with Service Pack 1 or later, Windows XP with Service Pack 2 or later, and Windows Vista, you must modify the default configuration prior to installing agents to be sure that TCP ports 135 and 445 permit communications. We discuss this process in Chapter 11.
Let’s walk through the process of running the Discovery Wizard and bringing a computer into management. Perform the following steps:
After clicking Next through the introductory screen, your first decision to make is whether you will use an automatic or an advanced discovery method to locate prospective managed computers.
Selecting automatic computer discovery results in the wizard scanning all computers in the domain, quick and simple. Skip to step 3 in this procedure if you selected automatic computer discovery.
Choosing advanced discovery lets you select the computer or device type, choose the Management Server to perform the scan, and verify that you can contact the discovered computers.
If you selected advanced discovery type, the wizard next asks if you want to scan Active Directory for objects, browse for computer names, or type in computer names.
Scanning Active Directory (AD) requires that you specify the AD domain name and construct a query. Select or type the appropriate domain name in the domain field and then click the Configure button to bring up the Find Computer dialog box. You can type in a wildcard search string for the computer name field, including “*” to scan for all computer names. Clicking the Advanced tab lets you construct a multiline If query using the following fields: computer name, managed by, description, operating system (OS), and OS version.
If you are browsing for or typing in computer names, click the Browse button to bring up the domain object picker. Here, you can type any computer name or Fully Qualified Domain Name (FQDN), as well as use the picker to browse the AD and change or narrow the scope of the selection search.
Specify the administrator account the Discovery Wizard will use for installing agents. The Management Server Action Account performs computer discovery, and agent installations typically use this account.
Click the Discover button and the wizard uses the discovery type and method you selected to return a list of computers matching the discovery criteria and not yet managed by that OpsMgr management group (see Figure 8.25).
On the Discovery Results page of the wizard, shown in Figure 8.25, select one, several, or all of the discovered computers and then click Next. (We are selecting one computer, Quicksilver, which is the Reporting and Data Warehouse Database Component in our management group.)
A summary screen displays your choices. On the summary page, you can also change the default installation path for the agent (%ProgramFiles%System Center Operations Manager 2007) and specify credentials for the agent to use when performing actions. This is the Agent Action Account, which is typically Local System. We recommend you accept the default installation path and use the default Local System for the Agent Action Account unless you have clear indications to use the other options.
The Agent Management Task Status window opens and allows you to track the progress of the agent installation. You can close the status window at any time without interrupting the agent installation tasks. The Management Server Action Account remotely connects and starts the computer’s MOMAgentInstaller service, which in turns starts the Windows Installer service. The System Center Operations Manager 2007 Agent installation now completes, and the OpsMgr Health Service starts.
If the task status window is open, you will receive a Success indicator and notice that the agent installation completed. The complete install process takes less than 1 minute for a single computer on the local network segment. Within 5 minutes after the agent installation task is complete, the computer name will appear in the Operations console views as an agent-managed computer.

A useful feature of the Operations Manager 2007 architecture is the modular nature of the Operations console application. Although the console must minimally exist on the RMS, we do not recommend your monitoring operations staff exclusively utilize the console on the RMS or RDP sessions to the RMS to employ the console. Install the Operations console on workstations or access it using Terminal Server solutions, connecting to a server other than the RMS.
The console communicates with other components of the management group to render the data and views observed in the console. Install the console on whatever computers or virtual desktop solution your operations staff will use for monitoring duties. The console is completely dependent on network-level connectivity to the RMS and the Reporting server to function.
Although the console successfully operates against a management group when connected by a low-bandwidth connection such as a Virtual Private Network (VPN), its performance and responsiveness significantly decreases. The Operations console should optimally run on a computer in the same local area network (LAN) as the RMS and Reporting servers, or connect by private, routed networks that operate at 10Mbps or faster, such as 100Mbps or Gigabit Ethernet speed (recommended).
Workstations used by Network Operations Center (NOC) engineers responsible for system uptime are good choices for installing the Operations console. In a smaller environment, the system administrator’s desktop works great!
If the administrator or NOC engineer workstations are not co-located with the OpsMgr core servers and if a LAN-speed connection between the sites is not possible, consider installing the Operations console on one or more Terminal Servers licensed in Application Server mode. Locate the Terminal Server(s) in the datacenter where the OpsMgr core servers reside, and the NOC engineers can run the Operations console on virtual desktops wherever they might be. The network bandwidth consumed by the Terminal Services protocol, RDP, is much less than the bandwidth of the Operations console when communicating with the RMS.
You can install the Operations console on any computer that meets the following minimum prerequisites:
1GB physical memory minimum to install (2GB memory recommended).
One of these operating systems (or later): Windows 2003 Service Pack 1, Windows XP Service Pack 2, or Windows Vista.
.NET Framework 2.0 and .NET Framework 3.0 components
Windows PowerShell.
Microsoft Visual Studio 2005 Tools for Office Second Edition Runtime (VSTO 2005 SE) and Microsoft Office Word 2003 or Word 2007. (These are optional to edit company knowledge.)
The Operations console application files installed on the local disk of the computer will total about 150MB, placed in the %ProgramFiles%System Center Operations Manager 2007 folder by default. Here is a step-by-step list of actions related to getting the Operations console running on a computer:
Run the SetupOM.exe application located in the root of the OpsMgr installation media.
At the splash screen, select to Install Operations Manager 2007 as if you were going to install another management server or a new management group.
When presented with the Custom Setup dialog box, change the install action to This component will not be available for the Database, Management Server, and Web Console items, leaving only the User Interfaces and Command Shell items selected. Figure 8.26 displays the setup options to install only the Operations console as part of Custom Setup.
If the computer you are installing the console on does not meet all necessary prerequisites, you will see a Prerequisite Check Passed with Warnings or a Prerequisite Check Failed notice. These notification dialog boxes include View Log buttons that display details for prerequisites not met. For example, Figure 8.27 lists the prerequisites for installing the Operations console and notes a warning that the computer we are installing the console on has less than the recommended 2048MB (2GB) of physical memory.


Upon completing a successful installation, the default action is to open the Operations console for the first time on that computer. Here are some points to keep in mind:
The first time you open the Operations console on a computer that is not an OpsMgr management server, you will see a Connect to Server dialog box, and you must enter the name of the OpsMgr management group and the name of the RMS for that management group. The console connects to the RMS and attempts to authenticate the user logged on at the computer where the console is running. (You saw the Connect to Server applet previously in Chapter 3, “Looking Inside OpsMgr.”)
If the RMS is not in the same Active Directory domain as the computer running the console, the Enter Credentials dialog box appears, as shown in Figure 8.28. Remember to add domain user accounts that are not members of the OpsMgr Administrators group to appropriate OpsMgr user roles before connecting to a management group. Add user accounts or groups to roles prior to using the Operations console’s Administration space or equivalent PowerShell commands.

The console’s Connect to Server applet remembers the identity of the RMS first connected to, and it will not prompt you again for the name of a management group. By default, the console connects to the RMS it last connected to. To change the focus of the Operations console to another management group, select the Tools -> Connect... item from the console’s main menu bar. This invokes the Connect to Server applet, where you can enter the information for another OpsMgr management group. Connecting to another management group adds an entry to the Registered Servers list remembered by the Connect to Server applet, and it changes the default connection to the last management group selected.
The Enter Credentials dialog box does not remember domain user logon information, and it only displays the local computer and the domains it is a member of as choices in the Domain drop-down selection list. The console will prompt for user credentials authorized to access the Operations console in the domain where the OpsMgr RMS is located. When accessing OpsMgr management groups in domains that do not trust the domain where the Operations console is located, you must manually supply appropriate user credentials and domain names on each use of the console.
There is no theoretical upper limit on the number of Operations consoles installed in a single management group. Install the console wherever it makes work more convenient and efficient for the operations staff. However, each console that is open creates several network connections and causes the RMS to open a connection to the operational database on behalf of the console. This means that consoles are not inconsequential in terms of their impact on the network and the OpsMgr management group.
Microsoft suggests that you not plan for more than 30 simultaneous Operations console sessions in one management group. We recommend you close any console sessions when not in active use.
If you installed Microsoft Office Word 2003 or Word 2007 as well as the Microsoft Visual Studio 2005 Tools for Office Second Edition (VSTO 2005 SE) redistributable package on the computer where the console is running, you will be able to edit the company knowledge associated with a rule. Without the software installed, an operator will simply have read-only access to view company knowledge.
Tip: Visual Studio Tools for Office (VSTO) Second Edition
VSTO 2005 Second Edition is the fully backward compatible replacement for the Visual Studio Tools for Office runtime that was available with VSTO 2005. It contains updates that allow applications authored using VSTO 2005 (such as the OpsMgr 2007 Company Knowledge function) to run with either Office 2003 or Office 2007 installed. Microsoft has withdrawn the original VSTO 2005 for download.
Errors may occur when using the console, and OpsMgr provides a way to learn more about console errors that occur and share the details of the errors with other staff and support personnel. When an error occurs, the user receives a notice like that in the top portion of Figure 8.29. This is an abbreviated statement of the error, which may not provide much useful information. Clicking the item Show additional information about this error expands the notice window and includes the text of the error, shown in the lower portion of Figure 8.29.

The additional information (exposed in the lower portion of Figure 8.29) includes a header warning that the information may appear cryptic. As an example, the additional information might include a complete server stack trace and be pretty lengthy. In this case, there is some useful information in the details, specifically that the RMS the console is trying to connect to actively refused the connection.
Notice also in the lower portion of Figure 8.29 (the expanded version of the error notification window) that there is a Copy to clipboard item below the Close button. This saves time and increases accuracy when communicating about errors with others. When you select this item, details about the error, exposed in the additional information view, are copied to the clipboard as text, ready to paste into an email or trouble log. The heading about the information appearing cryptic is replaced with a date/time stamp and the name of the OpsMgr product and version, displayed in Figure 8.30.

Another potential issue exists if you invoke the Operations console in a user context without trusted authentication between the core components of the management group and the user running the console. This issue appears when PowerShell launches against an object in the Operations console (for example, by right-clicking the object and selecting Open -> Command Shell). Although the user provides credentials when starting the Operations console, those credentials are not passed to PowerShell when it is invoked from the console.
As an example, if you check the health state of the OpsMgr Management Group distributed application using PowerShell (as we did in Figure 8.9 in the “Confirming Management Group Health” section of this chapter) without a domain trust in place, you now receive another credentials prompt like that shown in Figure 8.31.

The Windows PowerShell Credential Request box remembers the domain name and user combinations of previous connections in the drop-down list, but there is no option to save the associated passwords. So, similar to the manual credential entry needed to start the Operations console without trust authentication, a manual credential entry is required on each launch of PowerShell in that untrusted environment.
In this case, we specifically mean that the user account logged in to the Windows desktop session (where the Operations console is running) must match a domain user account included in an authorized user role in the OpsMgr management group. Passthrough authentication does not work in this instance. If the user does not log on to the local computer with a matching domain account, there will be frequent prompts for credentials!
The Operations console stores configuration data locally and in the Operations database. Customizations to the My Workspace portion of the console are stored in the database, and they follow the user from console to console, similar to a Windows roaming profile. This feature lets a user leverage the time spent creating favorite views and saved searches across all consoles in a management group. Most other console settings are locally stored in the user Registry key HKEY_CURRENT_USERSOFTWAREMicrosoftMicrosoft Operations Manager3.0 (and will apply only to the user on that computer).
For example, you can increase the number of computers that can be selected at once when executing the same task against multiple targets. The default is 10, and in some scenarios you might want to select 20, or even 50 computers at once for task execution. Modify the DWORD value at HKCUSOFTWAREMicrosoftMicrosoft Operations Manager3.0ConsoleTaskSelectedObjectsLimit.
Other console settings saved in the current logged on user’s Registry key (only affecting the console for that user on that computer) include the following:
Connection history with the names of management groups the console has connected to.
Show or Hide Views selections.
Whether the console is in a window or full screen, and if it’s in a window, what the size and position of the window is.
What the last navigation pane the console was open to when it was closed.
The next time that user uses the console on that computer, it reopens with the same settings. The console always reopens with its focus on the root of the hierarchy of the selected navigation pane, such as the Monitoring Overview if the Monitoring pane was in use, or the Administration Overview if the Administration space was open the last time you used the console.
Whatever child monitoring views were expanded during the last console use are also remembered. Therefore, although the console will always open to the root of the navigation hierarchy, if you have a carefully selected set of view folders that you keep open, the console saves you time by remembering those settings. The console also remembers what performance counters you have previously selected in particular performance views—another major timesaver!
Much of this book provides you with detailed assistance in the setup and configuration of the numerous features of OpsMgr 2007. How you actually use the Operations Manager application to accomplish your organizational objectives is where your creativity and experience comes in. You build on a solid understanding of what OpsMgr can do, and you add the deep “insider” knowledge of your organization’s technology processes.
There is no one right way to use OpsMgr; in fact, a strength of a product with such a broad feature set is that you have a lot of latitude in how to operate it and still get great value from it. We assume that prior to deploying Operations Manager 2007, you had in mind general answers to such questions as the following:
What do I want to monitor? You might consider servers, desktops, and mobile computers, network devices such as routers, and applications such as third-party websites that users depend on to perform the organization’s work. The small business owner might want to monitor “everything,” whereas the large enterprise might deploy OpsMgr just to monitor some portions of their infrastructure.
How can I measure success? In a small environment, it could be that if your boss is happy with his or her use of the network, you’re doing fine. As OpsMgr deployments get bigger, the measure of success often becomes the percentage of application uptime, with “5-9’s” or 99.999% application availability considered the highest service level to contract for in a Service Level Agreement (SLA).
How am I going to interact with OpsMgr? Depending on how you deployed your management group, and what your success measurements are, envision various levels of constant, daily, or periodic use of the Operations console. In larger environments, team solutions for cooperatively configuring and using the Operations console are called for.
In this last part of the chapter, we focus on the Operations console, highlighting features of the various panes, wizards, and dialog boxes that we think are of value when using OpsMgr 2007. We will approach some suggested configurations of features from the perspectives of both the small system administrator and the enterprise management professional.
The Operations console has five major navigation panes, which are also called spaces. Table 8.2 lists these panes and gives a brief description of each pane.
Table 8.2. Navigation Panes in the Operations Console
Navigation Pane | Description |
|---|---|
Monitoring | Displays different types of views that enable analyzing your monitoring needs. |
Authoring | Lets you to create additional monitoring objects to customize or supplement the default monitoring settings provided with management packs. |
Administration | Enables editing Operations Manager settings that affect the management group. Also allows you to view and configure individual management servers and managed objects. |
Reporting | Displays reports included in installed management packs and enables editing customized reports. |
My Workspace | Enables creating and storing console customizations for later reuse. |
We will discuss each of these console areas in the following sections.
The Monitoring space displays different aspects of monitoring data, enabling you, through tracking and resolving issues, to quickly find and analyze the monitoring results within your environment. The Monitoring pane’s goal, when there are no problems, is to validate the continuing successful function of the OpsMgr instrumentation. When there is an issue with an object you are managing, the Monitoring pane’s purpose is to clearly present a statement of the problem (and even propose to take suggested repair actions), or make it as easy and quick as possible for you to locate the root cause and achieve resolution.
You can start using the Operations console to monitor your environment “out of the box” (that is, with the default views in their default configurations). However, you can get a lot more value from OpsMgr by customizing the look and feel of the Operations console to match the business and technological aspects of your organization. The most effective use of the Monitoring space is a combination of configuration decisions involving these features:
Personalizing the global views and other default views
Creating new global views and views in child view folders
Creating new child view folders or hierarchies of view folders
Creating new tasks, specific for your environment, that automate actions related to the object(s) selected in console views
In a team-managed setting, it is important for all participants to collaborate on, and have input to, modifications that affect everyone. In addition, it is critical to communicate what features have been customized or added, because people cannot use new features they do not know about. We will walk though some real-world examples of using these techniques to make the Operations console more useful.
To start, we will personalize the properties of the Computers global view. We navigate there by clicking the Computers node in the Navigation pane of the Monitoring space. When we see the names of our managed computers in the Results pane, we select the Personalize view action from the Actions pane on the right side of the console. You can also access Personalize view from a context-sensitive menu by right-clicking the header (or any row) of the Results pane, or by selecting View -> Personalize view from the OpsMgr window menu. Figure 8.32 shows that, by default, only the Maintenance Mode and Name columns are displayed.
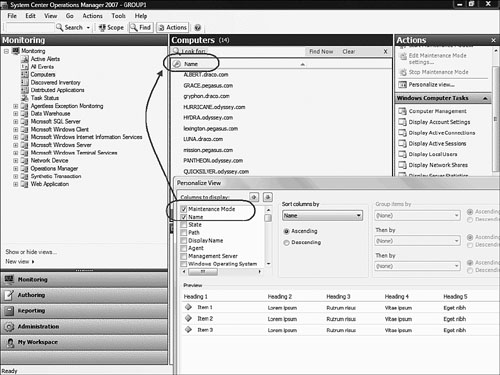
The blank slate listing of alphabetically sorted names of managed computers and their management mode status really invites customizing to match your monitoring interests. The default view does not even include the health state of the computer! We will select to display additional information: the columns for State, NetBIOS Domain Name, and Virtual Machine. We’ll also select to sort by NetBIOS Domain Name. Figure 8.33 shows the results pane of the Computer view after we’ve added those columns.
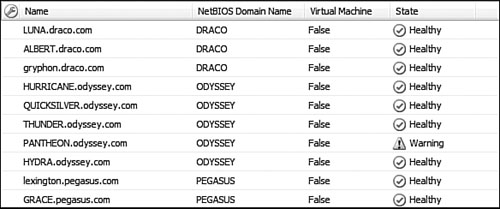
The Computers view with just these few changes, shown in Figure 8.33, has a lot more useful information.
We elected to view the domain name and the virtual server status because those are important considerations for our organization, particularly because we have computers in multiple domains. An administrator in a single large domain might add columns such as Active Directory Site and Organizational Unit instead. Adding columns to the display lets you quickly sort and group computers by that attribute. In our case, we want to be able also to sort by State, bringing the critical computers to the top, and then view what domain they are in and whether or not they are virtual servers.
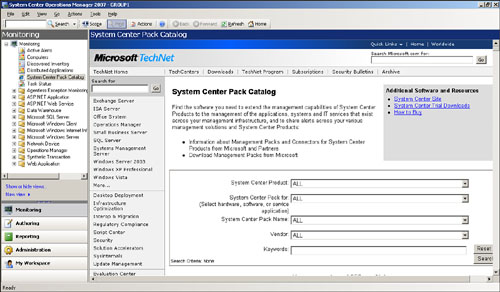
Operations Manager 2007 includes a simple but invaluable feature to embed any relevant web content right in the Operations console. We will demonstrate this by creating a global view using the Web Page view type. We right-click the Monitoring space and select New -> Web Page View. In the simple setup dialog box, we enter the information shown in Figure 8.34 to link to the online System Center Pack Catalog at Microsoft’s website.

After we create the Web Page view with the settings shown in Figure 8.34, we find a new custom global view named “System Center Pack Catalog” in the Operations console. Clicking this view opens the website at Microsoft in the Results pane, as shown in Figure 8.35. You can image the many possibilities for integrating the OpsMgr console with your intranet, partner extranets, vendor support sites, and other network management applications.
The Web Page view is added to your OpsMgr monitoring toolkit along with the other views we have seen, such as the Alert, Event, State, Performance, and Diagram views. You can combine any of these view types to create custom, functional dashboards that intermingle the content of any view in the management group. In a fashion similar to how OpsMgr’s distributed applications allow you to combine monitoring of disparate objects into a single entity, dashboard views enable you to merge visual instrumentation elements from anywhere in your OpsMgr monitoring space into one view.
Management packs add many dashboard views to the console; as an example, all the performance and health monitoring views in the Windows Server management pack are dashboard views. Next, we will create a dashboard view that combines several other types of views. Perform the following steps:
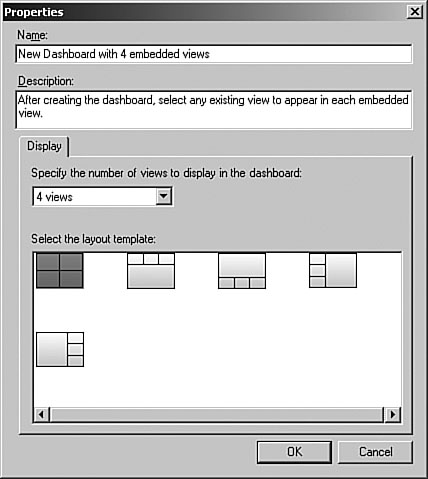
Right-click the Monitoring space and select New -> Dashboard View. Figure 8.36 shows the Properties page that appears to configure the new view.
We are going to create a new dashboard view with four embedded views. You can create new dashboard views with between two and nine embedded views, and a variety of arrangements for each, based on the possible geometry of the selected quantity of embedded views.
Select the quadrant view (four equal sections) and save the view with the name Management Group Hardware. We are going to add embedded views that focus on the health of the hardware in our management group.
Immediately after saving the new dashboard view, navigate to that view to see the layout design we selected (in this case, the four quadrants). Also, notice the Click to add a view link in the center of each empty embedded view. Clicking that link pops up a Select View list, where you can pick any type of existing view in your management group to appear in the dashboard embedded view.
In our Management Group Hardware dashboard view, shown in Figure 8.37, we have added four different kinds of views. We have a State view in the upper left, a Performance view in the lower left, a Diagram view in the lower right, and in the upper right, a Web Page view.

In the embedded Web Page view, we have extended our OpsMgr console view to include a live view into a dashboard from another management application, the web-based HP Systems Insight Manager. After you have added the desired embedded views to your dashboard, you can later swap out an embedded view by right-clicking its header and selecting Remove View.
Access to the maintenance mode status (the wrench icon) appears throughout the OpsMgr monitoring space. This makes it easy to quickly view or update the maintenance mode state for an object. Maintenance mode enables you to avoid alerts or errors that might occur when a monitored object, such as a computer or distributed application, goes offline for maintenance. In a small environment with just a single administrator, this feature might not get used that often. However, in a large environment, maintenance mode is a key mechanism to permit team collaboration.
Figure 8.38 shows the Diagram view of a distributed application created to monitor an enterprise backup solution. The diagram illustrates a backup media server, passing through a pair of network switches, connecting to a pair of tape libraries. The Tape Libraries entity is a distributed application component we created that includes the two physical tape libraries as contained objects. We placed the parent entity in maintenance mode and selected to propagate those settings to contained objects, because the repair work we will be doing affects both tape libraries equally. Notice the wrench icon present, the empty unmonitored circle (rather than a check mark) next to the Tape Library component, and the contained tape library objects.

We noted in the Duration field of the maintenance mode settings that we expect the work to be complete at 5:00 p.m. At that time, all three objects (the Tape Libraries entity and the contained tape library objects) will come back out of maintenance mode, and monitoring will resume on all components. OpsMgr 2007 polls maintenance mode settings only once every 5 minutes, so there can be a delay in an object’s scheduled removal from maintenance mode.
Tip: Automating the Maintenance Mode Process
We wrote a management pack for MOM 2005 that you could use to put a system into maintenance mode. For OpsMgr 2007, Boris Yanushpolsky of the MOM team provides a PowerShell script that puts a system into maintenance mode. The script uses parameters including the computer name (FQDN), number of hours to be in maintenance mode, and a comment. The script also puts the instances of the HealthService and HealthServiceWatcher associated with the computer object into maintenance mode, to prevent an alert that the management server is not getting heartbeats from that agent.
The script is available at http://blogs.msdn.com/boris_yanushpolsky/archive/2007/07/25/putting-a-computer-into-maintenance-mode.aspx. There is also a script to take the computer out of maintenance mode at http://blogs.msdn.com/boris_yanushpolsky/archive/2007/08/30/stoping-maintenance-mode.aspx.
For your convenience, we include these scripts (maintenance mode.ps1 and stop maintenance mode.ps1) with the CD accompanying this book.
Clive Eastwood has written a command line tool to put OpsMgr agents into maintenance mode, similar to what Boris does in PowerShell. You can read about this approach at http://blogs.technet.com/cliveeastwood/archive/2007/09/18/agentmma-command-line-tool-to-place-opsmgr-agents-into-maintenance-mode.aspx.
Andrzej Lipka of Microsoft Consulting Services (MCS) enhances this using the PsExec tool from SysInternals. PsExec (see http://technet.microsoft.com/en-us/sysinternals/bb897553.aspx) lets you execute processes on other systems. Andrzej describes how to put the two together at http://blogs.technet.com/alipka/archive/2007/12/20/opsmgr-2007-putting-computers-in-maintenance-mode-remotely.aspx. We include these URLs as live links in Appendix E on the CD.
By default, the Operations console can only put 50 objects into maintenance at any one time. To adjust the amount of objects that can be selected and put into maintenance, modify the following Registry value: HKCUSOFTWAREMicrosoftMicrosoft Operations Manager3.0ConsoleConsoleUserSettingsMaxItemsForMaintenanceMode.
The Health Explorer is a very important feature in OpsMgr 2007. It is so useful in assessing the true operational state of an object that we nominate it as the “top tool” on the OpsMgr workbench! Earlier in this book, in Chapter 3, we explained how the Health Explorer is bound to the Service Modeling Language (SML) used by OpsMgr management pack developers that architect health models. When you have an object’s Health Explorer open, you are really looking into the brain of that monitor, with lots of accessory tools available to help you explore further.
When you see an object in the Operations console that is not healthy, the quickest way to answer the question “What’s wrong?” (and even possibly to fix what’s wrong) is to right-click the object and select Open -> Health Explorer. In our management group, the computer Gryphon is in a critical state, so we open that object’s Health Explorer in Figure 8.39.
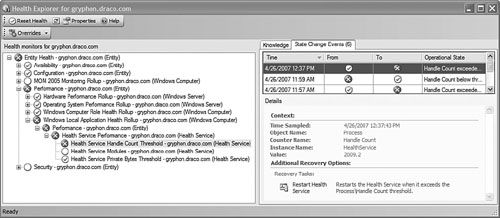
As we walk down the health model of Gryphon in the Health Explorer shown in Figure 8.39, we see the problem is in the computer’s performance, specifically that the threshold for a handle count was exceeded. This indicates a possible problem with memory on the computer.
The Health Explorer exposes and provides access to many other features of OpsMgr. For example, the upper portion of the Explorer has controls to reset the health state, view the detailed properties of a monitor, and apply an override for any selected monitor. Using the Overrides control, you can also view any other managed objects in your OpsMgr management group that have overrides for that monitor.
On the State Change Events tab on the right side of the Health Explorer, you can always see a chronological history of state change events for that object, as well as the context for the event that caused the state to be changed. Additionally, if the management pack author has included them, you may find suggested recovery tasks available to run in the Additional Recovery Options area. In our example in Figure 8.39, see the recovery task Restart Health Service, which you can select to run. We can infer, from the presence of this recovery task, that the management pack author’s experience indicates this recovery task may fix the memory-related handle count threshold error.
The Authoring space of the Operations console is where the OpsMgr administrator is truly unleashed. In the Authoring space, you perform actions related to management pack components, such as creating additional monitors, attributes, groups, and rules to customize or supplement the default monitoring settings. In addition to working with previously installed management packs, you can create new management packs and distributed applications based on templates. An additional function of the Authoring space is creating and modifying OpsMgr groups.
Management pack templates and the Add Monitoring Wizard are used to create and target custom object types, enabling you to extend the management capabilities of OpsMgr 2007. To create a new management pack from a template, you can right-click the Management Pack Template node and select Add monitoring wizard. Alternatively, you click the Add monitoring wizard shortcut in the lower portion of the Navigation pane.
OpsMgr 2007 provides templates for similar object types to help make it easier to create custom objects with the Add Monitoring Wizard. Management pack templates are conceptually comparable to Microsoft Word templates, which make it easier to create similar Word document types. Operations Manager provides the following default templates:
OLE DB Data Source—. Generates synthetic transactions that monitor the availability of databases
TCP Port—. Generates synthetic transactions that monitor the availability of services
Web Application—. Generates monitors that verify the availability of web-based applications
Windows Service—. Generates monitors and rules that verify the availability of a Windows service
A distributed application service monitors the health of a distributed application that you define. It creates the monitors, rules, views, and reports necessary to monitor your distributed application and the individual components it contains. When creating a distributed application in OpsMgr 2007, you first create the service that defines the distributed application monitoring object at a high level. Next, use the Distributed Application Designer to define the individual components that are part of the distributed application you want to monitor. We cover using the Distributed Application Designer in detail in Chapter 19, “Managing a Distributed Environment.”
To create a new distributed application service and invoke the Distributed Application Designer, right-click the Distributed Applications node and select Create a new distributed application. You can also click the New distributed application shortcut in the lower portion of the Navigation pane. Templates are available for the following categories of distributed applications:
Messaging (such as Microsoft Exchange)
Terminal Services Farm
Windows Explorer Data Source Service (Explorer clients accessing physical resources via data source directories)
Windows Internet Explorer Service (Internet Explorer clients getting to resources using Proxy services)
Operations Manager 2007 groups can delegate authority, scope access to specific areas of the Operations console, and override the default settings of management packs. To create a new group, right-click the Groups node and select Create a New Group, or click the New group shortcut in the lower portion of the Navigation pane. This invokes the Create New Group Wizard, which walks you through these five steps:
General Properties—Assign a name and description, and select the unsealed management pack to save the new group. You can also create a new management pack for this purpose if desired.
This is the only mandatory page of the wizard; the remaining four steps are optional. However, if you do not enter anything on one or more of the remaining steps, no objects will be members of the group.
Explicit Group Membership—Here you can choose specific objects that will be members of the group. An Add/Remove Objects button opens an Object Selection page where you can locate and select any existing object in the management group.
Dynamic Members—This is where you will normally enter information in the wizard. As a best practice, you want your groups to automatically populate with objects of the type you are interested in, rather than depend on manual population of the group using the explicit group membership step. A Create/Edit Rule button opens a Query Builder where you select the desired object class and build a formula. Discovered objects with attributes that match the formula’s criteria automatically become members of the group.
Subgroups—Here you can choose subgroups to add to the group. An Add/Remove Subgroups button opens an Object Selection page where you can select any existing groups in the management group to include as subgroups.
Excluded Members—This is the opposite of step 2, the Explicit Group Membership screen. Just as in that step, an Add/Remove Objects button opens an Object Selection page where you can locate and select any existing object in the management group. Selected objects will not be members of the group, even if included by one of the other methods, such as dynamic or subgroup membership.
Tip: What’s in My Groups?
Boris Yanushpolsky has developed a PowerShell script that retrieves groups and lists the contents of each group as well as the types of objects contained in that group. Boris’s utility is described at http://blogs.msdn.com/boris_yanushpolsky/archive/2007/10/27/what-s-in-my-groups.aspx. For your convenience, we include his EnumerateGroupsAndMembers.ps1 file on the CD accompanying this book.
Use the Management Packs Objects node, in the Authoring pane of the Operations console, to create objects that define how monitoring will be performed in your management group. You can view existing attributes, monitors, object discoveries, rules, tasks, and views by clicking the appropriate leaf object under the Management Pack Objects node. You can also create new attributes, monitors, rules, and tasks from each corresponding leaf object. Here is a description of each leaf object and its purpose:
Attributes—. Displays a list of attributes for each object type in your management group. Attributes consist of either Windows Registry or Windows Management Instrumentation (WMI) queries. You can also create new attributes for use by discovery rules and dynamic group membership criteria. After you create an attribute, you can create a group whose members are only objects that have the commonality described in your attribute.
For example, if you want to monitor a set of servers that all have a common Registry value, you create an attribute based on that Registry value. To find the servers that have that Registry value, you create a group that has a dynamic inclusion rule for only those servers that have the newly created attribute and target the group only to the server object type. Operations Manager then checks the Registry of each server to see whether that Registry value exists. If it exists, the server is added as a member of the group.
Figure 8.40 shows the second and final pages of the Create Attribute Wizard. We are creating a custom attribute that checks for the existence of a Registry key on Windows 2003 computers. In this particular case, we are checking whether Windows Update is configured for automatic updating. We could use this attribute to define a group of Windows 2003 computers participating in automatic updates.
Monitors—. Displays a list of monitors sorted by object type. Monitors continually assess the condition of specified objects. Based on this assessment, a monitor can also generate alerts and change the health state of an object.
In Operations Manager 2007, you can use monitors to assess various conditions that can occur in monitored objects. For example, a monitor can assess the values of a performance counter, the existence of an event, the occurrence of data in a log file, the status of a Windows Service, or the occurrence of a Simple Network Management Protocol (SNMP) trap. The result of this assessment determines the health state of a target and the alerts generated. The three types of monitors for these assessments are unit monitors, aggregate rollup monitors, and dependency rollup monitors. Chapter 3 explains these in detail, and Chapter 14 “Monitoring with Operations Manager,” discusses how to create and use these monitors.
Tip: Avoid Creating Unnecessary Attributes
There is no feature in the Operations console to delete attributes after they are created, so it is not a good idea to create attributes unless you know you are going to use them. (To remove an attribute, you must export the management pack, delete the attribute in the XML file, and reimport the management pack.)
If you create an attribute by mistake, it will have no effect on your management group; just don’t associate the bogus attribute with other, valid management pack objects. You can also disable attributes by disabling the corresponding discovery rule in the Object Discoveries node.
Object Discoveries—. Displays a list of discovery objects currently in use in your management group. A discovery dynamically finds objects on your network that you want to monitor. You can right-click any of the object discoveries listed in the results pane to view its properties or to override it. You would override an object discovery if it would find objects on your network that you do not want to monitor.
You cannot create object discoveries from the Authoring pane. Because management pack developers do not know the specific objects that are in your network environment, they define only the type of objects that their management pack monitors. However, the developers also include discovery objects so that, after the management pack is imported, the object discoveries find the specific objects on your network that are of the types monitored by the management pack.
Rules—. Displays a list of rules sorted by object type. Rules collect data, such as event information, generated by managed objects. Use rules instead of monitors to generate alerts when the data collected from managed objects does not indicate the health state of the managed objects.
An example of a rule’s functionality is the collection of a specific event from the Application Event log of Windows-based computers. The collected event is stored in the Operational and/or Data Warehouse databases of the management group, where you can analyze it in views and reports.
Rules can also be overridden or disabled. Select the rule in the Results pane, right-click it, and select Overrides -> Override the Rule (or Overrides -> Disable the Rule). An overrides summary for a particular rule is also available to select when you right-click a rule.
Tasks—. Lists the tasks that are available within your management group, sorted by object type. Tasks are predefined actions that run against a monitored object. Tasks are accessible to view, modify, or delete in the Authoring pane of the Operations console. When you create a task, you can choose to create an agent task or a console task. Agent tasks can run remotely on an agent or a management server. Console tasks can run only on the local computer. In OpsMgr 2007, a batch file or script can run as a task remotely or locally; however, if an alert or event generates the task, the task must run locally.
You can also create new tasks by running the Create a new task action. Table 8.3 lists the task types you can create.
Table 8.3. Tasks You Can Create
Type
Description
Command line
Runs a batch file or starts an application on an agent or management server. You can run this task locally or remotely.
Run a script
Runs a script on an agent or management server.
Alert command line
Runs a task automatically when a specified alert (or alerts) is generated. Specify the alert by using the Parameters drop-down list in the Command Line wizard page of the Create Task Wizard. This task must run locally.
Event command line
Runs a task automatically when a specified event (or events) is generated. Specify the event by using the Parameters drop-down list in the Command Line wizard page of the Create Task Wizard. This task must run locally.
Views—. Displays a list of available views in the management group. Views display a particular aspect of monitoring settings. When you select a view, a query is sent to the operational database. The results of the query are displayed in the Results pane in the Monitoring space.
You cannot create views from the Authoring space. You can only examine the properties of views in the Authoring space. Views are created in the Monitoring space, so this list of views in the Authoring space is a convenient summary.

The Administration space enables you to edit high-level OpsMgr settings that affect the security and configuration of the entire management group. You can also view and configure individual management servers and managed objects. The Administration space is only displayed when the user running the console is a member of the OpsMgr Administrators security group. The Administration space presents controls for various major OpsMgr functions that are highly sensitive to the integrity of the management group. Seven nodes appear in the Administration space, and we will drill down into each of them.
The following five leaf objects in the Device Management node allow you to perform post-installation configuration of specific Management Servers, agent-managed computers, agentless managed computers, and network devices:
Management Servers—. Displays all the management servers installed in your management group. Select the properties of a management server to override global management server defaults such as the heartbeat failure and manual agent install settings. The RMS for the management group is identified by a Yes in the Root Management Server column. The Configure Client Monitoring action is available to begin collecting error information from managed computers. Chapter 16, “Client Monitoring,” includes detailed procedures for configuring client monitoring.
Agent-Managed—. Shows all computers with installed agents. The agents are grouped under the management server that the agent reports to. Actions are provided to repair or uninstall an agent. You can also pivot to the Event, Alert, Performance, Diagram, or State view for an agent-managed computer by right-clicking the computer name and selecting Open. Select the properties of an agent-managed computer to override global heartbeat failure and security settings.
Agentless Managed—. Displays all agentless managed computers, under the proxy agent that monitors them remotely. You can change the proxy agent for a particular agentless managed computer, and delete an agentless managed computer from the management group.
Network Devices—. Displays all discovered network devices, under the proxy agent that monitors them remotely. You can also delete discovered network devices here using the Delete action.
Pending Management—. Allows you to select to approve or reject manual agent installations that are awaiting approval to join the management group. The default setting in a management group will automatically reject manually installed agents, so unless you have modified that setting from Administration -> Settings -> Server -> Security menu, no computers will appear in the Pending Management node.
Nine management group settings are exposed at this node, organized under the Agent, General, and Server headings. These are global settings because they control the behavior of the entire management group.
Agent—. The only setting here to modify is the global heartbeat interval. Agents generate heartbeats at specific intervals to ensure they are functioning properly. The default heartbeat interval is 60 seconds.
General—. You’ll find six settings under this heading:
Alerts—. Here you can add new alert resolution states and modify the auto-resolution intervals. You can create up to 254 custom resolution states; it’s a great idea to expand on the two built-in states (Closed and New). We suggest at least adding the new resolution states of Acknowledged and Assigned to help manage alerts. The default auto-resolve settings are used to resolve active alerts in the New state after 30 days and active alerts when the alert source is healthy after 7 days.
Database Grooming—. The OpsMgr grooming process removes unnecessary data from the database in order to maintain performance. The default setting is to purge all resolved alerts as well as all event and performance data after 7 days. Grooming is discussed in Chapter 12, “Backup and Recovery.”
Notification—. Enables configuration of email, instant messaging, Short Message Service (SMS), and command-line notification channels. Later in this section, we discuss setting up notification recipients and subscriptions at the Notifications node of the Administration pane. Those notifications depend on the setup of the Notification settings here at the Settings node. Before you can configure actual notification recipients and subscriptions, you need to enable the notification channels here.
Privacy—. Provides the procedures to configure what Customer Experience Improvement Program (CEIP) information, error reports, and solution responses are transmitted and received from Microsoft. We recommend enabling at least the CEIP and operational data reporting options; these do not impact the operation of the management group or its users, and they provide anonymous data to Microsoft that helps improve the quality of the OpsMgr product.
Reporting—. This setting lets you modify the Uniform Resource Locator (URL) path to the reporting server. The default is http://<ReportingServername>:80/ReportServer. You would only modify this setting if you changed the identity of the reporting server in your management group or the composition of the URL, such as enabling SSL.
Web Addresses—. If you have installed the OpsMgr Web console in your management group, you can put the URL to the Web console here. Whatever URL you enter here will appear in notifications as a link for the recipient to follow to the Web console for more information about the alert that caused the notification. A default installation of the Web console would indicate a URL setting of http://<WebConsoleServername>:51908/default.aspx.
Tip: Web Console Error—Requested Value UrlViewType Not Found
If you try to access a Web Page view in the Web console, you will receive a Requested Value ‘UrlViewType’ not found error. This occurs because the URL view type is not supported in the Web console. A hotfix is available, with additional information, at http://support.microsoft.com/kb/935898. The hotfix is incorporated into OpsMgr 2007 Service Pack 1.
Server—. The two settings here are Heartbeat and Security. We describe the security setting in the “Device Management” section of this chapter; the Security setting determines how manually installed agents are handled. These agents can be automatically rejected or accepted, or placed in the Pending Management node where an administrator must approve them.
The heartbeat setting is the number of consecutive missed heartbeats from an agent before OpsMgr initiates a loss of heartbeat alert; the default is 3. Therefore, the default settings of OpsMgr will fire an alert on a down agent after about 3 minutes, which is the server missed heartbeat setting multiplied by the agent heartbeat interval.
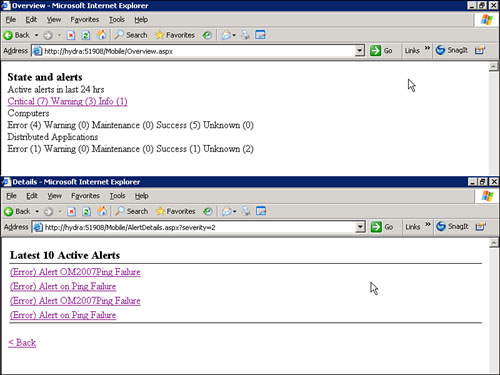
Chapter 11 discusses the creation and management of user roles and Run As Accounts and Profiles in detail. Here is a summary of the functions located at the Security node of the Administration pane:
User Roles—. Displays all existing user roles. You can create new user roles of the following types: Read-only Operator, Operator, Advanced Operator, and Author.
Run As Accounts—. Displays all Action accounts and Run As Accounts. You can create new Run As Accounts from the navigation menu (right-click any node in the Navigation pane of the Administration space and select Create Run As Account).
Run As Profiles—. Displays the Run As Profiles used by workflows to run under specific identities. Open the properties page for a selected Run As Profile, and on the Run As Accounts tab, you can select existing Run As Accounts to associate with that Run As Profile.
At the Management Pack node of the Administration space, you can view a list of all the management packs that exist in your management group—both sealed and unsealed management packs that you imported, and unsealed management packs that you created. You can create new unsealed management packs as well as import sealed and unsealed management packs from vendors and other OpsMgr community professionals. There is also an export management pack function; use this to create an unsealed management pack copy in a file system location of your selection. Exported management packs can be stored for backup purposes, imported into other management groups, and exchanged with other OpsMgr community professionals.
When you create a new management pack, a corresponding view folder is created in the Monitoring space. By viewing the properties of a management pack here, you can see the same management pack dependencies information exposed by the Import Management Pack Wizard when importing new management packs.
OpsMgr 2007 can send a notification to operators when an alert occurs, in case the operator is not watching the Operations console at that moment. Three steps are required to enable external notification to an operator. As we noted previously in this section, when describing the Settings -> General -> Notification feature, you must create notification channels before proceeding to create recipients and subscriptions. That is the first step to enable notifications. Perform the remaining two steps here at the Notifications node of the Administration pane:
Recipients—A notification recipient defines when and from what devices OpsMgr can send notifications. When you create a new notification recipient, you select a notification channel (such as email) and associate a delivery address (such as an email address) to create the recipient. You can optionally create a schedule to indicate days and times to generate notifications.
Subscriptions—The final configuration step to enable notification services is associating a recipient with categories of alerts; this is a subscription. Remember that a subscriber can be an individual user account or a distribution list. When you create a subscription, it invokes the Notification Subscription Properties Wizard. The wizard guides you through the steps that create the subscription: Optionally filter notifications by user role; select the groups, classes, and alert criteria to notify subscribers about; optionally use alert aging as a notification criteria; and indicate whether modifications to the default notification messages are desired for that subscriber.
Tip: Details on Setting Up Notifications
You may want to check the Operations Manager 2007 Operations Guide for additional information about setting up and configuring notifications. We discuss the process in Chapter 14 as well.
A connected management group provides the capability for the Operations console user interface in one management group to query data from another management group. You can add the connection information for a connected management group here. That information is the management group name, the FQDN of the RMS, and the credentials to use to connect to the other RMS. The default credentials are those of the SDK service account of the local management group.
OpsMgr 2007 supports the ability to synchronize alert data with other applications, such as other management systems, using product connectors. Product connectors subscribe to alerts and forward them to other products. OpsMgr comes with one product connector installed, the MOM Internal Connector. OpsMgr components use the MOM Internal Connector to insert discovery data. You should ignore this entry in your product connector list. If you install other product connecters developed by third parties, they will appear in the product connector list. The properties page of a product connector has a subscriptions area where you would configure the connected product to receive forwarded alerts as desired.
Reporting in OpsMgr 2007 refers to the process of storing, retrieving, and presenting historical data stored in the Data Warehouse database. You can access data from OpsMgr reporting in three main fashions:
Targeted reports
Generic reports
Scheduled reports
All three categories of reports yield the same reporting products; what differs is the method in which the report criteria is assembled. The Reporting space in the Operations console can save reports you author, save your favorite reports, and schedule reports. We discuss the report types in the next sections of this chapter.
The most common way to use OpsMgr Reporting is the targeted report method. With this method, you access the report from the Monitoring space, select the object you want report data for, and click one of the reports displayed in the Actions area on the right side of the Monitoring space.
This launches the report view, with the object of interest prepopulating the object list in the report parameters. Figure 8.42 shows a report on the memory performance of the Hydra computer for the last week. It also shows a performance report, which is generated by selecting to view the parameters of the report (View -> Parameters from the report view).
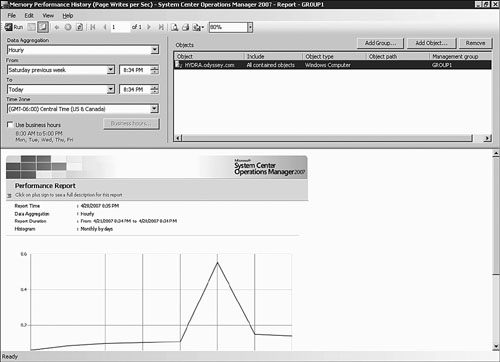
In Figure 8.42, the performance report graph in the lower portion is the report itself, and the parameters header in the upper portion includes the criteria used to generate the report. (For this figure, we scaled the graph to 80% of its actual size to fit it in the screenshot along with the parameters header.) We call this a targeted report because we invoked the reporting view in the context of the Windows Server 2003 Monitoring view with a particular computer selected. It just took a few mouse clicks to generate the report, and we did not need to know details about the report’s construction, such as the fact that memory performance history is part of the Window Computer object class.

We can create the identical report, with a few more mouse clicks, by navigating to the Reporting space, selecting the Windows Server 2003 Operating System report library, opening the Memory Performance History report, and adding the computer object(s) to report on in the report parameters. Figure 8.44 shows the report details after selecting that report in the Reporting space.
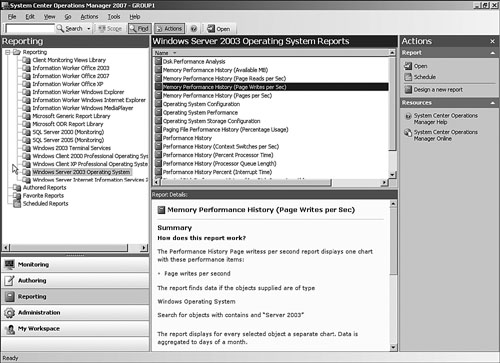
If you design and save a new custom report, you can locate it at the Authored Reports node of the Reporting space. Notice also in Figure 8.44 that one of the report libraries is the Generic Report Library.
Generic reports are really like templates, used to derive the targeted and context-focused reports. For example, generic reports exist for data based on alerts, availability, events, configuration changes, and performance. By opening a generic report of the type of data you want to report on, you are then free to select any criteria from across the management group to construct a custom report.
After running a targeted report or a generic report you have customized, you can export the results from the report view using the File -> Export command. Available export formats are XML, comma-delimited (CSV), graphic TIFF, Acrobat (PDF), Web archive (MHT), and Excel workbook. Another option available after you have run a report is to save that report as a “favorite report,” which puts a shortcut to that report in the Favorite Reports node of the Reporting space for quick access in the future.
You can create scheduled reports by selecting File -> Schedule from the Report window after running a report. A three-step wizard allows you to specify a delivery method, schedule, and parameter(s) for your report to automatically run and save to a file share of your selection. You can select the same file formats for scheduled reports as when exporting a targeted or generic report. A list of scheduled reports in your management group appears at the Scheduled Reports node in the Reporting space.
Tip: Enabling the Email Option as a Delivery Method
If you don’t see an option for email as a delivery method for your reports, run the Reporting Services Configuration tool on your SQL Reporting Services server. Specify the sender address and SMTP server in the email settings. Now reload the report and you should see the option for email as a delivery method.
The My Workspace area is a private place for you to create and store console customizations for later reuse. Many console settings, related to the configuration of the console, reside in the user area of the Registry of the computer running the Operations console. As we previously discussed in the “Console Configuration Data” section, those customizations are only available on the computer running the console you have customized. Microsoft has also provided a way to leverage the shared OpsMgr operational database to permit console operators to save some settings in the My Workspace area. Views saved in My Workspace will follow the operator from console to console, and notably are also made available when using the Web console.
Tip: Tuning the Web Console Refresh Interval
If you are using the Web console as an alerting dashboard, you might want to speed up the refresh interval. The default is 5 minutes, which can be modified to any number, including 0 (which disables automatic refresh). The refresh interval is set in a text file named web.config on the local disk of the Web Console Server, in the location %ProgramFiles%System Center Operations Manager 2007Web Console. Simply locate and modify the value in the following line:
<add key="ViewAutoRefresh" value = "5" />
There are three practical uses of the My Workspace area:
Create shortcuts to views in the Monitoring pane—. You can have quick access to any view in the Monitoring pane by creating a shortcut to it in your Favorite Views folder. Right-click any view in the Monitoring pane and select Add to my workspace.... Give the shortcut a name and select which Favorite Views folder to save the shortcut in (or create a new folder). The shortcut view reflects changes to the source view, and vice versa. However, deleting the shortcut does not delete the source view.
Create My Views—. These are unique views, not links to existing views. To create a My View, right-click the Favorite Views folder in My Workspace (or a favorite views child folder you created) and select New. Then you can create any view, such as an alert view or a dashboard view, just as if you were creating it in the Monitoring space. Views created here are only visible to you, so you can create all the views you want without affecting any other users in your management group.
Access saved searches—. Search functions are available from all console views, accessed via the top menu area of the Operations console, and you can save complex search criteria in My Workspace. A toolbar-style Search button is located there, or you can select Tools, Search from the menu bar. The button is not context-sensitive; it always calls up the same blank search window for you to enter your search terms in. Perhaps more useful is the Advanced Search function, which you can select from the bottom of the Search toolbar menu or from Tools -> Advanced Search. In the Advanced Search window is an option to save your search criteria for reuse later. Figure 8.45 shows the Advanced Search window with the Save parameters to My Favorites link highlighted.

Although the euphemistic term “fishing expedition” means an investigation with little chance of success, Microsoft urges OpsMgr administrators to teach console operators “how to fish.” A good fisherman makes an educated guess about where he may find the fish, and he drops a baited hook at the appropriate spot and depth. The My Workspace area is the tackle box for your operators, where each professional can store his or her assemblage of preferred tools (views and searches) for quick access every time he or she needs to “go fishing.”
We started this chapter with our core Operations Manager 2007 components just installed and in a default configuration. We walked though a testing scenario to validate that our core management group functions were working. After confirming that OpsMgr was correctly installed and functioning, we began the build-out of our management group. We imported a score of management packs, and we discussed several discovery methods to add managed objects. We had a detailed discussion on deploying and using the Operations console, and we concluded with a drilldown on each of the console’s activity panes.
It is now time for an in-depth discussion of agents, which is the topic of the next chapter.