
Welcome to System Center Operations Manager 2007—Microsoft’s revolutionary, completely revamped product for managing servers and applications in the Windows environment. System Center Operations Manager (OpsMgr) is a management tool that consolidates information about Windows servers and non-Windows devices, providing end-to-end monitoring of your applications and services, and centralized administration. Operations Manager gives you the resources you need to get and stay in control of your Windows environment and helps with managing, tuning, and securing Windows Server and Windows-based applications. For example, Operations Manager includes the following capabilities:
End-to-end service monitoring—. Using the Distributed Application Designer, OpsMgr provides a new design surface to define relationships between components and assemble them together, giving you proactive management of your IT services.
Best of breed for Windows—. OpsMgr reduces your time for problem resolution. Microsoft’s management packs include Microsoft expertise for Windows applications, servers, and clients.
Increased efficiency and control—. Operations Manager 2007 simplifies managing your Information Technology (IT) environment and improves its time-to-value. Microsoft’s newest version of its flagship management tool includes role-based security, a self-monitoring infrastructure, and improved scalability.
This chapter introduces System Center Operations Manager 2007. Various abbreviations for the product include SCOM, OM, Operations Manager, and OpsMgr; throughout this book, we use Microsoft’s preferred nomenclature of Operations Manager and OpsMgr. Operations Manager 2007, now in its third major release, is Microsoft’s software solution for facilitating server operations management. OpsMgr 2007 is Microsoft’s latest version of the product, with numerous portions completely rewritten and re-architected. The software contains many improvements over the previous version, including a focus on health with increased scalability, enhanced security, and service-oriented monitoring capabilities, such as application monitoring, synthetic transactions, and client and network device monitoring.
This chapter also discusses the concepts behind operations management and examines Microsoft’s management approach and Dynamic Systems Initiative (DSI). We provide an overview and comparison of two methodologies for approaching operations management: the Information Technology Infrastructure Library (ITIL) standard and the Microsoft Operations Framework (MOF). We discuss ISO 20000, and how Microsoft’s Infrastructure Optimization Model relates to MOF. These discussions are important because of OpsMgr’s alignment with model-based monitoring. Additionally, we discuss the operations management basics of managing system health.
So, why use Operations Manager? You may be thinking that the features Microsoft talks about sound “cool” but also are wondering why you need Operations Manager, given that new systems seldom are approved just because they are “cool.” Although this book will go over the features and benefits of Operations Manager 2007, it helps to have a few short answers here that quickly bring the point home.
Let’s look at ten compelling reasons why you might want to use Operations Manager:
The bulk of your department’s budget goes towards maintaining current systems and services, rather than using the bucks to hire people to manage those assets or develop new systems.
You realize system monitoring would be much easier if you had a single view of the health of your environment, including the applications and services running in production.
You feel stuck in the IT version of the movie Groundhog Day—you solve the same problems over and over again every day in exactly the same way, except unlike in the movie, you and your systems can really die. Plus, this is not a particularly efficient way to maintain operations.
You don’t have enough internal manpower (or brainpower) to solve problems as they come up, and consultants aren’t cheap.
You find out there are problems when users (or upper management) start calling you. Although this mechanism is actually quite effective in getting your attention, it is somewhat stress inducing and definitely not proactive.
You realize that even though your servers are humming along just fine, you have no idea how your client applications are actually performing against what is running on those servers. This makes it tough to know whether latency issues exist.
Complying with regulations such as Sarbanes-Oxley takes up all the time you once had to do your real job.
You would be more productive if you weren’t monitoring your production environment all day...and night. And during lunch and vacation.
Your production environment is so diverse and widespread that when a problem arises, you don’t even know where to start looking.
You don’t have the time to write down all the troubleshooting information that is in your brain, and your boss is concerned you might be hit by a truck (or want to take that vacation). This probably is not the best way to run a production environment.
Although these ten points contain some humor and a bit of satire, if any of these themes resonate with you, you really owe it to yourself to investigate OpsMgr 2007. These painful points are common to almost all users of Microsoft technologies, and System Center Operations Manager resolves them to a great degree.
However, the biggest reasons of all for using OpsMgr are confidence and peace of mind. Deploying Operations Manager allows you to relax; you can be secure in the knowledge that with OpsMgr watching your back, your systems will be in good shape.
Microsoft describes OpsMgr 2007 as a software solution that can meet the need for end-to-end service monitoring in an enterprise Information Technology environment. What exactly does this mean? Operations Manager provides an easy-to-use monitoring environment, is able to watch thousands of event and performance monitors across systems and applications, and provides a single view of the health of your operations environment.
These capabilities are significant because today’s IT systems are prone to a number of problems from the perspective of operations management, including the following:
Isolation
Lack of notification
Lack of historical information
Not enough expertise
Lack of methodology
Missing information and notifications
False alarms
This list should not be surprising because these problems manifest themselves in all IT shops with varying degrees of severity. In fact, Forrester Research estimates that 82% of larger shops are pursuing service management, and 67% are planning to increase Windows management. Let’s look at what the issues are.
We can start with examining reasons why systems go down. Figure 1.1 illustrates widely recognized reasons for outages, and the following list describes these reasons:
Software errors—. Software is responsible for somewhat less than half the errors. These errors include software coding errors, software integration errors, data corruption, and such.
User errors—. Users and operators cause a little less than half the errors. This includes incorrectly configured systems, missed warning messages that turn into errors, accidents, unplugged power cords, and so on.
Other—. This last category is relatively small. Causes of errors here include disk crashes, power outages, viruses, natural disasters, and so on.

As Figure 1.1 demonstrates, the vast majority of failures are from software-level errors and user errors. It is surprising to note that hardware failures account for the smallest percentage of problems, which is a tribute to modern systems such as Redundant Array of Independent Disks (RAID), clustering, and other mechanisms deployed to provide server and application redundancy.
The numbers show that to reduce system downtime, you need to attack the software and user error components of the equation, which are where you will get the most “bang for the buck.”
Microsoft Windows Server and the applications that run on it, such as Microsoft Exchange and Microsoft SQL Server, expose a wealth of information with event logs, performance counters, and application-specific logs. However, this data is isolated and typically server-centric, making it difficult to determine where the problem really is. To get a handle on our operations, we need to take actions to prevent the situation shown in Figure 1.2, where applications and system components are isolated islands of information.

We can find isolated information in a number of locations:
Event logs—. Events are generated by the Windows operating system, components, and applications. The logs include errors, warnings, information, and security auditing events. Event logs are stored locally on each server.
Log files—. File-based logs contain information related to system and software component installations, and they can include ongoing information related to the status of an application. For example, a web server maintains log files listing every request made to the server, and Microsoft SQL Server maintains a series of log files capturing events related to its operation. Operations Manager uses log files as well.
Performance counters—. The Windows operating system and multiple applications expose detailed performance information through performance counters. The data includes processor utilization, memory utilization, network statistics, disk free space, and thousands of other pieces of operational information.
Windows Management Instrumentation (WMI)—. WMI provides access to an incredible amount of information, ranging from high-level status of services to detailed hardware information.
Expertise—. Consultants, engineers, and subject matter experts have information locked up in their heads or written down on whiteboards and paper napkins. This is as much an island of information as the statistics and data stored on any computer.
Although system information is captured through event logs, performance counters, file-based logs, and experiences, it is typically lost over time. Most logs roll over, are erased to clear space, or are eventually overwritten. Even if the information is not ultimately lost or forgotten, it typically is not reviewed regularly by systems or operations personnel.
Additionally, most application information is server-centric, typically stored on the server, and specific to the server where the application resides. There is no built-in, systemwide, cross-system view of critical information or system health.
Having islands of information, where operational data is stranded on any given island, makes it difficult to get to needed information in a timely or effective manner.
In your typical unmanaged IT environment, often no one knows when noteworthy events occur. Going to each server and reviewing its event logs regularly is a massive undertaking for the typical system administrator. Although the event logs capture a tremendous amount of information, they will eventually roll over and be overwritten without being looked at; that information is lost.
You may be familiar with an old philosophical saying: If a tree falls in a forest and no one is around to hear it, does it make a sound?
Here’s the operations management equivalent: If an event is logged on a system and no one knows, does logging it make a difference?
The answer to this question is definitely “no”; if no one knows, the event may as well not be logged. This loss of information can affect the long-term health of the system—if you knew about its occurrence you could avert potential outages.
As an example, there was a situation where an Exchange server at a large manufacturing organization was receiving 1018 errors in the Application Event log for several months, but the administrators never checked the logs to catch it. Error 1018 indicates an Exchange database problem; it is a severe error requiring immediate action. The server eventually crashed and the backups were unusable—the backed up databases were corrupt. Restoring the mail system necessitated an expensive disaster recovery scenario using outside consultants, resulting in the loss of critical messaging data and the jobs of the staff held responsible.
In the end, information is only informative if you are aware of it, and it is only as good as what you do with it. To put this another way, most IT shops have many trees falling without someone hearing them...until it is too late.
Sometimes you may capture information about a system problem, but are not able to look back in time to see whether this is an isolated instance or part of a recurring pattern. An incident can be a one-time blip or can indicate an underlying issue; without a historical context, it is difficult to understand the significance of any particular incident. This is especially true with performance data.
Let’s say an IT shop brings in a technical consultant to review a system’s performance problems. To prove there is a problem, the in-house IT staff points out that users are complaining about performance and the memory and CPU are only 50% utilized. By itself, this does not tell us anything. It could be that memory and the CPU are normally 65% utilized and the problem is really a network utilization problem, which in turn reduces the load on the other resources. A historical context could provide useful information.
As a technical expert, the consultant would develop a hypothesis and test it, which will take time and cost money. Rather than trying to solve the problem, many IT shops just throw more hardware at it—only to find that this does not necessarily improve performance. With historical records, they would see that system utilization actually dropped at the same time users started complaining, and they could look elsewhere to find the network problems. Ideally, you would have historical information for troubleshooting and detecting trends.
Do you lack the in-house expertise needed to diagnose some of the messages or trends appearing on your Windows servers and server-based applications? Do you pay an arm and a leg to call in consultants, only to find that the messages are actually not all that severe? On the other hand, do you ignore messages you don’t think are significant only to later discover that they are important?
If the expertise you need is not available when you need it, you can miss diagnostic opportunities or incur higher operational costs. Missed diagnostics opportunities can translate to system outages and ultimately higher operational expenses if emergency measures are required to resolve problems.
Many IT organizations still “fly by the seat of their pants” when it comes to identifying and resolving problems. Using standard procedures and a methodology helps minimize risk and solve issues faster.
A methodology is a body of practices, procedures, and rules used by those who work in a discipline or engage in an inquiry. It can also refer to a set of working methods. We can look at a methodology as a structured process that defines the who, what, where, when, and why of your operations, and the procedures to use when defining problems, solutions, and courses of action.
Consistently using a methodology gives you the tools to help measure or compare where you are to where you were. A methodology also includes identifying and using standards, policies, and rules of operation.
With IT’s continually increased role in running successful business operations, having a structured and standard way to define IT operations can increase your business decision-makers’ confidence that IT is a significant and ongoing business concern. In addition, that increased level of confidence may translate to higher job satisfaction for you.
Sometimes you detect problems by what did not occur, rather than by what actually happened. A good example of this is data backups. Regardless of whether the backup is successful or fails, it generates an event and some type of notification.
However, what happens when the backup doesn’t fail or succeed, but just doesn’t happen? If you are not looking closely at your event logs, you will likely not discover this fact until later. We know a case of a large educational institution doing backups that missed one server during an initial configuration. Eventually the server crashed and they attempted to restore to an earlier point, only then discovering there were no backups. Even though all their backup jobs were configured to generate success notices and notify of failures, that particular server was not generating these notifications and was missed—with severe consequences impacting management, faculty, staff, and students.
Sometimes when you do not receive a notification or event, it is a signal to take action. The bottom line is you need to be able to test whether something has failed to happen.
Even when you are notified of events, it may be difficult to tell whether you actually have a problem. Windows Server and the services and applications running under it are good about generating errors, warnings, and informational messages. The challenge is that there is so much information that it can be difficult to tell which of these thousands of messages are normal operating events, rather than errors that require remedial action.
False alarms are typically due to a lack of knowledge or inadequate filtering. Sometimes a benign message may look ominous to the untrained eye. One example would be event 11 from w32time in the System Event log, which is a warning indicating an unreachable Network Time Protocol (NTP) server. This actually is a normal occurrence and is not a problem (although several of these errors may indicate a problem that needs action).
The issues described so far generally occur in an unmanaged environment. By “unmanaged,” we mean an environment that is not using a disciplined approach for managing its operational information. By not correlating operational data across systems, being aware of potential issues, maintaining a history of past performance and problems, and so on, IT shops open themselves up to putting out fires that could be prevented by using a more systematic approach to operations management (see Figure 1.3). We will cover these issues in the next section.

Operations management is not something achieved at a point in time. Instead, it is a process aimed at improving the reliability and availability of computer applications and services though addressing the problems discussed in the previous sections of this chapter. It consists of the care and feeding of an IT asset, as well as managing, maintaining, and supporting the needs and events (including dependencies) of an operation.
Operations management bliss is not attained merely by running a setup program to install a “management application.” The process of operations management is a combination of people, procedures, and tools—all three are necessary, and the absence of one component can put an entire enterprise solution at risk. At a more granular level, operations management is about correlating what may appear to be seemingly unrelated events and data across machines to determine what information is significant to your operational environment versus what is not.
Operations management is also about managing the ongoing activities that Information Technology personnel perform on various IT components with the goal of improving the performance of one’s business organization. It results in higher reliability, greater availability, better asset allocation, and a more predictable IT environment.
How does operations management accomplish this? As IT operations grow in size and impact, it quickly becomes apparent that effectively managing complex production environments requires the use of standardized methodologies and approaches to manage servers. Once a business relies on IT to maintain daily operations, having a disciplined and informative methodology is necessary to help ensure IT is supporting the organization’s business goals and objectives. These goals typically include reducing costs, increasing productivity, and providing information security.
Reducing costs and increasing productivity is important because, in addition to taking up a significant part of the IT budget, the business impact of failed systems or performance degradation can be devastating to the entire enterprise, resulting in increased operational costs, decreased quality of service, and lost revenue and profit. Time, after all, is money! Information security is also imperative because the price tag of compromised systems and data recovery from security exposures can be large, and those costs continue to rise each year.
As part of an operations management plan, any company with more than nontrivial IT requirements stands to benefit by using software tools to automate tasks such as managing server networks, tracking desktop systems, and enforcing security policies. Microsoft software addresses this area through two key products—System Center Configuration Manager (ConfigMgr, formerly known as Systems Management Server or SMS) and System Center Operations Manager (in earlier releases known as MOM or Microsoft Operations Manager).
Configuration Manager is Microsoft’s product for change and configuration management on the Microsoft Windows platform. It reduces the operational costs of managing and deploying software, enabling organizations to distribute relevant software and updates to users in a quick and cost-effective manner. OpsMgr provides you with knowledge to reduce the complexity of managing your IT infrastructure environment and lower your operational costs. Keep in mind, however, that ConfigMgr and OpsMgr are merely tools; they enable you to meet objectives incorporating software for automating the process.
Microsoft utilizes a multipronged approach to management. This strategy includes the following areas:
Continuing to making Windows easier to manage by providing core management infrastructure and capabilities in the Windows platform itself, thus allowing business and management application developers to improve their infrastructures and capabilities. Microsoft believes that improving the manageability of solutions built on Windows Server System will be a key driver in shaping the future of Windows management.
Building complete management solutions on this infrastructure, either through making them available in the operating system or by using management products such as Configuration Manager, Operations Manager, and other components of the System Center family.
Integrating infrastructure and management by exposing services and interfaces that applications can utilize.
Supporting a standard Web Services specification for system management. WS-Management is a specification of a SOAP-based protocol, based on Web Services, used to manage servers, devices, and applications (SOAP stands for Simple Object Access Protocol). The intent is to provide a universal language that all types of devices can use to share data about themselves, which in turn makes them more easily managed. Support for WS-Management is included with Windows Vista and Windows Server 2008, and it is leveraged by OpsMgr.
Using an Infrastructure Optimization (IO) Model as a framework for aligning IT with business needs. We discuss the IO Model further in the “Optimizing Your Infrastructure” section of this chapter. The IO Model describes your IT infrastructure in terms of cost, security risk, and operational agility.
Taking model-based management (used with the Dynamic Systems Initiative, discussed in the next section) to implement synthetic transaction technology. Operations Manager 2007 delivers a service-based monitoring set of scenarios, enabling you to define models of services to deliver to end users.
A large percentage of IT departments’ budgets and resources typically focus on mundane maintenance tasks such as applying software patches or monitoring the health of a network, without leaving the staff with the time or energy to focus on more exhilarating (and more productive) strategic initiatives.
The Dynamic Systems Initiative, or DSI, is a Microsoft and industry strategy intended to enhance the Windows platform, delivering a coordinated set of solutions that simplify and automate how businesses design, deploy, and operate their distributed systems. Using DSI helps IT and developers create operationally aware platforms. By designing systems that are more manageable and automating operations, organizations can reduce costs and proactively address their priorities.
DSI is about building software that enables knowledge of an IT system to be created, modified, transferred, and operated on throughout the life cycle of that system. It is a commitment from Microsoft and its partners to help IT teams capture and use knowledge to design systems that are more manageable and to automate operations, which reduces costs and gives organizations additional time to focus proactively on what is most important. By innovating across applications, development tools, the platform, and management solutions, DSI will result in
Increased productivity and reduced costs across all aspects of IT
Increased responsiveness to changing business needs
Reduced time and effort required to develop, deploy, and manage applications
Microsoft is positioning DSI as the connector of the entire system life cycle.
DSI focuses on automating data-center operational jobs and reducing associated labor though self-managing systems. We can look at several examples where Microsoft products and tools integrate with DSI:
Operations Manager uses the application knowledge captured in management packs to simplify identifying issues and their root causes, facilitating resolution and restoring services or preventing potential outages, and providing intelligent management at the system level. OpsMgr 2007 is a key component of DSI.
Visual Studio is a model-based development tool that initially leveraged the System Definition Model (SDM) and now uses Service Modeling Language (SML), enabling operations managers and application architects to collaborate early in the development phase and ensure systems are defined with operational requirements in mind.
Windows Server Update Services (WSUS) enables greater and more efficient administrative control through modeling technology that enables downstream systems to construct accurate models representing their current state, available updates, and installed software.
Note: What’s in an Acronym? Moving from SDM to SML
Microsoft originally used SDM as its standard schema with DSI but has since implemented SML, an industrywide published specification used in heterogeneous environments. Using SML helps DSI adoption by incorporating a standard that Microsoft’s partners can understand and apply across mixed platforms. We discuss SML in the “Using Service Modeling Language” section of this chapter.
DSI focuses on automating data-center operational jobs and reducing associated labor though self-managing systems. Can management software be made clever enough to know when a particular system or application has a problem and then dynamically take actions to avoid that? Consider the scenario where, without operator intervention, a management system starts an additional web server because the existing web farm is overloaded from traffic. Rather than being far-fetched, this particular capability is available with Microsoft Application Center 2000 and more recently with Virtual Server 2005; DSI aims to extend this type of self-healing and self-management to other operations.
In support of DSI, Microsoft has invested heavily in three major areas:
Systems designed for operations—. Microsoft is delivering development and authoring tools—such as Visual Studio—that enable businesses to capture and edit system knowledge and facilitate collaboration among business users, project managers, architects, developers, testers, and operations staff. Additionally, Microsoft servers and many third-party applications will be enabled to capture information necessary to dramatically improve deployment and management.
An operationally aware platform—. The core Windows operating system and its related technologies are critical when solving everyday operational challenges. This requires the operating system services to be designed for manageability. Additionally, the operating system and server products must provide rich instrumentation and hardware resource virtualization support.
Intelligent management tools—. The third and most critical piece in DSI contains the management tools for leveraging the operational knowledge captured in the system, providing end-to-end automation of system deployment.
The philosophy behind DSI is threefold:
That Microsoft products be patched in a simplified and uniform way
That Microsoft server applications are optimized for management, to take advantage of Operations Manager 2007
That developers have tools (in Visual Studio) to design applications in a way that makes them easier for administrators to manage after those applications are in production
With DSI, Microsoft utilizes a nontraditional approach to systems management. DSI employs an application development standpoint, rather than a more customary operations perspective that concentrates on automating task-based processes. Remember from the “Microsoft’s Dynamic Systems Initiative (DSI)” section that DSI is about building software that enables knowledge of an IT system to be created, modified, transferred, and used throughout the life cycle of a system. DSI’s core principles—knowledge, models, and the life cycle—are key in addressing the challenges of complexity and manageability faced by IT organizations. By capturing knowledge and incorporating health models, DSI can facilitate troubleshooting and maintenance.
Central to DSI is the XML-based (Extensible Markup Language) schema called Service Modeling Language (SML). SML can be utilized in architecting software and hardware components and creating definitions of distributed systems. Businesses can use SML to take an entire system and generate a blueprint of that system. The blueprint defines system elements and captures data pertinent to development, deployment, and operations—making that model relevant across the entire IT life cycle. SML is a core technology around which we will see many future DSI components and products developed.
ITIL is widely accepted as an international standard of best practices for operations management, and Microsoft has used it as the basis for the MOF, its own operations framework. Warning: Discussions of ITIL and MOF can be dry; proceed at your own risk!
As part of Microsoft’s management approach, the company relied on an international standards-setting body as its basis for developing an operational framework. The British Office of Government Commerce (OGC), provides best practices advice and guidance on using Information Technology in service management and operations. The OGC also publishes the IT Infrastructure Library, known as ITIL.
ITIL provides a cohesive set of best practices for IT Service Management (ITSM). These best practices include a series of books giving direction and guidance on provisioning quality IT services and facilities needed to support Information Technology. The documents are maintained by the OGC and supported by publications, qualifications, and an international users group.
Started in the 1980s, ITIL is under constant development by a consortium of industry IT leaders. The ITIL covers a number of areas and is primarily focused on ITSM; its IT Infrastructure Library is considered to be the most consistent and comprehensive documentation of best practices for IT Service Management worldwide.
Think of ITSM as a top-down business-driven approach to managing Information Technology. It specifically addresses the strategic business value generated by IT and the need to deliver high-quality IT services to one’s business organization. ITSM itself has two main components:
Service Support
Service Delivery
ITSM is designed to focus on the people, processes, and technology issues faced by IT, which is analogous to the focus of operations management.
ITIL describes at a high level “what you must do” and why, but does not describe how you are to do it. A driving force behind its development was the recognition that organizations are increasingly dependent on IT for satisfying their corporate aims and meeting their business needs, which increases the requirement for high-quality IT services. Many large IT shops realized that the road to a customer-centric service organization runs along an ITIL framework.
ITIL also specifies keeping measurements or metrics. Measurements can include statistics such as the number and severity of service outages, along with the amount of time it takes to restore service. You can use metrics to quantify to management how you are doing.
This information can be particularly useful for justifying resources during the next budget process!
ITIL is generally accepted as the “best practices” for the industry. Being technology-agnostic, it is a foundation that can be adopted and adapted to meet the specific needs of various IT organizations. Microsoft chose ITIL as the foundation for its operations framework, such that the Microsoft Operations Framework (MOF) gives prescriptive guidance in operating Microsoft technologies in conformance with the descriptive guidance in ITIL. MOF is a set of publications providing both descriptive (what to do and why) and prescriptive (how to do) guidance on IT service management.
The key focus in developing MOF was providing a framework specifically geared toward managing Microsoft technologies. Microsoft created the first version of the MOF in 1999. MOF is designed to complement Microsoft’s previously existing Microsoft Solutions Framework (MSF) used for solution and application development. Together, the combined frameworks provide guidance throughout the IT life cycle, as shown in Figure 1.4.
Tip: Using MSF for OpsMgr Deployments
Microsoft uses MOF to describe IT operations and uses Operations Manager as a tool to implement that framework. However, Operations Manager 2007 is also an application and, as such, is best deployed using a disciplined approach. A suggested methodology for deployment would be using principles from the MSF, which we discuss in Chapter 4, “Planning Your Operations Manager Deployment.”
At its core, the MOF is a collection of best practices, principles, and models. It provides direction to achieve reliability, availability, supportability, and manageability of mission-critical production systems, focusing on solutions and services using Microsoft products and technologies. MOF extends ITIL by including guidance and best practices derived from the experience of Microsoft’s internal operations groups, partners, and customers worldwide. MOF aligns with and builds on the IT service management practices documented within ITIL, thus enhancing the supportability built on Microsoft’s products and technologies.
MOF uses a process model that describes Microsoft’s approach to IT operations and the service management life cycle. The model organizes the core ITIL processes of service support and service delivery, and it includes additional MOF processes in the four quadrants of the MOF process model, as illustrated in Figure 1.5.
It is important to note that the activities pictured in the quadrants illustrated in Figure 1.5 are not necessarily sequential. These activities can occur simultaneously within an IT organization. Each quadrant has a specific focus and tasks, and within each quadrant are policies, procedures, standards, and best practices that support specific operations management–focused tasks.
Operations Manager 2007 management packs can be configured to support operations management tasks in different quadrants of the MOF Process Model. Let’s look briefly at each of these quadrants and see how we can use OpsMgr to support MOF:
Changing—. This quadrant represents instances where new service solutions, technologies, systems, applications, hardware, and processes have been introduced.
As you add new components to your environment, you should investigate whether a Microsoft or third-party management pack is available to monitor a particular application, system, or hardware solution. (If a management pack is not available, you can define your own, building a model to describe the “vital signs” and monitoring attributes of that application.)
Operating—. This quadrant concentrates on performing day-to-day tasks efficiently and effectively.
OpsMgr includes operational tasks that you can initiate from the Operations console. These tasks are made available with various management packs, and you may add your own as well.
Supporting—. This quadrant represents the resolution of incidents, problems, and inquiries, preferably in a timely manner.
OpsMgr is all about monitoring daily operations. Management packs provide the capability, for knowledgeable users, to interpret and act on information gathered from each monitored component to resolve any difficulties.
Optimizing—. This quadrant focuses on minimizing costs while optimizing performance, capacity, and availability in the delivery of IT services.
OpsMgr’s reporting and monitoring capabilities can help you increase efficiency and gain greater control over your IT environment. Integrating and extending problem reporting and operations monitoring to client systems help lower your client support costs, while availability reporting allows both IT operations and management to get the information needed to quickly identify and resolve issues that affect service levels.
Service Level Agreements and Operating Level Agreements (OLAs) are tools many organizations use in defining accepted levels of operation and ability. Operations Manager includes the ability to specify SLAs using Alert Resolution States. Additional information regarding the MOF Process Model is available at http://go.microsoft.com/fwlink/?LinkId=50015.
Microsoft believes that ITIL is the leading body of knowledge of best practices; for that reason, it uses ITIL as the foundation for MOF. Rather than replacing ITIL, MOF complements it and is similar to ITIL in several ways:
MOF (with MSF) spans the entire IT life cycle.
Both MOF and ITIL are based on best practices for IT management, drawing on the expertise of practitioners worldwide.
The MOF body of knowledge is applicable across the business community—from small businesses to large enterprises. MOF also is not limited to those using the Microsoft platform in a homogenous environment.
As is the case with ITIL, MOF has expanded to be more than just a documentation set. In fact, MOF is now intertwined with Operations Manager 2007!
Additionally, Microsoft and its partners provide a variety of resources to support MOF principles and guidance, including self-assessments, IT management tools that incorporate MOF terminology and features, training programs and certification, and consulting services.
You can think of ITIL and ITSM as providing a pathway for IT to rethink the ways in which it contributes to the business. The processes represented by ITIL and ITSM have evolved into the standard known as ISO 20000, which is the first international standard for IT Service Management.
ISO 20000 was first published in December 2005. It was developed to reflect best-practice guidance contained within ITIL. The standard also supports other IT Service Management frameworks and approaches, including MOF. ISO 20000 consists of two major areas:
These two areas—what to do and how to do it—have similarities to the approach taken by the MOF.
According to Microsoft, analysts estimate that over 70% of the typical IT budget is spent on infrastructure—managing servers, operating systems, storage, and networking. Add to that the challenge of refreshing and managing desktop and mobile devices, and there’s not much left over for anything else. Microsoft describes an Infrastructure Optimization Model that categorizes the state of one’s IT infrastructure, describing the impacts on cost, security risks, and the ability to respond to changes. Using the model shown in Figure 1.6, you can identify where your organization is, and where you want to be:
Basic—Reactionary, with much time spent fighting fires
Standardized—Gaining control
Rationalized—Enabling the business
Dynamic—Being a strategic asset

Although most organizations are somewhere between the basic and standardized levels in this model, typically one would prefer to be a strategic asset rather than fighting fires. Once you know where you are in the model, you can use best practices from ITIL and guidance from MOF to develop a plan to progress to a higher level. The IO Model describes the technologies and steps organizations can take to move forward, whereas the MOF explains the people and processes required to improve that infrastructure. Similar to ITSM, the IO Model is a combination of people, processes, and technology.
More information about Infrastructure Optimization is available at http://www.microsoft.com/technet/infrastructure.
At the Basic level, your infrastructure is hard to control and expensive to manage. Processes are manual, IT policies and standards are either nonexistent or not enforced, and you don’t have the tools and resources (or time and energy) to determine the overall health of your applications and IT services. Not only are your desktop and server management costs out of control, but you are in reactive mode when it comes to security threats. In addition, you tend to use manual rather than automated methods for applying software deployments and patches.
Does this sound familiar? If you can gain control of your environment, you may be more effective at work! Here are some steps to consider:
Develop standards, policies, and controls.
Alleviate security risks by developing a security approach throughout your IT organization.
Adopt best practices, such as those found in ITIL, and operational guidance found in the MOF.
Build IT to become a strategic asset.
If you can achieve operational nirvana, this will go a long way toward your job satisfaction and IT becoming a constructive part of your business.
A Standardized infrastructure introduces control by using standards and policies to manage desktops and servers. These standards control how you introduce machines into your network. As an example, using Directory Services will manage resources, security policies, and access to resources. Shops in a Standardized state realize the value of basic standards and some policies, but still tend to be reactive. Although you now have a managed IT infrastructure and are inventorying your hardware and software assets and starting to manage licenses, your patches, software deployments, and desktop services are not yet automated. Security-wise, the perimeter is now under control, although internal security may still be a bit loose.
To move from a Standardized state to the Rationalized level, you will need to gain more control over your infrastructure and implement proactive policies and procedures. You might also begin to look at implementing service management. At this stage, IT can also move more toward becoming a business asset and ally, rather than a burden.
At the Rationalized level, you have achieved firm control of desktop and service management costs. Processes and policies are in place and beginning to play a large role in supporting and expanding the business. Security is now proactive, and you are responding to threats and challenges in a rapid and controlled manner.
Using technologies such as zero-touch deployment helps you to minimize costs, deployment time, and technical challenges for system and software rollouts. Because your inventory is now under control, you have minimized the number of images to manage, and desktop management is now “low touch.” You also are purchasing only the software licenses and new computers the business requires, giving you a handle on costs. Security is now proactive with policies and control in place for desktops, servers, firewalls, and extranets.
At the Dynamic level, your infrastructure is helping run the business efficiently and stay ahead of competitors. Your costs are now fully controlled. You have also achieved integration between users and data, desktops and servers, and the different departments and functions throughout your organization.
Your Information Technology processes are automated and often incorporated into the technology itself, allowing IT to be aligned and managed according to business needs. New technology investments are able to yield specific, rapid, and measurable business benefits. Measurement is good—it helps you justify the next round of investments!
Using self-provisioning software and quarantine-like systems to ensure patch management and compliance with security policies allows you to automate your processes, which in turn improves reliability, lowers costs, and increases your service levels. Welcome to IT nirvana!
ITIL and MOF are utilized to define management approaches, and the IO Model prescribes actions to become a strategic asset. However, the day-to-day operations, strategies, and solutions in today’s world are at a different level of granularity. Typically, computing environments consist of distributed systems where work is performed utilizing dispersed servers—because distributed computing often requires using numerous machines that may be in multiple locations. Having an overall management strategy is necessary for preventing chaos and gaining control, but daily management of production server environments also requires being thoroughly aware of the operational health and security of those systems—are they performing the tasks they are meant to, are they the focus of a hacker, or are they even reachable across the network?
Operations management, in addition to introducing an alphabet soup of acronyms of management concepts, is concerned with monitoring your servers to ensure they maintain a required level of performance. Looking specifically at the Windows platform, Microsoft provides a number of basic monitoring utilities with the Windows Server product. These tools incorporate core event monitoring, performance monitoring, and management components such as the Event Viewer and Performance/System Monitor.
However, as mentioned in “The Problem with Today’s Systems,” understanding the significance of the information that is available with such utilities can be daunting, particularly with a large number of servers and a complex environment. Although these basic tools are included with Windows Server, they provide a view of the trees without the ability to see the entire forest. In other words, they give a detailed view of a single server and do not scale or give easy diagnoses of information to resolve problems that occur across multiple systems.
Because these utilities only provide raw data, effectively using that data requires personnel with the knowledge to select, understand, filter, and interpret and correlate the information. These tools typically only show pieces and parts of the overall picture, and additional data may be required from different sources.
The information spewing from these systems consists of thousands of events and other types of operational data that can be captured from a single server, which brings to mind the phrase “drinking water from a fire hose,” as shown in Figure 1.7. You are inundated with a gushing stream of facts and figures coming at you with tremendous built-up pressure. Making sense of all that data, or “taming the fire hose,” is a challenge facing IT shops of all sizes, and one that OpsMgr is designed to address.

Unlike scenes in the movie The Matrix, numbers are not just pouring vertically down the screen—and you don’t need the ability to jump from roof to roof or dodge bullets to be able to decipher them. You merely need the tools and products available to mere mortals.
System Center Operations Manager 2007 is Microsoft’s software tool for solving operation management problems and is a key component in Microsoft’s management strategy and System Center. Operations Manager is a comprehensive operations management solution, using an agent-based centralized management model to localize data collection while centralizing collected data and agent configuration information. As discussed at the beginning of this chapter, OpsMgr 2007 provides the following benefits:
End-to-end service management—. This is the capacity to integrate application, client, server, and synthetic transaction monitoring into a single end-to-end solution. Service-oriented views and availability reporting allow your operations team and IT management to get the information they need to quickly identify and resolve issues that impact service levels. You get end-to-end management without the day-to-day drama.
Best of breed for Windows—. OpsMgr includes expertise from Microsoft’s Server, Client, and Application teams to provide you with prescriptive knowledge and automated inline tasks that improve monitoring, troubleshooting, and problem resolution for over 60 Microsoft applications and Windows Server components. Operations Manager also includes problem management and troubleshooting of client computers to accelerate identifying and resolving end-user issues.
Increased efficiency and control of your IT environment—. OpsMgr automates routine and redundant tasks, providing intelligent reporting and monitoring that can help increase efficiency and control of your environment. It builds on the Windows PowerShell and includes a Software Development Kit (SDK) for secure scripted automation across an Operations Manager environment. Its scalability can support organizations with tens of thousands of managed servers and hundreds of thousands of managed clients, using multiple management servers and connected management groups for a consolidated view of your entire enterprise. By introducing self-tuning thresholds that learn and adjust behavior, OpsMgr can help minimize false alarms.
Agents operate under sophisticated sets of rules, collected in management packs. These management packs, which are models based on the SML schema, allow the rules to be targeted to just the systems that need them. Operations Manager 2007 utilizes SML to monitor not just servers, but also logical services. Using this service-centric view, OpsMgr can understand service and application structures as well as monitor the overall health of services and applications by viewing the state of any object. Problems identified by these rules can be acted on by operational and systems personnel; the results collected by this process can be analyzed and published using OpsMgr’s reporting capabilities.
To put Operations Manager’s capabilities in a clearer context, we will discuss key technical features as they relate to the issues identified earlier in “The Problem with Today’s Systems” section of this chapter.
OpsMgr 2007 solves the isolated systems problem with end-to-end monitoring and collecting information from your different islands of information. It monitors event logs, performance monitor counters, application programming interfaces, WMI information, and network devices, locally gathering the data from each monitored object, centrally storing it, and taking action as appropriate. OpsMgr also provides a centralized console to monitor the operational status of your entire network. Figure 1.8 shows the health state of computers in a monitored organization. The view shows that there is currently a problem area on the Quicksilver computer, and if we scroll right in the Computers view in the Operations console, we would see that the affected area is within the IIS subsystem.
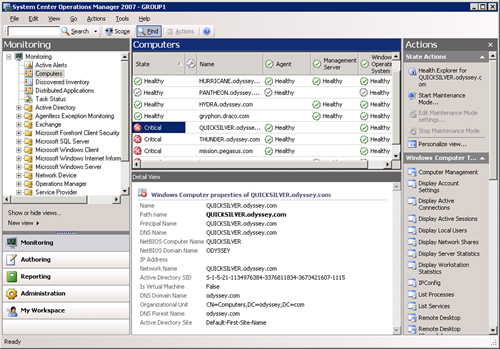
Using this view enables us to see which systems and components are healthy and which are not. Health is based on rolling up information from each monitored object.
The job of collecting and handling data is managed by each monitored computer, which distributes the work of collecting and handling information. Distributed management includes the following advantages over centralized management:
Local information collection (scales outward and enables a smaller footprint at the central management server)
Increased fault tolerance
Reduced network impact
Better response times
With a distributed model, information is collected, buffered, and processed locally. A distributed model also enables fault tolerance and flexibility for network outages. If the network is unavailable, the local agents still collect information and respond to alerts. This model also reduces the impact of data collection on the network by forwarding only information that needs forwarding. The agent on the local system compresses the data stream for an even smaller footprint to send to its primary management server. This model dramatically reduces response time.
The key to connecting information is the intelligent agent. Operations Manager deploys an agent to monitored servers, distributing the workload, information gathering, and intelligence. (OpsMgr 2007 also incorporates client monitoring as well as agentless monitoring of a limited number of systems.) The agent enables a monitored system to forward only the information deemed important, rather than everything. It also allows the monitored system to continue to collect operations data when communications with the central console is disrupted. If the designated management server is unavailable, the data is automatically sent to an alternate management server. In the event of a total network outage, the data is forwarded when communications are reestablished.
Using a distributed model, the agent collects information locally. A centralized management server ultimately receives the information, gathering data from all the “islands” and storing it in a common database. This database is centrally located and stored on a SQL Server system, allowing OpsMgr to correlate and respond to networkwide events, such as an attempt to breach security on several systems at once. Operations Manager monitors continuously, ensuring nothing is missed.
The agents process rules, which specify what data to collect and what to do about it. Rules can filter information and aggregate and consolidate the collected information. These model-based rules are really the core functionality of OpsMgr and are covered in detail in Chapter 14, “Monitoring with Operations Manager.” Rules are components of management packs, which are applied as a unit to the systems utilizing the specified components. Management packs also contain monitors, which represent the state of individual components of a system. We discuss using some of the more interesting management packs in Chapters 16 through 19.
Using centralized data storage also addresses our islands of information issue by enabling consolidated views and reports of the many different “islands” across multiple servers. As an example, an administrator can generate a report that compares error events, CPU performance, the length of message queues, and network interface performance on Exchange servers in different parts of the network at the same time. Without Operations Manager, providing this information would require multiple interfaces and tools. Having a holistic view of the information allows the system to respond to complex conditions where several events taken independently would not constitute a problem, but taken together demand immediate action.
Throughout this book, we use a fictitious company named the Odyssey Company to illustrate many of our examples. Odyssey has 750 servers spread throughout two locations. For instance, let’s say Odyssey has a network load-balanced farm using four web servers to provide Web Services. By using a web farm, the failure of any one system does not jeopardize the overall service. Arguably, that is the purpose for having load-balanced servers. However, the failure of two or three of these web servers would constitute a critical condition requiring immediate attention. OpsMgr can detect the difference and generate an error alert if any individual server fails, yet create a critical alert if two or more servers fail.
If you right-click a system in the Results pane shown in Figure 1.8, you can open the alert, diagram, event, performance, and state views associated with this object. You can also open the Health Explorer here from the Actions pane. The Health Explorer is displayed in Figure 1.9. You can see how OpsMgr shows the various monitored components, known as monitors, and the rollup for those monitors.

At a glance, this shows that although the Web Components on Quicksilver are experiencing issues, other components on the server are available and functioning properly. Each object is shown as healthy, in an error state, or not yet monitored. Using the Health Explorer, you can quickly isolate the target area. You can even customize the view to see which applications are impacted by the affected monitor.
Operations Manager 2007 resolves the notification problem by automatically detecting and responding to changes in state, generating alerts processed using its notification workflow engine. As it collects information, responses to conditions and changes in state can be triggered at each collection point in the OpsMgr architecture. The local agent processes data and analyzes it using the business logic in OpsMgr’s rules, making a decision whether to pass the information to a central management server.
Microsoft designed the entire process to incorporate the best of all possible worlds. Agents on the monitored servers collect and initially process the information; this reduces the load placed on the management server because information is centrally acted on only as necessary.
The design also allows the local agents to continue to respond to alerts even when communication with the management server is disrupted. Preprocessing keeps the traffic flow from the agents lean and the database storage footprint light. Even so, an administrator would prefer to not be notified about all the myriad data collected by Operations Manager 2007. Accordingly, OpsMgr detects changes in state and incorporates self-tuning thresholds to be selective about the alerts it raises.
Using the Health Explorer shown in Figure 1.9, you can view the alerts related to a given monitor. You can also use the Active Alerts pane in the Operations console to look at all outstanding alerts. Figure 1.10 shows that currently four alerts are Warnings and 11 are Critical alerts.
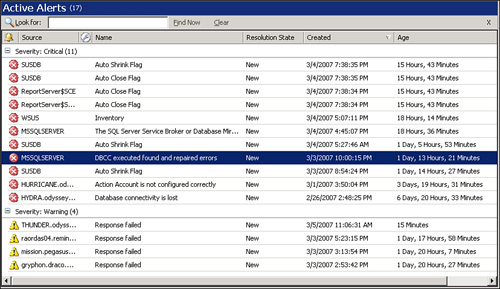
You can also highlight any particular alert in the Active Alerts pane to view the detail behind that alert. In Figure 1.11, you can see what a specific error is on the Pantheon server, including the cause of the error and potential actions for resolution.

You can also click the Alert Rule link in the Alert Details pane in Figure 1.11 to bring up the specific rule behind that alert. Notice in Figure 1.12 that the information is broken into six areas or tabs:
General—. This tab provides general information, including the management pack and the name of the rule.
Product Knowledge—. Provides information collected by the vendor (in this case, Microsoft) about the conditions related to the alert, including causes and potential resolutions.
Company Knowledge—. In this area you can add information specific to this condition at your particular organization.
History—. History about this particular alert; you can add comments that will be added to the alert history.
Alert Context—. Displays in XML format information regarding the event behind the alert.
Custom Fields—. Up to ten custom fields are available to add information regarding the alert.

In addition to generating alerts, Operations Manager can send notifications based on the severity or age of a particular alert. Using the notification workflow engine, you can define subscriptions where alerts are sent to targeted recipients in a variety of ways:
Via a network message, email message, instant message, or short message service (text messaging).
By generating a Simple Network Management Protocol (SNMP) trap via a command piped to an external SNMP generator to integrate with another management system.
By launching a script for complex processing. This ensures that even when alerts are generated, they do not intrusively notify you unless necessary.
Using the Operations console, Operations Manager allows you to view the state of your organization as a whole or to drill down into detail about any particular alert.
A big problem in IT is the distributed nature of security in Microsoft applications. Many administrators have local administrative access to servers, allowing them to modify things such as system and security logs. An unscrupulous administrator can use this access to circumvent security policies, ostensibly with the purpose of getting the job done. This is a gaping hole in any organization trying to maintain tight security. You need to know if there are security changes.
Operations Manager’s new Audit Collection Services (ACS) Component can help you manage the security of your IT environment by collecting security events from managed computers for analysis. ACS helps facilitate the separation of security personnel from other IT job functions. It collects significant security events and can warn appropriate security personnel of violations of security policy. The local agent immediately forwards security log information to the Audit Collection database, moving it outside the control of the local administrator. Even if an administrator attempts to cover his tracks by clearing the Security Event log, ACS has sequestered the information. If a local administrator attempts to circumvent the process by shutting down the agent, the central console detects that and can generate an appropriate alert. You can use ACS to address regulatory compliance requirements such those legislated by the Sarbanes-Oxley Act. The product comes with reports out of the box. Figure 1.13 displays the Audit Collection Services data flow.

With security information safely and centrally stored, the security officer can generate reports and analyze the data to look for potential security problems.
OpsMgr lets you view the information it gathers quickly and effectively. It is all well and fine that information is collected, but it is for naught if the information is not easily accessible. Operations Manager presents information in ways to make it easy to view, print, or publish.
Data collected includes availability, health, and performance statistics—invaluable information for analyzing what your servers and services are doing over the long term. To help review and understand the long-term trends and conditions of your servers and applications, OpsMgr generates reports both automatically and in an ad hoc fashion, including an easy-to-use graphical report designer that’s part of the Operations Manager 2007 console. The reporting capabilities allow you to generate sophisticated reports complete with titles, numeric information, text information, graphs, and charts.
In Figure 1.14, the Hydra computer shows some spikes in performance around midnight on 3/2/2007, which are the largest spikes captured in the graphs. This particular view actually displays several performance counters: percent processor time, processor queue length, and context switches. Using views gives you immediate access to information as it is collected, and you can adjust the view of that information quickly, perhaps to compare it with another system or examine other performance aspects, as we are in this particular view.
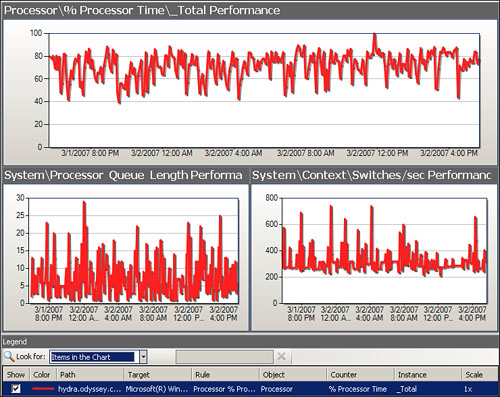
However, the display in Figure 1.14 does not tell us if what we see is normal performance for the computer because it only shows a 24-hour period.
We can also visually put the CPU utilization spike in context by seeing what a longer-term CPU utilization looks like for that system. Views, such as the one displayed in Figure 1.14, give us a quick look at the data. We can access the long-term view of historical data using the Reporting Component. The Performance Top Objects report shown in Figure 1.15 shows performance for Hydra and several other systems, but includes a range of what Operations Manager has determined is normal activity for the week and a standard deviation.

You may notice an Actions section circled in the middle of the report that allows you to open other reports of interest. For example, selecting Performance details opens a Performance Detail report for Hydra, displayed in Figure 1.16. This report gives a graphic drilldown on the minimum, maximum, and average values for the week, along with the standard deviation, which is the degree of variation for those numbers. You can expand the Actions section on this report as well to see additional reports or views. With just a few mouse clicks, we now know that the average processor utilization is about 70%. Knowing what is normal can be half the battle when troubleshooting!

Reports are static once generated, whereas views are interactive and will update as the underlying data changes. Reports can be exported as XML, saved in CSV, TIF, Excel, or PDF format, or published as HTML (MHTML) files using the Web Archive option. The HTML option is particularly powerful because it allows you to generate reports to publish for general viewing. The only requirement is having a browser and access to the web page, which allows IT to schedule reports showing routine stats, uptime, and so on, easily and effectively. You can email reports in PDF format to specified recipients. We discuss reporting capabilities in detail in Chapter 8, “Configuring and Using Operations Manager 2007,” and report development in Chapter 23, “Developing Management Packs and Reports.”
You can generate historical reports of what has happened over any period the data is collected for use with long-term trending and capacity planning. As we just discussed in the “Using Views” section, you can also look at the information as it is collected in real time for a snapshot view of what is happening within your organization, drilling down into detailed specifics as needed.
Access to a long-term view of information can help you detect trends and patterns otherwise hidden in a snapshot view. Recall our previous example, in the “Lack of Historical Information” section of this chapter, where the IT staff called out that CPU utilization was at 50%. Using Operations Manager, we can look at the historical information and see this was actually a normal condition. Using the same process, we can detect increases in network utilization and diagnose the problem appropriately. With OpsMgr at work, the IT staff might not even need outside consulting services!
As you might suspect, the amount of data collected from all these information sources can be quite massive. To handle this flood of data, Operations Manager uses the Microsoft SQL Server 2005 database platform for centralized storage of data, collecting and storing the reporting data in a separate database from the operational information. The Operations database is used for viewing current and historical data, performance statistics, and availability data. A data warehouse separately maintains data used for reports. Storing historical data separately allows OpsMgr to respond quickly to operational situations while enabling access to historical information in the data warehouse. This capability is invaluable for a system administrator trying to understand what his servers, services, and applications are really doing.
Tip: A New Type of Data Warehouse
With OpsMgr 2007, data transfer to the data warehouse is near real time; as operational information is collected from the monitored systems, it is also aggregated and written to the data warehouse, available with virtually no latency, and accessible for long-term usage.
As an example, Operations Manager can produce system and service availability reports to help keep the organization in line with its SLAs. These reports can be invaluable for managers proving the value of IT initiatives or driving home the need for IT improvements. Figure 1.17 shows a 7-day availability report. The Operations console Reporting function generated this report as a PDF file, without requiring use of any additional software. Within the console, you can schedule reports to be automatically generated. These reports can then be emailed or posted to a file share. The report output can be in the following formats: an Adobe Acrobat PDF, Excel, CSV comma delimited, TIF image, Web Archive, and XML file with report data.

As soon as OpsMgr is installed, it begins to use its built-in expertise. Management packs, models containing a comprehensive set of predefined rules that form an expert system, focus on the health of your systems and will alert you to significant events, suppress unimportant data, and correlate seemly unimportant information to identify potential underlying problems. Rather than simply collecting a ton of information for the administrator to sort out, OpsMgr uses its knowledge to decide what is important, what’s not, and will escalate as needed. When it determines a downgraded change in state has occurred, OpsMgr alerts appropriate personnel that you identify. Before escalating to a live person, Operations Manager can automatically respond to various situations, such as restarting stopped services. These actions are accomplished with management packs, which are collections of objects including monitors, rules, alerts, tasks, and reports.
Management packs contain the knowledge, in essence the gray matter, from Microsoft’s best people. These include the product support teams, developers, and vast resources of TechNet, Microsoft’s technical database. This expertise is enhanced with the local expertise within your organization. Knowledge is added as alerts are generated, troubleshooting is performed, and problems are resolved, thereby enhancing the system. Similar to a human expert, OpsMgr improves its skills and capabilities over time. OpsMgr looks for changes in the state of an object. After alerting the appropriate personnel, it assists in resolving the problem by providing detailed knowledge including historical performance and event information, suggestions for fixes, direct links to tasks to resolve the problem, and pointers for where to research further.
As shown earlier in the Alert Details pane in the lower part of Figure 1.11, the highlighted alert contains concrete and specific guidance on what it means, the possible causes, possible resolutions, and where to get additional information if needed. In some cases the Alert Details pane does not show the entire contents of the knowledge for a particular alert, so we duplicate the full text of the Product Knowledge tab in the following sidebar. While in the console, you could click the View additional knowledge link in the Alert Details pane in Figure 1.11 to launch the alert properties window with the product knowledge text in it.
As issues are resolved, OpsMgr learns over time and builds that experience into its knowledge repository. If the situation recurs, OpsMgr is ready to provide the knowledge of what happened before and how it was resolved.
Operations Manager 2007 includes monitors and rules in management packs that keep tabs on your services and applications. OpsMgr focuses on the health of an application. Management packs are containers that include what we call service models, these use the SMLs discussed earlier in the “Microsoft’s Dynamic Systems Initiative” section of this chapter and are formal definitions of types of objects. OpsMgr captures knowledge through models, putting knowledge in a structure the software can act on.
Management packs describe what we call classes. We don’t see classes anywhere in the Operations console, and that is by design. Classes are a concept, we can describe things about them. A class is a type of object. A database is an object, and it has common types of properties, regardless of the server it runs on. Properties give us a common way to describe a database—it has a name, an owner, and other assorted attributes.
We can describe what makes up a database, and we can describe a relationship between other objects. A Microsoft SQL database has to run on a SQL Server—so it has to have some type of relationship with the SQL Server. The SQL Server runs on a Windows computer—so it has some relationship with the Windows computer. These relationships come into play when building management packs.
As an example, let’s say we want to monitor a particular SQL database. We can define a relationship between that particular database instance and associate that database with its SQL Server engine, which is its parent object. If there is a fault condition on the database, it reports up to the parent. This changes the SQL Database Engine state in the Operations console, and the information flows up to the computer, which is the parent for the SQL Server, and its state. State is the focal monitoring point. In Operations Manager 2007, changes in state trigger alerts; when the alert is resolved, the state changes to healthy. Using the Distributed Application Designer, we can also define a relationship between the database and applications that use it.
By incorporating models and methods for monitoring in its management packs, OpsMgr uses a structured approach to determine if there are situations requiring attention.
OpsMgr continually monitors, helping ensure there are no missed events. The system also understands that certain events should take place and can generate an alert if those events do not occur. A special type of rule checks for a condition to occur within a defined time frame, such as every day between midnight and 5:00 a.m. If the specified condition does not occur within that time frame, that information is caught and an alert is generated, thus helping you to catch and take action on problems such as missed backups—one of the more useful items to check for in terms of a job not executing. Still, OpsMgr needs to be told to watch for the event; it is not quite smart enough to do what you’re thinking or to catch what it isn’t looking for.
OpsMgr uses its built-in knowledge and self-tuning capability to correlate different types of information and changes in state, ensuring that it alerts only when needed, typically reducing the number of alerts to a fraction of the underlying data. This capability reduces the flood of information typical management systems generate, allowing you to focus on what is important to keep your system up with optimal performance.
Operations Manager does all this easily and automatically. OpsMgr can automatically scan the network and install agents without any administrative intervention (although this is not turned on by default). You can even establish an Active Directory Organizational Unit (OU) managed by Operations Manager; OpsMgr uses that information to determine the management group an agent belongs to and the management server with which the agent will communicate. Updated rules and management packs are distributed automatically, helping you deploy your management infrastructure quickly and effectively. With its central console, OpsMgr allows you to implement a consistent systems monitoring and alerting policy to all your systems. Agents perform monitoring and apply the specific business logic and models for each monitored computer, automatically updating each system with the appropriate logic. Operations Manager also automatically removes business logic rules from the distributed systems, once the specified conditions no longer apply.
OpsMgr is scalable to all sizes of organizations, performing well even as it scales. The same product and basic architecture can be used to support medium, large, and enterprise-sized organizations with their varied requirements:
It works well for medium-sized organizations, where you would have a single AD forest and between 30 and 500 servers to monitor. If you are planning to manage less than 200 Windows-based computers, you can install everything on a single box that is appropriately sized and configured (or separate the SQL components for improved performance).
It works for large organizations, where fault tolerance and performance might be critical factors in the requirements. In this case, OpsMgr supports redundant and load-balanced components to ensure that a single managed server can monitor up to 2500 systems with no loss of performance or service.
It also works well for enterprise organizations, where fault tolerance, performance, and organizational divides must be bridged. OpsMgr supports communication between an infinite number of connected management groups, capable of using a hierarchical architecture to handle a large organization’s requirements, in addition to its redundant and load-balancing needs. Moreover, while scaling, Operations Manager still provides the cohesive view needed for a centralized management model.
Tip: Monitoring for Small-Sized Organizations
The smallest-sized organizations can use System Center Essentials, which uses a simplified version of the OpsMgr engine and supports up to 30 monitored servers. More information is found in the “System Center Essentials” section of this chapter.
Operations can be monitored through a console or a web interface. The console has views into the collected information—be it state, events, diagrams, alerts, or performance. You can also view reports. You can even view the status of your IT systems in a graphical diagram view that rapidly shows you the status of all systems, as in Figure 1.18, which shows the current Active Directory status. The highest-level state is shown in the state of the group, found at the top-left side of Figure 1.18. In this particular example, the highest-level state is Healthy, immediately letting us know that directory services are functioning properly in our Odyssey.com domain. We can also drill down into more detailed status of any particular component that has a plus sign (+) next to the diagram, indicating the view can be expanded.

Operations Manager 2007 can be deployed from medium to enterprise-sized organizations. Its flexibility also allows you to start small, managing a specific group of servers or a department. Once you are comfortable with the management platform, you can then scale it up to the rest of your organization.
With OpsMgr handling your monitoring needs, you as an operations manager can relax (somewhat!) knowing that you will be alerted when there is a problem and have help in resolving it. It is like having your own IT genie on the job 24×7! But it won’t take your job, not if you read this book.
Beginning with MOM 2005, Operations Manager has been aligned with System Center. System Center is an umbrella or brand name for Microsoft’s Systems Management family of products, and as such will have new products and components added over time. System Center is not a single integrated product; it represents a means to integrate system management tools and technologies to help you with systems operations, troubleshooting, and planning.
Different from the releases of Microsoft Office (another Microsoft product family), System Center is being released in “waves.” The first wave included SMS 2003, MOM 2005, and System Center Data Protection Manager 2006; the 2006 additions included System Center Reporting Manager 2006 and System Center Capacity Planner 2006. The second wave includes Operations Manager 2007, Configuration Manager 2007, System Center Essentials 2007, System Center Service Manager, Virtual Machine Manager 2007, and new releases of Data Protection Manager and System Center Capacity Planner. (Most of these products are available as we are finalizing this book, with the exception of Capacity Planner and Service Manager.) And if that’s not enough, there are already discussions of a third wave.
Microsoft System Center products share the following DSI-based characteristics:
Ease of use and deployment
Based on industry and customer knowledge
Scalability (both up to the largest enterprises and down to the smallest organizations)
The data gathered by Operations Manager 2007 is collected in a self-maintaining data warehouse, enabling numerous reports to be viewable using the Operations console. OpsMgr 2007 reports are now interactive and can launch other reports, console views, and tasks. Reports can also be exported to a Report Server file share; using the Web Archive format retains links. You can configure OpsMgr to schedule and email reports, enabling users to open these reports without accessing the Operations console. Approximately 150 reports are available out of the box. Reporting in MOM 2005 used the System Center Reporting Manager product released with the first wave. With the second wave, the Reporting Manager capability is moving under the to-be-released System Center Service Manager product and is no longer a separate product.
Microsoft rebranded its SMS v4 product as System Center Configuration Manager (ConfigMgr), Microsoft’s renamed and revamped systems management solution for change and configuration management. Like OpsMgr, the product is completely rewritten. Microsoft focuses Configuration Manager on addressing simplicity, deployment, security, and configuration. Features in ConfigMgr 2007 include the following:
Network Access Protection (NAP), a policy enforcement platform, is built in to the Microsoft Windows Vista and Windows Server 2008 operating systems. NAP helps protect network assets by enforcing compliance with system health requirements, including enforcement across most common network access scenarios. This technology extends the Quarantine Access Control solution, previously only applicable in Microsoft Virtual Private Network (VPN) scenarios, to wired and wireless computers on the local area network (LAN), including clients using Dynamic Host Configuration Protocol (DHCP) for Transmission Control Protocol/Internet Protocol (TCP/IP) address assignment.
Operating system deployment with the Windows Imaging (.wim) file format used with Windows Vista, is a technology based on the Operating System Deployment (OSD) Feature Pack available with SMS 2003 (note the OSD piece is also completely rewritten).
A simplified user interface (UI), including enhanced multiple selection and drag-and-drop operations, is based on version 3 of the Microsoft Management Console (MMC).
Software updates no longer use the legacy SMS software distribution components (packages, programs, and advertisements) when distributing software updates to clients. ConfigMgr now creates software update packages using simpler native technologies and uses WSUS 3.0 for software distribution.
Maintenance windows, based on computer collections, are rules applied to a collection of clients that prevent those systems from executing programs in packages, running the Software Updates Component, and launching any Operating System Deployments except during the time specified in the window. (Other client actions such as policy refresh, inventory, package downloads, and desired configuration monitoring can still occur.)
For software distribution, branch distribution points allow small office locations to host software packages on workstation computers without requiring the equivalent of an SMS secondary site. Package transfers to the branch distribution points trickle across the corporate wide area network (WAN) or VPN according to bandwidth-controlled settings using the Background Intelligent Transfer Service (BITS).
System Center Essentials, also called Essentials, is a System Center application for the small to medium-sized business that combines the monitoring features of OpsMgr with the inventory and software distribution functionality found in ConfigMgr. The monitoring function takes the form of a simplified OpsMgr 2007 engine that can use OpsMgr 2007 management packs, and the software distribution function is performed by the WSUS version 3.0 engine. Essentials is a wraparound shell and user interface for these functionalities in a small business network, including the essential features for monitoring, managing, and reporting as well as change and configuration management.
Using Essentials, you can centrally manage Windows-based servers and PCs, as well as network devices, by performing the following tasks:
Monitor the health of computers and network devices and view summary reports of computer health.
Centrally distribute software updates, track installation progress, and troubleshoot problems using the update management feature.
Centrally deploy software, track progress, and troubleshoot problems with the software deployment feature.
Collect and examine computer hardware and software inventory using the inventory feature.
Essentials provides a subset of the OpsMgr 2007 functionality when it comes to monitoring and managing infrastructures. The flip side of this reduced functionality is that Essentials greatly simplifies many functions compared to its OpsMgr 2007 counterparts. For example, by default the Discovery Wizard in Essentials automatically searches for both Windows computers and SNMP-based network devices in the Essentials server’s domain and local subnet—without requiring the user to enter any networking information.
Customization and connectivity options for Essentials are limited, however. An Essentials deployment includes a single management server; all managed devices must be in the same Active Directory forest. Reporting functionality is included, but it is not as robust as that included with Operations Manager 2007.
Essentials also limits the number of managed objects per deployment to 30 Windows server-based computers and 500 Windows non-server-based computers. There is no limit to the number of network devices. Chapter 2, “What’s New,” includes a full feature comparison of the differences between OpsMgr and Essentials 2007.
Using System Center Service Manager implements a single point of contact for all service requests, knowledge, and workflow. The Service Manager (previously code named “Service Desk”) incorporates processes such as incident, problem, change, and asset management. Just as OpsMgr is master of the MOF Operating quadrant, Service Manager will be an anchor for the MOF Supporting quadrant. Figure 1.19 illustrates the mapping between the quadrants of the MOF Process Model and System Center Components.

The Service Manager is Microsoft’s new help desk product and fills a gap in Operations Manager: What do we do when OpsMgr detects a condition that requires human intervention and tracking for resolution? Until Service Manager, the answer was to create a ticket or incident in one’s help desk application. Now, within the System Center framework, OpsMgr can hand off incident management to Service Manager.
Design goals of Service Manager include the following:
Utilizing Microsoft technologies that people already use or are familiar with; for example, Service Manager uses the SharePoint and InfoPath products for web portal and knowledge base functions.
Incorporating Self-Service Portal technologies to help organizations reduce support costs, including providing the administrator with a view into the overall performance of the IT environment using reports and dashboards.
Ready-to-use process-automated workflows based on the Microsoft Operations Framework using DSI models.
A Service Manager Solution Pack framework, similar to the Operations Manager Management Packs to enable customers and partners to develop additional custom functionality for the Service Manager.
A Configuration Management Database (CMDB) based on SML and XML schema. Microsoft is positioning the CMDB as the foundation of its asset and change-management capability.
Supported scenarios include the following Service Management Functions (SMFs) and capabilities from the MOF Operating and Supporting quadrants:
Incident management—. Creating incident records based on information in management tools
Problem management—. Identifying problems by searching common incidents
Asset management—. Tracking movement and ownership of hardware assets
Change management—. Reviewing and approving change requests
Self-Service Portal—. Resolving an issue without calling the help desk
Service Manager utilizes a Winforms console, which has an appearance similar to Outlook and Operations Manager. It uses the OpsMgr agent, and the console will have the ability to run OpsMgr tasks. Service Manager brings the “designed for operations” moniker full circle by providing a means to feed production and user data back into the development process using Visual Studio.
System Center’s Data Protection Manager (DPM) 2007 is a disk-based backup product for continuous data protection supporting servers running Windows 2003 Service Pack (SP) 1 and above. (The DPM Server itself must have SP 2, and x64-bit Windows Server is recommended.) DPM provides byte-level backup as changes occur, utilizing Microsoft’s Virtual Disk Service and Shadow Copy technologies.
Microsoft describes DPM 2007 as a “best of breed” product, adding support for tape media. The Enterprise Edition offers native protection for Windows applications such as Microsoft SQL Server, Exchange, SharePoint Portal Server, and Virtual Server, plus bare metal. This means that in addition to selecting file shares, you can back up SQL Server databases and Exchange Server storage groups. Via online snapshots, disk-based recovery can maintain backup points to a 15-minute window.
System Center Capacity Planner is designed to provide tools and guidance to determine an optimal architecture for successful deployments, while also incorporating hardware and architecture “what-if” analyses for future planning. The Capacity Planner assists with planning deployments of Operations Manager and Exchange Server.
In conjunction with the second “wave” of System Center, the newest version of Capacity Planner will include a model with OpsMgr 2007 support for ACS; modeling gateway servers; backup servers for the Operations database, RMS, and data warehouse; 64-bit hardware support; database sizing recommendations and support for background loads; trusted and untrusted agents; and an enhanced predeployment wizard. Planning will be more granular to include different branch configurations and be component based.
Capacity Planner will only support OpsMgr 2007 installations running Operations Manager SP 1.
The Capacity Planner creates models with information on topology, hardware, software, and usage profiles. It also allows you to run iterative simulations on the models for performance information. Capacity Planner ties into the DSI strategy by identifying when systems deviate from a defined performance model, providing guidance to correct those variations.
System Center Virtual Machine Manager is a standalone server application, providing centralized management of your Windows Virtual machines. It currently supports Virtual Server 2005 R2, and Windows Server virtualization will be supported with the Microsoft Windows Server 2008 operating system.
Virtual Machine Manager enables increased physical server utilization, centralized management of a virtual infrastructure, and rapid provisioning of new virtual machines by system administrators and users via a self-service portal.
The value of Operations Manager lies in three areas:
Increasing the quality of service that IT departments deliver to their business units
Reducing the operational cost to deliver that service
Delivering a best-of-breed tool for Windows Management
As a management tool monitoring system health, Operations Manager is designed as a best-of-breed monitoring solution for the Windows Server platform, providing enterprise scale and operations management. By incorporating a rich application and service monitoring environment using its management packs, OpsMgr provides a high level of automation.
As an enterprise-ready solution, OpsMgr provides redundant support and high availability with an open architecture—a requirement for computing enterprises that encompass multiple environments that include non-Microsoft platforms. Operations Manager is extensible, so it can integrate with other computing environments including third-party management suites such as Tivoli’s TEC, HP OpenView, and the HP Network Mode Manager.
Operations Manager 2007 can monitor, manage, and secure a wide range of resources, including computers, applications, server farms, e-commerce sites, network devices, and corporate servers. It supports networked systems scaling up to thousands of computers on the network. OpsMgr can continuously monitor user actions, application software, servers, and desktop computers running Microsoft Windows 2000 and later versions.
The goal for the IT manager considering OpsMgr is to lower the cost of deploying and managing Windows solutions. This goal includes the “time to resolution”—or how rapidly the IT manager can get an understanding of what is happening in the operating environment and then automatically (or as quickly as possible) achieve a resolution. Operations Manager 2007 (when correctly tuned) is positioned to help you tame the fire hose (as shown in Figure 1.20) and control the deluge of system and operational information pouring at you from across your operating environment. It is a key component of DSI.

Out of the box, Operations Manager 2007 hits the ground running by supporting key applications such as SQL Server, Microsoft Exchange, and Active Directory. What’s more, Microsoft has announced management packs for the second quarter of 2008 that will include support for all the Windows Server 2008 roles. OpsMgr’s model-based management packs include monitors, rules, alerts, tasks, best-practice knowledge, reports, and templates, requiring little or no configuration or setup for the majority of applications. Its Distributed Application Designer provides the flexibility to design your own management packs with a Visio-like interface that generates the rules behind the scenes.
OpsMgr’s huge body of expertise solves one of the major obstacles that many enterprise management solutions encountered prior to the availability of Microsoft’s product. Most of the big framework management platforms, such as Unicenter TNG, HP OpenView, and Tivoli TEC, provide an infrastructure that has the potential to do great things, and they are sold based on that potential. After a company has spent mucho dollars to deploy the infrastructure, the hard work of configuring the product begins. Sometimes, due to the difficulty of configuration, the plug is pulled on these framework products, which leaves a bad taste in the mouth of the company after apparently wasting its money.
OpsMgr completely changes the paradigm by shipping the product with the vast majority of the configuration done for you. This instant return on investment provides a huge win when the system starts detecting operational problems, alerting the appropriate personnel, resolving issues, and providing extensive reports with little or no IT effort.
This chapter introduced you to operations management. You learned that operations management is a process to enhance the supportability of a production environment. The chapter illustrated how Operations Manager can solve a horde of problems. System Center Operations Manager 2007 works to eliminate the isolated islands of information in your shop, notifies you of problems, and maintains a historical database of what happened and how issues were resolved.
We discussed ITIL, which is an international set of best practices for IT Service Management. ITIL describes at a high level what should be accomplished, although not actually how to accomplish it. In furtherance of that process, Microsoft chose ITIL as the foundation for its own operations framework. With the MOF, Microsoft provides both descriptive (what to do and why) as well as prescriptive (how to do it) guidance for IT service management.
Microsoft’s management approach, which encompasses MOF and also DSI, is a strategy or blueprint intended to automate data center operations. Microsoft’s investment in DSI includes building systems designed for operations, developing an operationally aware platform, and establishing a commitment to intelligent management software.
Operations Manager is a tool for managing the Windows platform to increase the quality of service IT delivers while reducing the operational cost of delivering that service. Together with ConfigMgr and the other System Center products, OpsMgr is a crucial player in Microsoft’s approach to system management.
Management software is a key element in Microsoft’s strategy to convince corporate customers that Redmond is serious about proactive management of Windows systems. As we step through the different areas of this book, you’ll become aware of just how powerful Operations Manager is, and how serious Microsoft is about operations management.