
If you review Microsoft’s marketing materials and the white papers released about the System Center Operations Manager (OpsMgr) 2007 product, you will notice one of the three design pillars is end-to-end service management. OpsMgr achieves end-to-end (E2E) service management primarily with the Distributed Application feature, the subject of this chapter. Other E2E service management components of OpsMgr are the following:
Synthetic transactions (covered in Chapter 18, “Using Synthetic Transactions”).
Client monitoring and Agentless Exception Monitoring (see Chapter 16, “Client Monitoring”).
The Service Modeling Language (SML)-based system and health models (covered in Chapter 3, “Looking Inside OpsMgr”).
The first part of this chapter discusses and defines distributed applications in the systems management arena, and then covers in detail the built-in distributed applications provided by OpsMgr with the management packs that are included with OpsMgr. The second half of the chapter explores how you can leverage the Distributed Application features of OpsMgr to create custom management solutions that are a perfect fit for your organization’s business goals.
This question is particularly appropriate for our discussion. As Operations Manager 2007 basically reinvents the term, we must cover some new definitions. The term distributed application originated in the software development community; with OpsMgr 2007, it migrates to the systems management community with added meaning. In the following sections, we briefly explain the programming origins of the term, and then show how OpsMgr stretches out that concept to the next dimension.
The existence of distributed applications became possible with the invention of client/server computing. The capability for a single application to process and store data on both a central server and a client desktop led to the two-tiered distributed application. The earliest two-tiered distributed application, still enormously popular, is the database client, where the client application on the user desktop interacts directly with the database application on the network server.
However, for the larger enterprise, there emerged almost immediately a market for middleware, also known as business object applications or business logic. Middleware acts as the data-processing intermediary between the client and the back-end service. Implementing middleware created the classic three-tier distributed application, often used as a model for intranet-based enterprise applications. A distributed application has three logical tiers—data, business logic, and the user interface—which are described here:
The data tier is a database such as Microsoft SQL Server.
The business logic tier handles accessing the data and distributing it to the clients; it is the brain of the three-tier application.
The user-interface tier (or presentation tier) often consists of both a web browser-based application and/or a traditional Windows application.
Figure 19.1 illustrates the classic three-tiered distributed application familiar to software developers.
Stratifying and segmenting a complex distributed application into defined tiers essentially creates software containers. Developing standardized software containers to host application components helps considerably in shortening development lifecycles for large applications. This approach allows optimizing subordinate functions within the tiers, yet keeps the focus of the development effort on the overall distributed application.
With distributed applications, it is not unusual to see release cycles of six months or fewer for major enhancements, and three months or fewer for minor feature additions. The application development industry has thus experienced great success by adopting the distributed application model. Using the distributed application model has markedly increased the agility of organizations, facilitating rapid roll out of major features to enterprise applications in response to changing demands and opportunities.
This leads to an emerging paradigm, however: Because programmer-facing component models that simplify development have enjoyed such success, complexity is shifting to the operations side of managing these applications! The professional development community got their act together when it comes to rapid response to changing business goals; the widespread adoption of the distributed application development methodology has had a greatly beneficial effect on the opportunities, professionalism, and increased business value of the software development community.
Now, the systems management community is under similar scrutiny to seek efficiencies and apply holistic methodologies to their areas of responsibility. In particular, there is a clear systems management responsibility to keep up with the rapid pace of release updates to business-critical enterprise applications. Although the development side of the house may have a streamlined and efficient change management solution, the systems management team maintains responsibility for monitoring application performance and availability in production—even with a high and increased rate of application change.
As an application transitions from development to production (the release management stage), gaps in management control can occur unless the management system is prepared at that time to begin delivering service delivery metrics on the application. For pre-packaged applications, one hopes that the software vendor releases an OpsMgr management pack supporting whatever new features are in the application. However, for custom enterprise distributed applications, the burden for designing a monitoring solution falls on the Information Technology (IT) staff in that organization.
IT needs to identify whether distributed application problems stem from a failed host, application process, network component, or other infrastructure failure. Even with a perfect monitoring infrastructure in place, it is beyond most humans’ capability to synthesize the raw state of hundreds or thousands of component monitors and determine the root cause of distributed application failures. The system administrator needs a holistic way of viewing and managing the complex distributed application, processes that are also capable of rapid revision to keep in step with application change releases.
A holistic approach to managing complex systems results in better results than trying to manage many sub-systems independently. (Aristotle’s observation that “The whole is more than the sum of its parts” rings true as an early proof statement of this concept.) An OpsMgr Distributed Application (DA) is the framework for integrating meaningful metrics of the usability of a complex system composed of many subordinate components, such as the software containers (and the hardware hosts) of that application.
Integration and synthesis are pursuits related to holism, that being the intellectual processes our brains use to create the whole from the parts. Synthesis is one of the higher functions in our human brains, and appeals to the seeker of a holistic approach to IT management. Using OpsMgr, a new paradigm emerges—systems management professionals are being provided with a tool we can use to encapsulate the problem-solving processes in our heads.
Let’s take a real-world example: A system administrator gets a phone call in the middle of the night—a critical e-commerce application is down. What starts going through his (or her) mind? What does he check first, what are the things to look at, what is the decision tree? You can capture those diagnostic decision trees, apply your collective event integration and synthesis knowledge, and transfer that information to an OpsMgr 2007 Distributed Application.
The OpsMgr DA represents your best bet for defining what you really need to monitor for delivering your business-critical services. See the contrast between these problem-resolution techniques:
Without a holistic means to view the health of the e-commerce application, the administrator must pour over the status of disk arrays, network devices, firewalls, server processes, and many more components.
Sometimes, the administrator can spot an obvious failure point. However, it is just as likely that a cascading series of less-obvious failures has occurred in one or more distributed application components. This can lead to a time-consuming troubleshooting chase involving a lot of people!
Using a previously created OpsMgr DA that clearly defines the components involved in delivering the e-commerce application, a quick look at the Health Monitor for the application reveals the source of the outage. The effective design of the OpsMgr DA has already done the troubleshooting work. Targeted recovery operations can begin immediately to get the e-commerce application running.
How far can we take this concept? An ambitious but achievable goal of an advanced network management system is to enable a synthesis function in the monitoring engine, a step along the road toward Artificial Intelligence (AI) in back-end support systems. If the management software can synthesize large amounts of highly diverse time-disparate data, it can do some front-line thinking for us, employing techniques that determine how application environments can configure and heal themselves when there are problems.
It has been postulated that increased operational complexity has reached a point where it is no longer feasible for humans to manage the applications required for running an enterprise. OpsMgr Distributed Applications are an early tool to facilitate self-managing applications—a paradigm known as “autonomic computing,” the ultimate expression of zero-touch and lights-out network management principles.
Learning how to leverage the DA feature in OpsMgr not only equips you to deal with the middle-of-the-night phone calls; it is a foundation for a new approach—one that foreshadows eliminating those midnight calls.
Distributed applications run on many different physical tiers and often scale out over the Internet, or over disparate and different networks. In the Microsoft world, there are three such applications that most OpsMgr administrators will encounter, and that Microsoft has provided predefined services for monitoring:
Figure 19.2 highlights these three services at the Distributed Applications global view in the Operations console. In the next sections of this chapter, we will describe how you can use each of these services effectively.
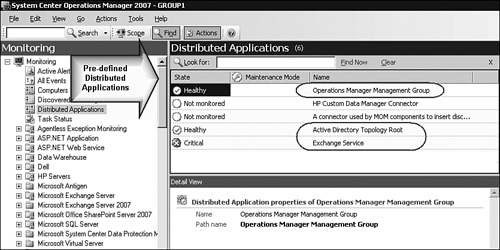
The action of installing an OpsMgr 2007 management group automatically creates this DA, so you will find it in every Operations Manager 2007 management group. Even before importing any management packs, this service is visible in the Distributed Applications view. We encourage you to become familiar with the features available in the Operations Manager Management Group DA, as that is where Microsoft has tried to make data relevant to the functioning of the OpsMgr product easy to access.
As you review the health of your management group, a great technique is to flip (or pivot) through the different views that are available by right-clicking on the Operations Manager Management Group DA, starting with the Health Explorer. The “master view” for any DA is the Health Explorer; this is what you will open first after that middle-of-the-night phone call.
Figure 19.3 shows the Health Explorer for the Operations Manager Management Group DA, focused on a low free space alert in the Operations database.

Also in Figure 19.3, we highlight some branches of the health model to point out the many different functions that can be bundled into a DA. In the upper portion of the view, notice that each gateway server is watched as part of the Gateway Management Server Group Availability Health Rollup. Lower down in the view, notice that three aspects of the SDK service are watched: database connectivity, port availability, and the Windows service. These features highlight the broad scope of monitoring that a DA can perform.
There is an Alerts view for the Operations Manager Management Group DA, shown in Figure 19.4. We customized our view to include the Last Modified time and the Repeat Count of the alert, as this helps triage the alerts listed.

The Alerts view of the Operations Manager Management Group DA, displayed in Figure 19.4, is a convenient feature since it segregates alerts dealing just with the health of the OpsMgr management group. Similarly, a Performance view is available that contains just the monitors Microsoft believes are relevant to assessing the health of the management group. Figure 19.5 shows the Performance view of the Operations Manager Management Group DA.
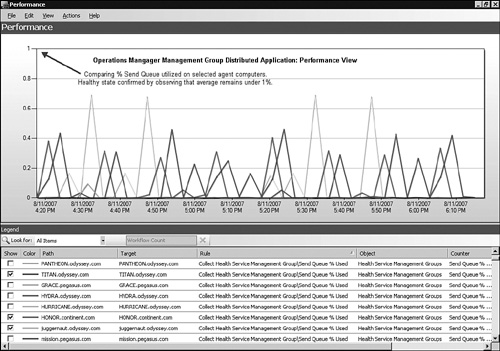
In Figure 19.5, we selected the Send Queue % Used performance counter of a sample agent population to verify there are no unexpected connectivity issues between agents and management servers. If any send queue exceeds what is normally a near-to-zero quantity, it indicates a problem with agent communication. Microsoft makes available a variety of pre-selected counters from both agents and management server components to add to the Performance view. An intelligence feature of the DA is the pre-selection of the counters available in the console.
The most advanced view available for a DA is the Diagram view. This view allows you to discover containment and dependency relationships between application components that you cannot observe in the other views. Figure 19.6 shows the Diagram view of the Operations Manager Management Group DA.
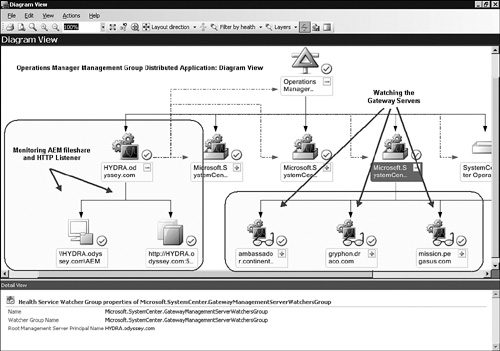
Notice in the Diagram view in Figure 19.6 (on the left side), we circled the processes that are watching the file share and HTTP listener components of the Agentless Exception Monitoring (AEM) service. That is just one small section of the DA Diagram view we selected to expand—when using the Diagram view, you can expose just the portions of the application you want to look at.
In some ways, the Diagram view of a DA presents the same information as the Health Explorer. For example, in the Diagram view shown in Figure 19.6, we highlighted (on the right side) the watcher processes for the gateway servers. These correspond to the availability monitors circled in the top portion of the Health Explorer shown in Figure 19.3.
The main difference in presentation between the Health Explorer and the Diagram views is that you can interact with objects in the Diagram view by clicking and dragging them, rearranging the objects in the view. Doing so causes the solid (containment) and the dotted (non-containment) lines to move with the object. This capability lets you spot relationships between components that you might not otherwise detect. We will drill down into all the advanced features of the diagram view later in the “Creating a Distributed Application Health Model” section of this chapter.
A take-away from reviewing the Operations Manager Management Group DA is that a well-authored DA can save you a lot of time when it comes to assessing the health state of the application. By identifying the classes of objects that are involved in delivering the application (and their relationships), and then collecting sets of targeted views that focus on the service delivery of the application, knowledge is encapsulated, preserved, and made portable.
Tip: Forests and Predefined Distributed Applications
The three predefined applications have different behaviors in a forest environment. The Operations Manager Management Group DA is forest-neutral. All Active Directory forests that have computers with management group components installed will participate in the DA. The Active Directory Topology Root is specific for the forest of the management group; it does not monitor other forests’ Active Directories. The Exchange Service DA does cross forest boundaries, and recognizes the managed Exchange Organization of any forest.
Microsoft’s Active Directory (AD) Service, so integrated with Windows networking, itself is an archetypal distributed application. Active Directory components can be on a single physical server for a small business, or distributed across hundreds of domain controllers for a global enterprise. In its simplest, small business implementation, all that matters is the local authentication experience for user workstations; whereas for the larger enterprise, you want to monitor Active Directory processes such as inter-site replication.
Microsoft provides management packs to monitor both the client experience and the server-side components of Active Directory. Appendix A, “OpsMgr by Example: Configuring and Tuning Management Packs,” includes instructions for installing the Active Directory management packs. After importing the AD-related management packs, enabling the agent proxy setting on all domain controllers, and configuring an account for replication monitoring, you will want to perform the following steps to enable the client monitoring perspective:
In the Authoring space of the Operations console, navigate to Management Pack Objects -> Object Discoveries.
Locate the AD Client Monitoring Discovery rule. This rule is disabled by default. Use overrides to enable this rule on desired AD client monitoring systems.
Do not enable client monitoring on all your member servers or desktop client computers. Too many clients running the synthetic transactions of these monitors can degrade your AD deployment. Either create a new group with explicit members, or decide to use an existing group that is already a subset of your AD client computer population. We will select an existing subset of client computers, those already identified as Business Critical.
Right-click on the rule and select Overrides -> For a group. Select your group; in our case, we selected the All Business Critical Windows Clients.
On the Override Properties page, tick the Override box and change the Override Setting drop-down value to True. Select your custom management pack (not the Default management pack) as the destination and press OK.
Within several minutes, state views and performance data from the selected AD client monitoring computers will begin appearing in the console. The left-hand side of Figure 19.7 exposes the majority of the Monitoring view folder tree added to the console when importing the client and server AD management packs.

In Figure 19.7, we circled the View folders for the server, client, and replication monitoring aspects of the AD management packs. In the Results pane, we have populated the dashboard view with metrics from business critical client computers related to the client AD experience, such as Client GC (Global Catalog) Search Time. You can see in the left-side Navigation pane that there are a number of very specific dashboard and performance views covering each aspect of AD health.
What procedure should you follow to assess the overall health of AD? It’s not actually necessary to open every AD view node in the Monitoring space, as Microsoft has included a DA with the AD management packs named Active Directory Topology Root. By examining the Health Explorer of the Active Directory Topology Root DA, you know that you are looking at a meaningful and accurate representation of your overall AD health. To illustrate the power of this DA, we extracted the principal monitors that constitute the health model for the Active Directory Topology Root DA and show those in Figure 19.8.

The monitors listed in Figure 19.8 exist for each domain controller in each AD site, from the AD Database Free Space Monitor to the AD Processor Overload Monitor. Regardless of how distributed or compact your AD deployment is, Operations Manager looks at all those listed health factors. Consolidating these many different kinds of monitors, all relating to AD performance and availability, into a single view is an example of how OpsMgr helps you perform synthesis and integration to solve problems.
Tip: Install an Agent on Your DCs First
If you import the Active Directory management packs before installing OpsMgr agents on your domain controllers (DCs), the DCs appear as Not Monitored objects in the Operations console Computers global view. This occurs because the Active Directory Topology Root DA discovers the DCs in the management group’s domain, and makes them objects in the management group. However, without OpsMgr agents, the DCs, now identified as objects, show up as unmonitored. To keep this from occurring, install an OpsMgr agent on your DCs before importing the Active Directory management packs.
Of course, the Active Directory Topology Root DA includes many other monitors than the principal ones listed in Figure 19.8. For example, physical dependencies of Active Directory are also included in the health model of the DA. Figure 19.9 shows the Health Explorer of the Active Directory Topology Root DA; in the upper portion, we highlighted the Logical Disk Availability and Free Space monitors of a domain controller.
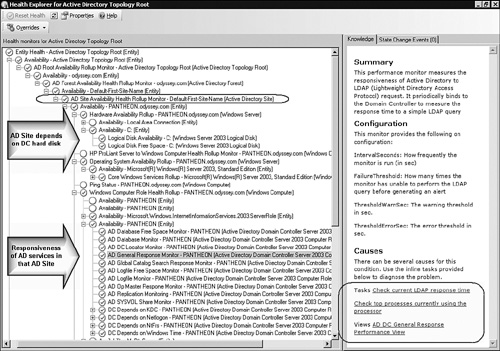
In the lower portion of Figure 19.9, we highlighted the selected monitor (the AD General Response Monitor), and circled the in-line tasks available in the lower-right corner. Using these in-line tasks, when investigating a problem with general AD responsiveness, you have one-click access to the following features:
Check current LDAP response time—. Verifying what the actual Lightweight Directory Access Protocol (LDAP) responsiveness is at this moment.
Check top processes currently using the processor—. If response is slow, perhaps a process is monopolizing the processor.
AD DC General Response Performance View—. Quickly look at the trending of LDAP responsiveness over the last few hours or days.
In-line tasks are another location for capturing knowledge in the DA model. The goal is that after using the Health Explorer to zero in on the cause of a problem, the tools for your troubleshooting decision tree are there where you need them. Tactical placement of in-line tasks can help accelerate your systems management workflow.
Finally, there is a very useful Diagram view available when working with the Active Directory Topology Root DA, shown in Figure 19.10. We used annotated arrows to point out each main feature of the diagram, and in the lower left, we circled the same Logical Drive monitor highlighted in Figure 19.9.

There are dedicated diagram views installed by the AD management packs at the Monitoring -> Microsoft Windows Active Directory -> Topology Views folder. These diagram views are AD Domains, AD Sites, Connection Objects, and Topology. Each view focuses on a particular aspect of AD health. The Diagram view of the Active Directory Topology Root DA shown in Figure 19.10 is a superset view that includes all the information you can see in the dedicated diagram views.
Microsoft Exchange Server is the world’s most popular groupware application, providing email, calendaring, and collaboration services to organizations around the globe. Due to its many features, highly scalable design, mission-critical status, and constant high-volume usage, Exchange is also perhaps the most demanding application to manage. Outages in Exchange-related services often have an immediate impact on possibly hundreds or even thousands of employees, customers, and business partners. There is no faster way to get the phone ringing in the IT department than to mess with people’s email access.
Exchange is a challenging application to manage, in part because it is also a highly distributed application. Within a single Exchange server, there are many interdependent components, such as the Mail Transfer Agent (MTA), the Exchange routing engine, and the Simple Mail Transfer Protocol (SMTP) service. These components (among other processes) work together to move a single message between the Internet and your mailbox. As an organization increases in size and adds additional Exchange servers, particularly as it creates other Exchange sites and installs front-end servers dedicated to Internet-facing communication, the complexity of your management challenge increases exponentially.
Traditional approaches to managing Exchange focus on server-level monitoring. Focusing at the server-level has scaling limitations; an administrator of a large Exchange organization trying to track down a problem can have a “needle in a haystack” situation when trying to discover the root cause. For example, if all the Exchange administrator is presented with is a server-centric health view, he or she must evaluate the health of each server in a critical or warning state (for any reason!) to locate which Exchange-impacting components might be involved on each computer. Meanwhile, the timeliness of problem resolution in a demanding Exchange environment is very important—thousands of people might be unable to work while waiting for the administrator to locate and fix the problem with their email.
Microsoft provides management packs to monitor all aspects of Exchange. Appendix A includes instructions for installing the Exchange 2003 management packs. This particular chapter discusses Exchange 2003, not all versions of Exchange. Mainstream lifecycle support for Microsoft Exchange 2000 ended on January 10, 2006, so anyone still running Exchange 2000 should primarily be concerned about upgrading to Exchange 2003 or Exchange 2007.
After importing the Exchange management packs into your OpsMgr Management group, you must perform the following actions:
Run the Exchange Management Pack Configuration Wizard in each managed Exchange organization.
Enable the agent proxy feature on each managed Exchange server.
Add each server to an override of the Exchange 2003 Topology Discovery object discovery rule.
You must perform those minimum configuration steps after importing the Exchange management packs.
The Exchange management packs add a large number of views to the monitoring space in the Microsoft Exchange Server folder, as well as eighteen reports in an Exchange Server 2003 (Monitoring) reports view folder. Figure 19.11 shows the monitoring folder expanded to show the more interesting views.
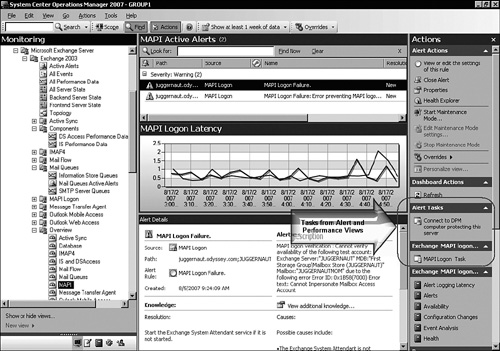
The Exchange management pack provides a rich management environment for focusing on a particular area of Exchange performance. In Figure 19.11, in the navigation pane on the left, we expand the Components, Mail Queues, and Overview folders. Most of the other View folders in the figure contain alerts and performance views; for example, the IMAP4 folder has an IMAP4 Active Alerts view and an IMAP4 Performance Data view. Here’s a quick drill-down on what’s in the View folders we expanded in Figure 19.11:
The Components folder has Directory Service (DS) Access Performance Data and Information Store (IS) Performance Data views. The counters in these views are mainly about LDAP search times and server loading; they are useful to track down the source of Exchange performance bottlenecks.
The Mail Queues folder lets you follow up on mail queue issues by quickly checking mail queue active alerts and charting recent metrics of SMTP and IS queues.
The Overview folder holds a dozen dashboard views, like the MAPI dashboard view seen in Figure 19.11. These dashboard views powerfully combine alerts and performance views, along with workflow-accelerating in-line tasks that create a true information fusion and synthesis center.
The Storage folder (not seen in Figure 19.11) contains an active alerts view and nine performance views to chart such metrics as Mailbox Average Size in MB and Public Folder Average Message Count.
Although you could spend all day wandering around the nearly 60 views installed by the Exchange management pack and learn a lot about each component of your Exchange organization(s), would this help you confidently and accurately assess the overall health of your Exchange services? To assist, Microsoft provides a tool that lets you perform high-level yet targeted health analysis on Exchange in real-time: the Exchange Service DA. Figure 19.12 shows the Health Explorer for the Exchange Service DA.

The Exchange Service DA has a richly detailed Availability rollup and a very simple Performance rollup monitor. Both health model rollups operate against multiple Exchange organizations; you can see in the top of Figure 19.12 that we are monitoring two Exchange organizations, and that the Pegasus Exchange organization is healthy and the Odyssey Exchange organization is in a critical state.
This multi-organization feature is a boon to hosted Exchange operators, Exchange Application Service Providers (ASPs), and Managed Service Providers (MSPs) responsible for the Exchange service of multiple customer or tenant organizations. Following the Exchange organization hierarchy, the health model rollups proceed to the Exchange Administrative Group, then the Exchange Routing Group, and finally the individual Exchange servers and their respective functions.
The lower portion of Figure 19.12 displays the Performance rollup. Notice that there are two branches, one for each of the Exchange organizations we are managing: Pegasus and Odyssey. Each organization’s branch continues through the Administrative and Routing Group structure, arriving at performance counters for the individual Exchange servers. We circled the individual server performance monitors. You can see that there is only one performance monitor per server in the health model: the Memory Pool Non-Paged Bytes Monitor.
As we noted, the Pegasus Exchange organization is healthy at this time—we expanded the Availability monitor for Pegasus in Figure 19.13. You can see the health monitor consists of nineteen subordinate monitors and rollups. There are three “checks,” where the management pack verifies the following:
The health of the Exchange services
The health of the Exchange front-end services
Whether SSL is enabled on the Exchange virtual web directories
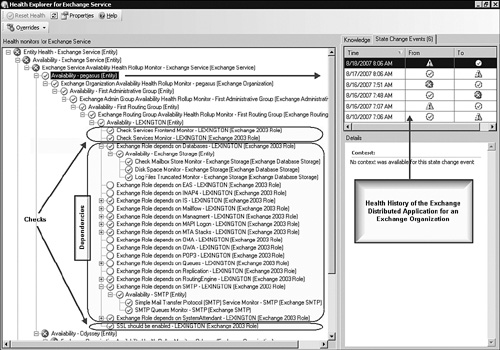
These are the first two and the last of the listed monitors, which we circled in Figure 19.13. The other monitors (which we labeled Dependencies) gauge the status of the objects that Exchange availability is dependent on, such as Exchange Storage, MAPI Logon, MTA Stacks, Routing Engine, SMTP, and System Attendant.
Notice on the right side of Figure 19.13, there is a record of state change events for the Pegasus Exchange organization. Although we know the service is healthy now, we can see that in the last week there have been problems. In fact, the state change record of the Exchange DA is a very meaningful history of the availability of Exchange, and one on which you can base a Service Level Agreement (SLA). For example, see that at 7:48 AM on 8/16/2007, Exchange in the Pegasus organization went into a critical state, recovering to the healthy state at 7:51 AM. That three-minute lapse in Exchange service could be accounted for by a server restarting; however, for a customer with a “five nines” (99.999%) availability expectation, this might represent an SLA violation.
Now let’s look at the other Exchange organization in our DA, the unhealthy one named Odyssey. Figure 19.14 shows the Availability monitor for Odyssey. We can see that there are two Exchange servers in this organization, front-end Argonaut and back-end Juggernaut, and both are in the critical state. We expanded the availability health rollup monitor for the back-end Exchange server Juggernaut.

We can tell that Juggernaut is a back-end Exchange server because the Mail Flow and MAPI Logon monitors are enabled (see the arrows in the central part of the Health Explorer in Figure 19.14). Those particular monitors are only enabled on back-end servers. At the bottom of the Health Explorer, we see why this server is in the critical state—the SSL should be enabled monitor. Unlike front-end Exchange servers, back-end Exchange servers do not require SSL on their Exchange web directories. So all we need to do to make Juggernaut healthy in the OpsMgr Exchange Service DA is to create an override for the SSL should be enabled monitor. We followed these steps to create the override:
In the Health Monitor for Exchange Service, select the SSL should be enabled monitor for the particular back-end server.
Right-click on the monitor and select Override the Monitor -> For a specific object of type: <servername>.
On the Override Properties page, tick the Override box and change the Override Setting drop-down value to False. Select your custom management pack (not the Default management pack) as the destination and press OK.
Within several minutes, the Availability state of the back-end server will change to healthy. Now we will look at the condition of the front-end server Argonaut, using the diagram view of the Exchange DA. The complete diagram for both our managed Exchange organizations (Odyssey and Pegasus) is far too large to present in this book in a readable form. For Figure 19.15, we arranged a continuous topology diagram with two diagram views side-by-side.
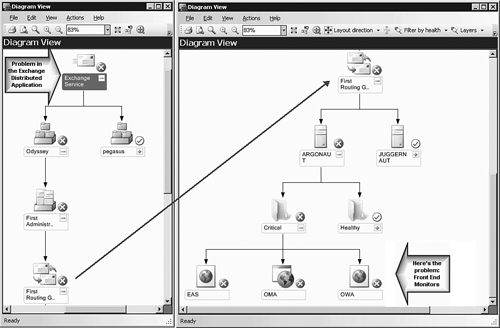
When we open the Exchange Service diagram seen in Figure 19.15, we see the two Exchange organizations: Odyssey in a critical state and Pegasus in a healthy state. By expanding the Odyssey organization through the Administrative and Routing Groups, to the involved servers, we can “follow the red” (X symbol) to track the problem. Arriving at the server with the problem (Argonaut), and expanding the diagram to the next level, it becomes very obvious that the problem was with the front-end monitors (EAS, OMA, and OWA). These front-end monitors perform synthetic logon to the Exchange Active Sync (EAS), Outlook Mobile Access (OMA), and Outlook Web Access (OWA) services on the front-end Exchange server.
A nice thing about the Diagram view, compared to the Health Explorer view, is that it segregates the unhealthy monitors, making problem identification much simpler than wading through hundreds of nested health model monitors.
Getting the front-end monitors to work in your Exchange environment will probably take some manual configuration. By default, the monitors will attempt to make an SSL connection to the “localhost” hostname and to the IP address hostname of the server. For example, the OWA monitor will perform a synthetic logon attempt using the URLs https://localhost/Exchange and https://<ServerIPAddress>/Exchange. Because your front-end Exchange server will generally have an SSL certificate issued in the server name of the front-end server, or in the name of the public-facing URL used on the Internet, the default URLs will fail.
To help the Exchange front-end monitors do their job, you need to create and populate some Registry values on the front-end server itself. These Registry values will contain the custom URLs that match your environment. Basically, the custom URLs need to match the name of the SSL certificate installed on the front-end server. Figure 19.16 shows the piece of the Registry with the custom URLs.
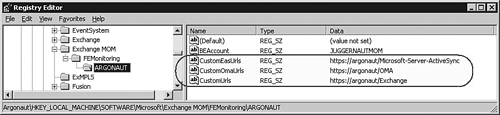
The Registry key highlighted in Figure 19.16, HKLMSOFTWAREMicrosoftExchange MOMFEMonitoring<servername>, is automatically created when you run the Exchange Server Management Pack Configuration Wizard. However, the only value expected to be present is the BEAccount (back-end account). The BEAccount value represents the name of the mailbox test account on the back-end server. You need to manually add the three custom URL values in the manner shown in Figure 19.16.
Tip: Exchange Tuning Tips
Additional tuning tips for the Exchange management pack are found in Chapter 14, “Monitoring with Operations Manager,” and in Appendix A, “OpsMgr by Example: Configuring and Tuning Management Packs.”
Another thing to watch for regarding the front-end monitors is to require SSL on these Exchange virtual web directories:
Exchange
Public
OMA
Microsoft-Server-ActiveSync
Specifically, in the Internet Information Services (IIS) Manager of the front-end server (for those Exchange virtual web directories), you should verify that the Require secure channel (SSL) option on the Directory Security tab is selected.
Microsoft gave Operations Manager administrators a jump-start in making use of the Distributed Application feature by including several DA templates in the Information Worker management pack. We first saw the Enterprise Health Monitoring view (seen in Figure 19.17) in Chapter 16, “Client Monitoring.”
In Figure 19.17, we circled the Enterprise Health Monitoring folder; observe that it contains three View folders:
Internet Explorer
Outlook
Windows Explorer
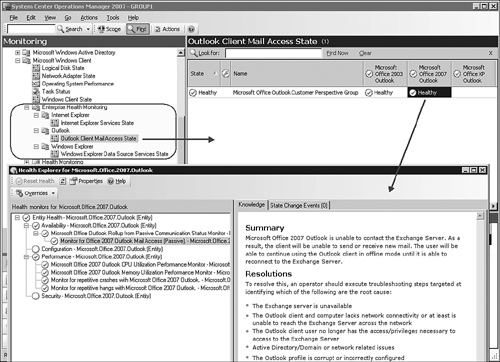
As we discussed in Chapter 16, the Outlook Client Mail Access State view generates an alert when 10% or more client computers running Microsoft Outlook cannot contact their Exchange server(s). The Outlook Client Mail Access State view automatically populates as the management pack discovers client computers running Outlook.
The other two Enterprise Health Monitoring views, Internet Explorer Services and Windows Explorer Data Source Services, are not populated until you create Distributed Applications (DAs) based on specific pre-defined templates. Importing the Information Worker management pack adds two DA templates to the Distributed Application Designer—you can choose one of these templates when creating a DA.
These are the views added in the Monitoring -> Microsoft Windows Client -> Enterprise Health Monitoring folder and the scenarios they support:
View: Internet Explorer -> Internet Explorer Services State.
Scenario: Internet Explorer Clients utilize Proxy Services and Network Services, and depend on a Physical Network.
View: Windows Explorer -> Windows Explorer Data Source Services State.
Scenario: Data Source Clients utilize Directory Services and Network Services, and depend on a Physical Network.
The monitoring views will be empty until you create custom monitoring services (using the Distributed Application Designer) based on the pre-defined templates. The names of the templates correspond to the two views. As we continue through the sections on Enterprise Health Monitoring, we will step though creating each of these two types of DAs, and discuss effective means to employ these Enterprise Health Monitoring features of OpsMgr.
Also known as the Client Web Access feature of the Information Worker management pack, you use the Internet Explorer Service template to create a DA to let you know when web browser clients are unable to access critical web application resources. The websites and web-based applications you monitor can either be internal to your network or on the Internet. If your organization depends on information workers accessing a web-based application for a critical business function, consider using the Internet Explorer Service template to author a DA that models that web access. Monitoring the DA will provide visibility into the ability of client computers to use the critical web-based application.
The first step to enabling the Client Web Access (Internet Explorer Service) DA is to create one or more web applications using the Add Monitoring Wizard in the Authoring space. Then you will use the Distributed Application Designer, specifying the Windows Internet Explorer Service template, and then adding the web application as an object to monitor. The scenario we will use to demonstrate the Internet Explorer Service DA is employees accessing a business-critical website. We want to detect problems in getting to that website.
Define the website you will monitor by creating a web application in the authoring space. After you create the web application, the health of that application will be viewable in the Monitoring -> Web Application -> Web Applications State view. More importantly, it will make the web application selectable in the Object Picker later in the Distributed Application Designer. Follow these steps to define the critical website:
In the Authoring space, navigate to the Management Packs node and run the Add monitoring wizard.
Select Web Application as the monitoring type and press Next.
On the Web Application Name and Description page, enter a name and description of the critical website. The name entered here will appear as a component of the DA, so name it something that makes the most sense in that context. We named ours Critical Website Access. Select (or create) a custom management pack (not the Default management pack) to save the changes to and press Next.
Enter and test the URL you will be monitoring. This test is performed from the Root Management Server (RMS) and does not necessarily validate that the URL is reachable from the watcher node that you select in the next step. After a moment, the results of the test are displayed along with a Details button.
Figure 19.18 shows how you can expose the actual Hyper Text Markup Language (HTML) returned from the monitored web server. You can later use details from the HTML reply to further validate proper response from the critical website.
On the Choose Watcher Nodes page, select one or more managed computers to act as watcher nodes, preferably from multiple and different locations. Monitoring an external web server through different outbound Internet Service Providers (ISPs) is a good idea. Also, consider monitoring an internal web server from watcher nodes at each branch office or outlying building.
It is generally best to select at least two watcher nodes for each web address. This way when you are alerted to a problem accessing the critical website, you can more easily rule out individual watcher node failure. Each instance of a watcher node monitoring a URL creates a new object in the Web Applications State view, which becomes usable by the DA.
The default interval to run the web query is every two minutes. This might be too short an interval if you have a larger number of watcher nodes or a complex set of web application tests. Adjust the query interval as appropriate and press Next.
Press Create and wait several moments. You should then be able to locate the new web application monitor(s) in the Monitoring -> Web Application -> Web Applications State View folder. There will be a separate monitor for each watcher node.

You can return at any time to view or modify the characteristics of the web application you created. Perform this task using the Web Application Editor, launched from the Authoring -> Management Pack Templates -> Web Application node. There are many advanced features of the web application accessed through the Web Application Editor. You can modify and fine-tune the web application to fit many business needs.
In Figure 19.19, we have opened our Critical Website Access Web Application in the Web Application Editor. We launched the Web Application Editor by selecting the Critical Website Access Web Application at the Authoring -> Management Pack -> Web Application node and selected the Edit web application settings Custom Action.
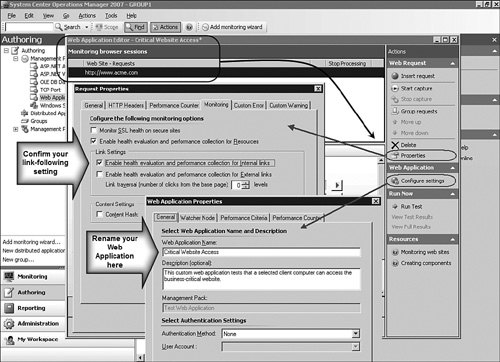
If you select the Properties action in the Web Application Editor, it exposes a particularly important setting. This is the Link Settings on the Monitoring tab of the Request Properties box (see the large upper-left arrow in Figure 19.19). The Enable health evaluation and performance collection for Internal links setting is enabled by default. This setting causes the web application to follow all links on the monitoring website that are part of the same domain as the main URL. A failure state will occur if any of the internal links are down. This may or may not be your desire, so consider disabling that feature if you only want to monitor the default page of the website.
The large, lower arrow in Figure 19.19 points to the Web Application Properties box exposed by selecting the Configure settings action. Here you can rename your web application, enable authentication for intranet sites, and modify the assignment of watcher nodes for the web application.
With our web application configured and our watcher nodes appearing in the healthy state at the Monitoring -> Web Application -> Web Applications State View folder, we are ready to create the Critical Website Access DA, in which the watcher nodes will participate.
Follow these steps to create the Critical Website Access DA:
Navigate to and select the Authoring -> Distributed Applications node. Click the Create a new distributed application action.
Tip: Distributed Application Designer Is x86 Only
If you attempt to open the Distributed Application Designer from a 64-bit version of the Operations console, you will receive a console error message. The DAD runs as a 32-bit application only.
Suggestions offered by Microsoft are to dual-boot to a 32-bit (x86) version of Windows, install a 32-bit version of Windows in a Virtual PC, or run the Distributed Application Designer from another computer that is running a 32-bit version of Windows.
Enter a name and description for the DA. The name you enter here is what you will see in the Monitoring -> Distributed Applications global view, so use a name that communicates its purpose. We selected the same name Critical Website Access that we used in defining the web application.
Choose the Windows Internet Explorer Service template.
Select a custom management pack to save the DA to, or create a new one just for this DA (our recommendation!), and press OK.
After opening the Distributed Application Designer and choosing to use the Internet Explorer Service template, you have a logical view of four components (with relationships), as follows:
Windows Internet Explorer Clients, which depend on Proxy Services, Network Services, and a Physical Network.
Windows Internet Explorer Proxy Services, which depend on a Physical Network.
Windows Internet Explorer Network Services, which depend on a Physical Network.
A Physical Network.
What this arrangement suggests is that client computers depend on several components, such as proxy services and network services, to access the critical website in addition to the interconnecting physical network. Defining your DA with these components and relationships will help you identify root causes when there are problems accessing the critical website. Components in the DA are containers that hold one or more managed objects.
To adapt the template to your environment, decide what network services you want to associate with this DA—specifically, what services the web browser client depends on using in order to access the critical website. In our example, we will use the Dynamic Host Configuration Protocol (DHCP) Services on one server, and the Windows Proxy Automatic Detection (WPAD) Services, hosted by Internet Information Service (IIS) on another server, as our client computer dependencies.
We will also identify the network devices, such as routers or switches, which the web browser client, DHCP, and WPAD servers depend on to provide outbound access to the critical website. A failure in DHCP or WPAD services, as well as a failure of the interconnecting network devices, can result with the web browser client unable to access the critical website. Our DA will rapidly disclose the failure origin if it is related to DHCP or WPAD services or the network devices.
It is a good idea to rename the components created by the Internet Explorer Service template, so they make sense to operators in your environment. Here is how we renamed the DA components in our demonstration (to rename the components, right-click each in turn, then select Properties):
Windows Internet Explorer Clients (renamed to) -> Client computer watcher node
Windows Internet Explorer Proxy Services -> DHCP Services
Windows Internet Explorer Network Services -> WPAD Services
Physical Network -> Edge Switches
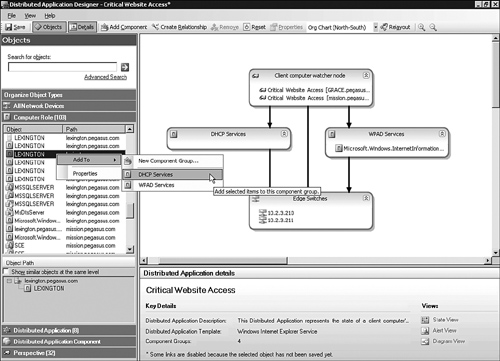
Now we are ready to add the components. Here are the steps we followed to populate our DA components with managed objects (clockwise from the top component, seen in Figure 19.20):
On the left side of the Distributed Application Designer, under Objects, double-click the Perspective object type tile.
Click the Object tile at the top of the object list to sort the perspectives by object name.
Locate and select both Critical Website Access watcher nodes, the ones created as web applications.
Right-click and select Add To -> Client computer watcher node. Observe that the Client computer watcher node component now contains two Critical Website Access watcher nodes.
Double-click the Computer Role object type tile.
Click the Path tile at the top of the object list to sort the computer roles by object path.
Locate the server name hosting the WPAD services in the path column; then select the Microsoft.Windows.InternetInformationServices.2003.Server.Role object for that server name.
Right-click and select Add To -> WPAD Services. Observe that the WPAD Services component now contains the IIS Services of the WPAD server.
Double-click the All Network Devices object type tile.
Click the Object tile at the top of the object list to sort the network devices by object name (IP address).
Locate and select one or more network devices. We selected two network devices that are the edge switches the client and server computers depend on for outbound access.
Right-click and select Add To -> Edge Switches. Observe that the Edge Switches component now contains the network devices.
Double-click the Computer Role object type tile.
Click the Object tile at the top of the object list to sort the computer roles by object name.
Locate the server name hosting the DHCP Services in the Object column. Move the cursor slowly over the server names (hover) to view a floating tip describing each object. Do so until you locate the DHCP services object and select it.
Right-click and select Add To -> DHCP Services. Observe that the DHCP Services component now contains the DHCP service object of the selected server. Figure 19.20 illustrates this step.
Press the Save button (or File -> Save).
Exit the Distributed Application Designer (File -> Close or push the X button).
After several minutes, you can view the health status of the new DA in the Monitoring -> Distributed Applications view and the Monitoring -> Microsoft Windows Client -> Enterprise Health Monitoring -> Internet Explorer Services State view.
Access to the DA object itself remains at the Authoring -> Distributed Applications node. You can return to that node at any time to modify the components, objects, relationships, and other settings in the DA. From that location, you can also launch the diagram view for the DA, as shown in Figure 19.21.
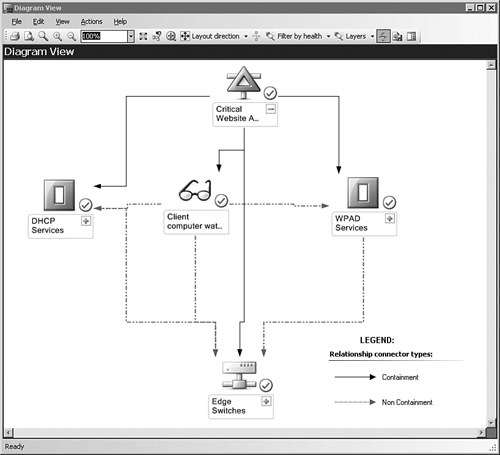
In the diagram view of our Critical Web Access DA, seen in Figure 19.21, we have manually moved the icons around so they appear in the same topology as in the Distributed Application Designer. We also added the legend for the containment vs. non-containment connector types in the lower right of the figure. Solid (black) relationship connector lines identify containment, while dotted (blue) lines identify non-containment dependency.
This view discloses that the Client computer watcher node is dependent on (but not contained by) the DHCP Services and the WPAD Services. Likewise, the Client computer watcher node, the DHCP Services, and the WPAD Services are all dependent on the Edge Switches, even though they are not objects contained within the Edge Switches.
In creating the Critical Website Access DA, we have instrumented several infrastructure components in a way that will help us quickly evaluate problems detected in client computers accessing a business critical website. Next, we will use the Windows Explorer Data Source Service template to create a similar DA, this time where the client accesses an important data source, rather than a business-critical website.
Also known as the Client Data Source Access feature of the Information Worker management pack, you use the Windows Explorer Data Source Service template to create a DA that lets you know when data source clients are unable to access important data source providers. The data source providers you monitor can be any of the 20 types supported by the OLE DB Data Source. These include Microsoft Jet sources (such as Microsoft Access legacy applications), and Open Database Connectivity (ODBC) to database sources like Microsoft SQL Server and Oracle.
If your organization requires information workers to access a data source for a critical business function, consider using the Windows Explorer Data Source Service template to author a DA modeling that data source access. Monitoring the DA provides visibility into the ability of client computers to use the essential data source.
The first step to enabling the Client Data Source Access (Windows Explorer Data Source Service) DA is creating one or more OLE DB Data Sources with the Add Monitoring Wizard in the Authoring space. You then use the Distributed Application Designer, specifying the Windows Explorer Data Source Service template, and add the OLE DB Data Source as an object to monitor.
The scenario we will use to demonstrate the Windows Explorer Data Source Service DA is access to the Audit Collection Services (ACS) database. We want to detect problems with network access to the ACS database SQL data source. This demonstration of the DA using the ACS database is applicable to any two-tier (Client/Server) distributed application.
Define the data source you will monitor by creating an OLE DB Data Source in the authoring space. After you create the OLE DB Data Source, the health of that application will be viewable in the Monitoring -> Synthetic Transaction -> OLE DB Data Source State view. The OLE DB Data Source will also be selectable in the Object Picker later in the Distributed Application Designer.
Follow these steps to define the OLE DB Data Source:
In the Authoring space, navigate to the Management Packs node and start the Add monitoring wizard.
Select OLE DB Data Source as the monitoring type and press Next.
On the OLE DB Data Source Name and Description page, enter a name and description of the data source. The name entered here will appear as a component of the DA, so name it something that makes the most sense in that context. We named ours ACS Database SQL Connectivity. Select (or create) a custom management pack (not the Default management pack) to save the changes to and press Next.
On the Enter and Test OLE DB Data Source Settings page, select the Simple Configuration option.
Select the appropriate Provider in the drop-down list. Because the ACS database is a Microsoft SQL database data source, we selected the Microsoft OLE DB Provider for SQL Server.
Enter the database server’s name in the IP address or device name box and the database name in the Database box. We entered the name of the ACS database server (FIREBALL) and the name of the ACS database, OperationsManagerAC. Press the Test button.
This test is performed from the RMS and does not necessarily validate that the OLE DB Data Source is reachable from the watcher node selected in the subsequent step. After a moment, you should see a green checkmark icon and the notice Request processed successfully, as seen in Figure 19.22.
On the Choose Watcher Nodes page, select one or more managed computers to act as watcher nodes, ideally from several different locations. Because the ACS database can only be accessed from inside the private network, it would be appropriate to select watcher nodes physically in separate physical portions of the network, such as different floors or wings.
It is generally best to select at least two watcher nodes for each OLE DB data source. This way, when you are alerted to a problem accessing the data source, you can more easily rule out individual watcher node failure. Each instance of a watcher node monitoring an OLE DB data source creates a new object in the OLE DB Data Source State view, which becomes usable by the DA.
The default interval to run the OLE DB data source query is every two minutes. Adjust the query interval as appropriate and press Next.
Press Create and wait several moments. You should then be able to locate the new OLE DB data source monitor(s) in the Monitoring -> Synthetic Transaction -> OLE DB Data Source State View folder. There will be one monitor for each watcher node.

You can return at any time to view or modify the characteristics of the OLE DB Data Source you created. Perform this task using the Authoring -> Management Pack Templates -> OLE DB Data Source node. Select the data source and press Properties. You can rename the data source, modify the data source connection string, and change the watcher node assignments.
With our OLE DB data sources configured and our watcher nodes appearing in a healthy state at the Monitoring -> Synthetic Transaction -> OLE DB Data Source State View folder, we are ready to create the ACS Database Connectivity DA. Perform the following steps:
Navigate to and select the Authoring -> Distributed Applications node. Click the Create a new distributed application action.
Enter a name and description for the DA. The name you enter here is what you will see in the Monitoring -> Distributed Applications global view, so use a name that communicates its purpose. We selected the name ACS Database Connectivity, similar to how we named the OLE DB Data Source.
Choose the Windows Explorer Data Source Service template.
Select a custom management pack to save the DA to, or create a new one just for this DA (recommended), and press OK.
After opening the Distributed Application Designer and choosing to use the Windows Explorer Data Source Service template, you have a logical view of four components and some dependencies, as follows:
Windows Explorer Data Source Clients, depending on Directory Services, Network Services, and a Physical Network
Windows Explorer Data Source Directory Services, depending on a Physical Network
Windows Explorer Data Source Network Services, depending on a Physical Network
A Physical Network
This configuration suggests client computers depend on several components, such as directory services and network services, as well as the interconnecting physical network, to access the important data source. To adapt the template to your environment, decide what network services you want to associate with this DA—specifically, what services the data source client depends on using in order to access the data source.
For our example, we will use the Active Directory Domain Controller Server 2003 Computer Role for our directory services component and the MSSQLSERVER –SQL DB Engine on the ACS database server, as our client computer dependencies. We know there is a router that some watcher nodes use to reach the ACS database server, so we will add that router for our physical network component. Our DA will rapidly disclose the failure origin if it is related to Active Directory, the SQL Server database service itself, or the router.
Using the Object Picker in the Distributed Application Designer, we proceeded to populate the components suggested by the template (following our plan of how we will utilize them), with the objects appropriate for those tasks. Figure 19.23 shows what the DA looks like at this stage in its creation.

The next task is to rename the DA components (which have long names that include the string Windows Explorer Data Source) with shorter, meaningful names. Here were the reassignments we made:
Windows Explorer Data Source Clients (renamed to) -> ACS Database Watcher Nodes
Windows Explorer Data Source Directory Services -> Domain Controller
Windows Explorer Data Source Network Services -> ACS SQL Server
Physical Network -> ACS DB Router
Now we have the option to continue to customize the DA with more information about the environment we are managing. You can add more components to your custom DA and increase the fidelity of the health model as desired. In this case, we will add the network switch layer to the health model. Here are the steps we took to add a network switch to the DA to promote failure point recognition:
In the Distributed Application Designer, press the Add Component toolbar button.
Name the component with a meaningful group name, and select the Objects of the following host type(s) radio button. We used the name Network Switches (Server Room), because this component is going to contain Network Device objects for the network switches that the Active Directory and SQL Server use to connect through in the server room.
Select the Device -> All Network Devices class type. Press OK.
In the Objects area on the left, double-click on All Network Devices to expose the list of network devices in the management group. Select the switches used by the servers.
Add the switches to the Network Switches (Server Room) component by either clicking and dragging, or by right-clicking and selecting Add to -> Network Switches (Server Room).
Press the Create Relationship toolbar button.
Click first on the Domain Controller component, and then click on the Network Switches (Server Room) component. This creates a component relationship named literally, Domain Controller uses Network Switches (Server Room). You can see that component relationship name in the Details pane when you select the relationship in the Distributed Application Designer.
Repeat step 7 for the ACS SQL Server component, then for the ACS DB Router component. Each of these components uses the Network Switches (Server Room) component.
Disengage the Create Relationship tool (click the toolbar button again).
Push the Relayout toolbar button.
Select the connecting (relationship) line between the domain controller and the ACS DB Router and press the Remove toolbar button. Also remove the connection between the ACS SQL Server and the ACS DB Router.
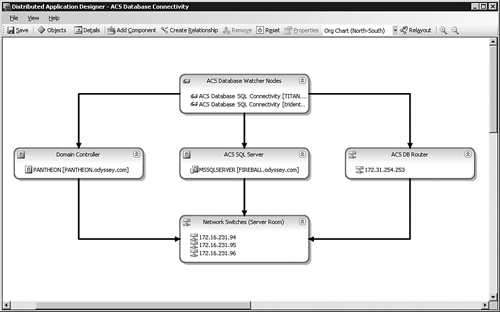
Push the Relayout toolbar button. Figure 19.24 illustrates the DA topology after this step.
The value in this topology is that should a problem occur, it will be easier to detect if the network switches in the server room are involved. Likewise, failure of a server room switch can be more quickly ruled out when troubleshooting data source connectivity problems.
Press the Save button (or File -> Save).
Exit the Distributed Application Designer (File -> Close or push the X button).
After several minutes, you can view the health status of the new DA in the Monitoring -> Distributed Applications view and the Monitoring -> Microsoft Windows Client -> Enterprise Health Monitoring -> Windows Explorer Data Source Services State view.
We will close this section on Enterprise Health Monitoring with a demonstration of the power of the Operations console and OpsMgr DAs feature to deliver an information fusion center. We have created a new View folder, ACS Database Connectivity, to contain different views of our DA. After creating a performance, alert, and state view for the DA, we created a dashboard view that contained all three of them. See it all at Figure 19.25, where we circled the View folder created for this DA.

The dashboard view of a DA is a place where you can synthesize data across all component groups and objects. For example, ACS database connectivity issues may correspond to domain controller outages in the same timeframe. The side-by-side presentation of the dashboard view greatly facilitates the ability to compare the alert times with the performance events. Creating the DA assembles the meaningful dashboard elements used in the data fusion.
This last portion of the chapter looks at monitoring custom applications. A primary purpose of the Distributed Application Designer is to help you create health models for custom applications. A DA is really just a health model—a hierarchical representation of the health of an object, where the object is the subject of the DA.
The most fundamental way to create a health model is by authoring a management pack with the OpsMgr Software Development Kit (SDK). However, in addition to using the SDK to author the health model for an object, you can also use the Distributed Application Designer to create a health model. The Distributed Application Designer is almost like a “layman’s SDK,” allowing you to transfer knowledge, about how the health of an IT service should be assessed, from your mind to the DA.
To create a custom DA, you need to model the end-to-end service you will be monitoring. This means that you must identify all the components that make up the service, and determine the relationships between components. E2E service modeling—done right—is the process of instrumenting and monitoring every application layer and component, in such a way that the appropriate level of visibility and information is provided at the right time. Remember, a potent characteristic of DAs is that they do not monitor everything—they monitor specific, key objects. Monitoring key objects reduces management burden and speeds problem resolution. Selecting those key objects is the critical task in E2E service modeling.
The tool for graphically building E2E service models is the Distributed Application Designer. We have already used the Distributed Application Designer a few times in the “Enterprise Health Monitoring” sections of this chapter. We also used the Windows Explorer Data Source Service and the Windows Internet Explorer Service DA templates to create and customize DAs that monitor connectivity to a SQL database, and access to a critical website. There are four other templates available in the Distributed Application Designer:
Line of Business Web Application
Messaging
Terminal Services Farm
Blank
We previously looked (in the “Windows Explorer Data Source Service Template” and “Internet Explorer Service Template” sections) at the Windows Explorer Data Source Service and the Windows Internet Explorer Service DA templates. These two templates are integrated with the Information Worker management pack, and both feature watcher node perspective components. Because they are part of a complete management pack solution, those two Enterprise Health Monitoring templates have some enhanced pre-defined views and alerting features.
The other four templates exist to help speed up the deployment of DAs in your organization, and we will look at the characteristics of each one. The idea is that you start by selecting a template that most closely matches the DA you want to monitor.
Tip: Getting a Quick Start with Service Modeling
Selecting a template that matches the DA you want to monitor gives you a head start in your service modeling task. After creating the DA, you add views in the Monitoring space and create custom reports as desired.
Figure 19.26 shows the Create a Distributed Application dialog, with the template selected to create a Line of Business Web Application.

A Line of Business application is a “big” application that businesses bet their company on. LoB applications automate “big” processes such as financials, customer support, marketing, sales, and commerce. Most large organizations have one or more LoB applications, which may be purchased or leased from a single LoB application vendor, or may be a patchwork assemblage of applications from various vendors that together constitute the LoB application.
Many modern LoB applications utilize a web browser as a user interface, and almost all LoB applications include one or more back-end databases. The components of the Line of Business Web Application DA template represent these common features of LoB applications. After creating our LoB DA as shown in Figure 19.26, the Distributed Application Designer will open with a very simple view: a Web Sites component that uses a Databases component. Figure 19.27 is the initial view of the LoB DA in the Distributed Application Designer (with the Objects pane hidden).
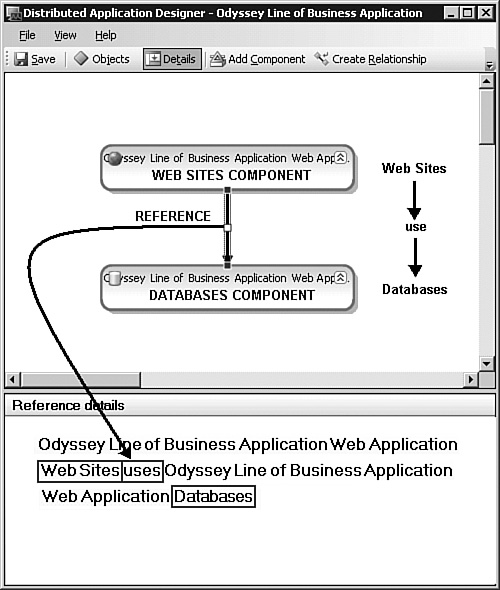
In Figure 19.27, we selected the connector between the Web Sites component and the Databases component. This causes the header of the Details pane to change to read Reference details and the contents of the Details pane to spell out the relationship between the components the connection references, that being the Web Application Web Sites uses Web Application Databases. The Diagram view of the DA represents the connector as a non-containment relationship.
Tip: Save Custom DAs to Unique Management Packs
Consider a policy of always saving new, custom DAs to their own dedicated management packs. This will make it easier to create custom views in the Monitoring space that target information about the DA. In addition, this makes the DA a portable solution by causing its configuration to be stored in the unique XML file of the custom management pack. Also, remember to make saving your DA the first action you take in the Distributed Application Designer (press the Save button in the left side of the toolbar). The dynamic view shortcuts in the object details area only become available after the first time you save the DA.
The default custom LoB DA has two components with a single relationship. The Line of Business Web Application template pre-defines those components as Web Sites and Databases.
Before monitoring a service, you must add objects to components. Every entity in your Operations Manager management group is an object you can add to a component in a DA. If you have discovered the entity already via any other management pack, it will be an object available to select for adding to a DA component.
To utilize the function of Line of Business Web Application template, you need to add one or more websites that use (depend on) one or more databases. Once you add a monitored object of the Web Sites class (a website) to the Web Sites component, that component begins to report the rolled-up health status of the objects. To add objects to the Web Sites component, you must locate suitable objects in the Web Sites object class. You will find the Web Sites object(s) of interest in the Object Picker.
The Object Picker is the name of the navigation and multi-purpose panel on the left side of the Distributed Application Designer. Using the Object Picker, you expose the objects available to select from the Organize Object Types portion of the Object Picker. Figure 19.28 is a composite illustration of the same instance of the Object Picker, where we present three kinds of information.

The Object Picker has a top-level organizer window that lists all the object classes available to select objects from for adding them to components in the DA. Seen in the left side of Figure 19.28, the new DA opens with this organizer window active. Here is a description of the purpose and usage of the organizer window:
All eligible classes (those classes that have components of the type that can be added to components in the DA) appear in the organizer window list.
Only up to seven object types (classes) can be visible in the Object Picker—for example, made available to select from.
It is possible that many more classes will be associated with the components in the DA than these seven, in which case there will be too many to be visible for selection in the Object Picker.
You use the checkmarks in the organizer window to select which seven classes you are working currently with; you can change these selections on the fly as you use the Object Picker.
Object types that have a checkmark in the organizer window will then also appear as navigation tiles to select in the lower portion of the Object Picker. These object types can be seen in the lower-left corner of Figure 19.28; they are as follows:
Database
Distributed Application
Distributed Application Component
Web Site
The Distributed Application and Distributed Application Component object types are always available in the organizer. The Database and Web Site object types are available because the components in the DA based on the LoB template are associated with the Database and Web Sites object classes.
Clicking on the Database navigation tile exposes the objects in the management group that are in the Database class. These are all the instances of databases on managed computers in your management group. See the center portion of Figure 19.28, with the Database object type selected in the Object Picker. In the center of the window is a scrolling list of monitored databases. There are columns for the database name and the computer hosting the database.
Hovering over the object names exposes the third dimension of the Object Picker, the object type tip, which confirms the object class. In the top center portion of Figure 19.28, hovering over the VirtualManagerDB object causes the tip SQL Database to appear for a few seconds. We added the VirtualManagerDB object to the Database component of our DA. That database is associated with the Microsoft System Center Virtual Machine Manager (SCVMM) application, the subject of our LoB DA. The SCVMM self-service website depends on the SQL database of the SCVMM service—this application compactly demonstrates the model of the LoB DA template.
The Web Site object type is selected in the Object Picker on the right side of Figure 19.28. When selected, all the websites of all the monitored computers in the management group are exposed. If you hover over the Microsoft System Center Virtual Machine Manager 2007 Self-Service Portal object in the center-right portion of this figure, the tip IIS 2003 website appears for a few seconds. Selecting the object populates the Object Path panel in the bottom of the Object Picker. The Object Path panel exposes the Service Modeling Language of the object. The tip and the Object Path are there to assist you in selecting the correct and desired object. We added that website to the Web Sites component of our DA.
The DA is now ready to run in a valid minimum configuration. One website in the Web Sites component depends on one database in the Databases component. You can add additional SCVMM websites and additional SCVMM databases in the organization to the same two components now or in the future. You can also add other components and relationships to increase the fidelity of the health model. One customization we did perform was to rename the components to just Odyssey VMM Web Sites and Odyssey VMM Databases, and we renamed the whole custom DA to Odyssey VMM. (Rename the DA by selecting File -> Properties.)
The initial design of the Odyssey SCVMM DA is complete. Figure 19.29 shows the finished DA in the Distributed Application Designer.
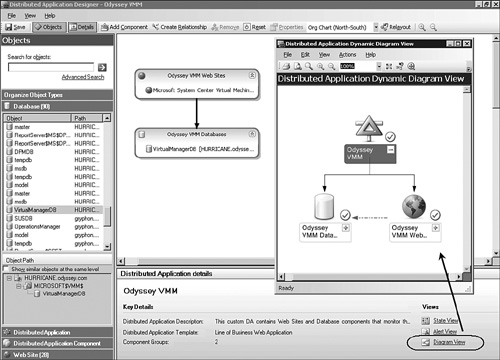
In the center of Figure 19.29, you can see the Odyssey VMM Web Sites component (above), using the Odyssey VMM Databases component (below) in the main window of the Distributed Application Designer. We clicked the Diagram View shortcut in the lower-right corner of the Details pane (circled). The Distributed Application Dynamic Diagram View opens in a new window.
The Distributed Application Dynamic view feature of the Distributed Application Designer lets you preview the appearance of your DA in the State, Alert, and Diagram views. These handy shortcuts let you see those views before creating associated View folders in the Monitoring space. Notice in the Diagram view of the Odyssey VMM DA, the relationship Web Sites uses Databases is reflected in the non-containment arrow (light blue and dotted) pointing from the Odyssey VMM Web Sites icon to the Odyssey VMM Databases icon.
After closing the Distributed Application Designer, a final task in deploying the LoB DA (that monitors the Odyssey VMM application) is to create views in the Monitoring space. When we saved our Odyssey VMM management pack for the first time, it created an empty View folder in the Monitoring space. (This is the case with all custom-created management packs, not only those associated with the Distributed Application Designer.) To make it easy to create monitoring views focused on the DA, you can make the DA the target of custom views created in the view folder. The next procedure shows you how to do this.
In the Monitoring space, we created an Odyssey VMM Performance view and an Odyssey VMM State view in the Odyssey VMM View folder. Now we will add an Alert view. To add an Alert view, perform the following steps:
In the Monitoring space, locate the View folder with the name of the DA. If you renamed the DA in the Distributed Application Designer, you will see the View folder with the original DA name. Right-click and select Rename to make the View folder name match the new name of the DA.
Right-click on the View folder and select New -> Event View.
Enter the name and description of the View folder. This name will appear in the navigation pane of the Monitoring space. We used the Name Odyssey VMM Alert View to match our naming scheme for this View folder.
Next to the Show data related to Entity item, push the “...” button.
Locate the name of the DA in the list of targets, or type the DA name in the Look for field. If you can’t locate the DA, make sure you have selected the View all targets radio button. Figure 19.30 illustrates this step.
Select the name of the DA and press OK twice.

You could create additional custom views of the DA and combine the custom views in a custom dashboard. You could also enable particular notification features for alerts from the DA, such as email or instant message notification. Finally, remember you can target the generic Alerts and Availability reports in OpsMgr against the DA.
As we covered in the “Predefined Distributed Applications” section of this chapter, you install the Exchange Service DA as part of importing the Exchange management packs. However, regardless of whether you imported the Exchange management packs, or even if you don’t use Exchange server, Microsoft has provided a template for creating a DA that represents an enterprise messaging system.
If your organization uses Exchange, the Exchange Service DA may fit your requirements just fine. However, the Exchange Service DA is part of the sealed Exchange management packs and cannot be edited—for example, you cannot define new components and relationships in the Exchange Service DA. A custom DA based on the Messaging template can be edited as needed. If your organization does not use Exchange, you can create a custom DA based on the Messaging template that exactly models whatever messaging services and components you do have.
We created a custom DA named Odyssey Enterprise Messaging to demonstrate how you can augment the monitoring of your Exchange organization. Figure 19.31 presents our completed DA based on the Messaging template.
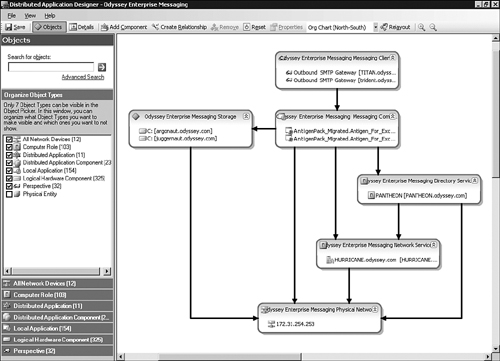
Table 19.1 lists the components of the Messaging template, as well as the object type each component accepts, and suggestions on what objects to include in your custom DA.
Table 19.1. Components Included in the Messaging DA Template
Component | Object Type | Suggested Uses |
|---|---|---|
Messaging Client | Perspective | Create TCP Port or web application synthetic transactions to model your client messaging application; assign watcher nodes |
Messaging Components | Local Application | Server applications that are core to messaging functions |
Messaging Storage | Logical Hardware Component | Physical location(s) of the messaging database(s) |
Messaging Directory Services | Computer Role | Active Directory Domain Controller(s) |
Messaging Network Services | Computer Role | Other network services such as IIS or DHCP |
Messaging Physical Network | All Network Devices | Routers, switches used by the components in the DA |
Our Odyssey Enterprise Messaging DA (shown in Figure 19.31) has eight object types listed in the organizer section of the Object Picker. Seven of the eight have checkmarks next to them, indicating that those object types are visible for selection. If you try to check an eighth object type, you will see the message: “You will have to unselect a selected Object Type first in order to select a new one and make it visible.” Remember, you can have only seven visible object types on the Object Picker!
Many organizations support groups of identical servers, known as farms, which work together to provide load balancing and failover for client connections. A web farm is a common scenario, where multiple web servers are load balanced either by round-robin or Network Load Balancing (NLB) techniques. Another very common farm application is terminal services, either using the native Windows Terminal Services, or using the popular Citrix Metaframe application (a Citrix farm). Farm applications are by definition also distributed applications, with the same service extended across multiple computers.
The OpsMgr software distribution media includes Microsoft Windows Terminal Services management packs available for import. Importing these management packs creates views and adds reports, and also adds a Terminal Services Farm DA template. The views and reports present an aggregate listing of all terminal servers and related services that exist in the management group—they do not include any diagram views or topology generation features as do the Active Directory and Exchange management packs.
Microsoft provides a template for specifying the architecture and dependencies of a Terminal Services Farm. Creating a DA based on the Terminal Services Farm template gives you a topology-based tool to monitor and troubleshoot your farm. You can create a DA for each terminal services or Citrix farm in your organization. Table 19.2 lists the components in the Terminal Services Farm DA template.
Table 19.2. Terminal Services Farm Template Components
Component | Object Type | Suggested Uses |
|---|---|---|
Terminal Server | Terminal Server Role | All terminal servers in the farm |
Terminal Services Session Directory | Terminal Services Session Directory Role | The server specified as the session directory server in the farm configuration |
Terminal Services Licensing Server | Terminal Services Licensing Server Role | The Terminal Services Licensing Server for your domain |
Windows Domain Controller | Windows Domain Controller | Active Directory Domain Controller(s) used by the farm members, session directory, and licensing servers |
Network Devices | All Network Devices | Routers, switches used by the involved servers |
Figure 19.32 illustrates a new custom DA named Odyssey Terminal Services Farm in the process of being created. We have already added the Terminal Server Session Directory object (top left) and a network device object (bottom center). We are adding a domain controller (DC), by selecting the DC object in the Object Picker, and then dragging and dropping it on the DC component.

The Terminal Server Session Directory component is a feature allowing users to automatically reconnect to disconnected sessions in a load balanced Terminal Services Farm. The session directory keeps a list of sessions, indexed by user name and server name. A Terminal Services Farm will not function correctly if there are problems with the Terminal Server Session Directory. Likewise, the farm will fail if connectivity to the Terminal Server Licensing server is lost or if the licensing service fails.
DAs based on the Terminal Services Farm template will help you keep track of the vital services that are specific to the Terminal Services application. If you support more than one farm, having multiple DAs will be especially helpful for segregating views of the terminal servers and the session directory server (for a particular farm) from the licensing server and domain controllers that may be shared by multiple farms.
Building a new custom DA based on the Blank template in the Distributed Application Designer is about as unleashed as you can be in the Operations console. You have available as your palette every object that has been discovered in your management group. The only constraint you have with the Blank template is that you can only add objects to components that match the type (or class) the component was created for. However, because you can also create a custom component for every class in the management group, the possibilities are infinite.
When you begin creating a DA based on the Blank template, the Object Picker only contains the Distributed Application and Distributed Application Component object types. OpsMgr efficiently allows custom DA and DA component reuse across all DAs. In our final demonstration of the capabilities of Distributed Application Designer, we will build out the monitoring of our enterprise messaging system.
We named the DA External Messaging Components. This is going to be an outside-in, high-level view of our messaging architecture. The first component we added was an existing DA—the Odyssey Enterprise Messaging DA we created in the “Messaging Template” section of this chapter.
The primary purpose of this DA is to monitor external services that the in-house messaging systems depend on. The scenario is that in-house messaging is still dependant on off-site hosted DNS, and an off-site hosted anti-spam service, such as Microsoft Exchange Hosted Services (MEHS), is used for the receipt of inbound Internet email. Part of the MEHS offering that we will monitor includes an off-site hosted anti-spam quarantine web service, where users can optionally review spam intercepted by MEHS. We will also add monitoring for a messaging compliance appliance that performs archiving and content inspection on all messages. Although the actual delivery of email would continue should the quarantine service website or the compliance appliance fail, we want our DA to holistically report on the high-level view of everything involved with our enterprise messaging system.
To monitor external services, create synthetic transactions or web applications that run on watcher nodes and look outside the management group. We created two pairs of TCP Port Synthetic Transaction monitors and a pair of Web Application monitors for this purpose. We selected a pair of watcher nodes for each monitor, since it is a best practice to always assign at least two watcher nodes to each synthetic transaction or web application.
Tip: Monitoring External Sites Requires OML
Microsoft Licensing says that an Operations Management License (OML) is required for each device managed by Operations Manager 2007, except for those functioning only as network infrastructure devices (OSI layer 3 or below). Microsoft has officially stated that the Synthetic Transaction and Web Application features of OpsMgr require an OML for the target. If the target is an internal server that already has an OpsMgr agent and OML, there is no additional license required. However, an OML is required for external servers and services that you monitor. That makes using OpsMgr too expensive to use as a general-purpose service-based ping monitor. You will probably only purchase OMLs on external targets for applications that are really business critical, in which case the OMLs are not expensive at all.
We named each of these six monitors using the prefix “Off-site.” To add monitors to a custom DA based on the Blank template, you must use the Search for objects and Advanced Search features of the Object Picker. Figure 19.33 illustrates using the Search for objects feature. We typed the string Off-site in the Search for objects field and pushed the green arrow button to the right of the data entry field. This action made visible the Results for: Off-site panel in the Object Picker, where we can see some of the custom monitors we created for this DA.
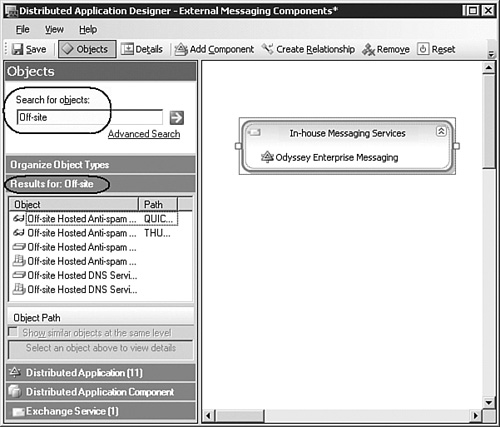
We selected and right-clicked the first pair of objects, performing the Add to -> New Component Group task. This placed the second component in the display area, joining the In-house Messaging Service component we created for the Odyssey Enterprise Messaging DA. We used the Advanced Search feature of the Distributed Application Designer to add the remaining objects to the DA. In Figure 19.34, notice that the Search for drop-down box at the top lists all the object classes in the management group, including custom transaction monitors and web applications.
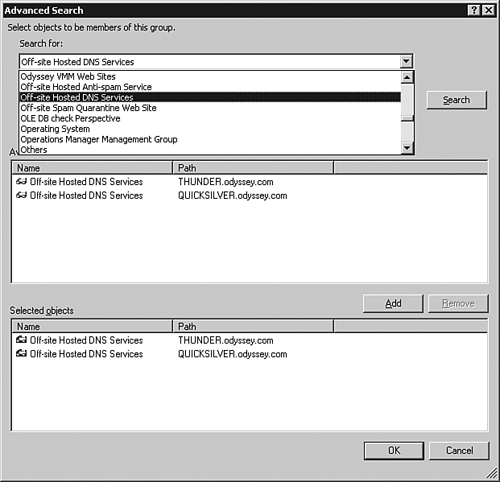
In Figure 19.34, we are creating the Off-site Hosted DNS Services component. We press the Search button when selecting the Off-site Hosted DNS Services TCP Port Synthetic Transaction in the Search for drop-down list. The search returns the watcher nodes for that TCP Port Synthetic Transaction. The results are in the central Available objects section of the Advanced Search dialog. Next, we select both watcher nodes from the search results area, press the Add button, and then the OK button.
After creating the component, you define the relationship between the new component and the central component and/or other components. You can also define reciprocal relationships, by creating a relationship in both directions between the same two components. For this DA, the In-house Messaging Services uses the Off-site Hosted DNS Services. While the Create Relationship toolbar button was pressed, we clicked first on the In-house Messaging Services, then on the Off-site Hosted DNS Services component. This created the non-containment relationship between the components.
In sum, the External Messaging Components DA features the In-house Messaging Services as the central component. Of course, that component is the Odyssey Enterprise Messaging DA, which as a DA is already an abstraction of carefully selected monitoring objects. The central component depends on three external components:
Off-site Hosted DNS Service, watched by two nodes running TCP Port 53 monitors targeted at the DNS servers of the DNS hosting service.
Off-site Hosted Anti-spam Service, watched by two nodes running TCP Port 25 monitors targeted at the SMTP server of the anti-spam hosting service.
Off-site Spam Quarantine Web Service, watched by two nodes running Web Application monitors targeted at the self-service spam quarantine website of the anti-spam hosting service.
Additionally, we wanted this DA to include monitoring for an appliance administered by another department. The appliance performs corporate compliance functions like archiving and checking for keywords or content. Although we don’t manage the appliance, it is business critical and we need to include its online status in our enterprise health model. We discovered the appliance as an SMTP Network Device and put that in an Email Compliance Appliance component. We created a relationship where the Email Compliance Appliance uses the In-house Messaging Services. Figure 19.35 displays the completed External Messaging Components DA.
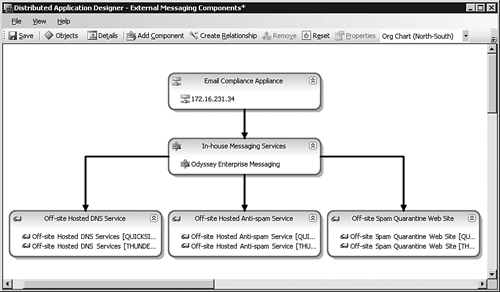
As we mentioned, the Off-site Hosted DNS Service and the Off-site Hosted Anti-spam Service are mission critical (highest priority), while the Off-site Spam Quarantine Web Service and the Email Compliance Appliance are business critical (but still important). We can incorporate this distinction in the DA.
You can modify the level of the alert generated by individual DA components. Using the Configure Health Rollup tool in the Distributed Application Designer (with the component selected), you can override the default alerting behavior that is to send a critical alert. In our scenario, you might reduce the alert level for the business-critical components from critical to warning.
We made it through the whole chapter without monitoring even a single server! The focus was on the dispersed net of components that deliver a service to users and customers, achieving End-to-End monitoring in many applications. We started with the roots of the distributed application in the programming world, and explained what a Distributed Application means in OpsMgr. We took a close look at three pre-defined DAs for OpsMgr, Active Directory, and Exchange. We learned about client perspective and watcher nodes in the Enterprise Health Monitoring scenarios. Finally, we started building DAs like a Line of Business application and a Terminal Services Farm. In Chapter 20, “Automatically Adapting Your Environment,” we discuss ideas on how to take OpsMgr beyond monitoring to automatically adapt to changes in your environment.