
System Center Operations Manager 2007 (OpsMgr) is a monitoring and operations management system, implemented using one or more computers that perform their assigned roles as components of a management group. The components cooperate over several secure communication channels to achieve management information workflow and present information to operators and administrators. The most important data collected is the health of the managed objects; this health status is arrived at via models that affect the tactical placement of software probes called monitors.
This chapter endeavors to make these terms and relationships clear so that the job of deploying and supporting OpsMgr 2007 becomes easier and more effective. Those readers tempted to skip this chapter covering OpsMgr internals, definitions, and concepts are probably asking themselves, “What practical use can I expect to get from reading this chapter?” Some administrators avoid looking under the hood deliberately, and that’s totally OK. For those individuals, we do recommend reading at least the “Management Group Defined” section of this chapter.
So, for those OpsMgr administrators who yearn to know exactly what is going on behind the scenes, this chapter is for you. We want you to understand the lingo and reasoning used by the software developers of Operations Manager. In doing so, we hope that more advanced material about OpsMgr will make sense more quickly to you, the OpsMgr administrator, when reading this book, using the product, or interacting with fellow professionals in the Microsoft systems management community.
This chapter looks at OpsMgr design and internals at two levels:
The macro level—. We’ll look at the computer roles that comprise a management group.
The micro level—. We’ll examine the objects that constitute a management pack, in particular its workflow and presentation of data to the operator.
As an OpsMgr administrator, you have no influence over server component characteristics—these are hard-coded features of the Operations Manager software and hardware architecture. On the other hand, administrators can enjoy almost complete flexibility regarding the manner in which management packs are utilized.
OpsMgr administrators of the smallest environments—administrators who will run all applicable OpsMgr components on a single server and manage only computers and devices on their local area network (LAN)—generally are less concerned about this section on OpsMgr architecture. In that small-scale scenario of the “all-in-one” management group server, there is much less to be concerned about with architectural considerations of the various OpsMgr computer roles (components) as long as you stay below capacity thresholds for that single server and its network segment. In this simplest OpsMgr environment, the only OpsMgr components not resident on the single server are the OpsMgr agents running on the managed computers on the network.
However, many OpsMgr administrators will need to distribute multiple components across different servers, deploying OpsMgr roles across multiple computers. Even OpsMgr 2007 deployments on small business networks may include an Audit Collection Services (ACS) Component to centralize security event auditing, or an OpsMgr Gateway Server Component to monitor service delivery at a branch office where there is no Virtual Private Network (VPN) connectivity. Deploying the feature sets added when installing these additional roles, by definition, adds one or more physical management servers to the management group and requires an understanding of Operations Manager 2007 management group architecture. Chapter 4, “Planning Your Operations Manager Deployment,” and Chapter 5, “Planning Complex Configurations,” provide information on hardware specifications and sizing server configurations.
A management group is an instance of the Microsoft end-to-end service management solution named Operations Manager 2007. Organizations may host several management groups (instances of OpsMgr on their networks) if appropriate for their business needs. Likewise, any managed computer or device can participate in one or more instances (management groups) of OpsMgr if appropriate. Most organizations of all sizes deploy a single management group, which is analogous to a single Active Directory (AD) forest or a single Exchange organization. Most organizations, including some very large ones, have their business needs met with just one AD forest and one Exchange organization.
Figure 3.1 illustrates a default, single management group in an organization, and contrasts that with a more complex implementation one might encounter in a large organization. In the simple all-in-one example on the left in Figure 3.1, all OpsMgr components are installed on one server, which is the only OpsMgr server in the single management group serving the managed computers (agents) in the organization. Several hundred computers can be managed with an all-in-one deployment of OpsMgr 2007.

In the complex large organization scenario on the right-hand portion of Figure 3.1, a single computer agent is reporting simultaneously to two management groups (known as a multihomed agent), while one of those management groups, through its Root Management Server (RMS), participates with several connected management groups. This creates an architecture capable of servicing tens of thousands of widely distributed computers.
You will seldom need multiple management groups to get the most out of OpsMgr 2007 since the product’s design provides full functionality to all but the largest of organizations while still using a single management group. For the very large organization (over 10,000 computers or over 100 remote sites), deploying several OpsMgr 2007 management groups can distribute the workload. Connecting these management groups enables you to query multiple management groups from the same Operations console.
Both having more than one production instance of OpsMgr in your organization and having a computer or device report status to more than one management group are advanced configurations to accomplish particular business goals. We describe these situations in Chapter 10, “Complex Configurations.”
Tip: Management Group Names
A management group name is a unique alphanumeric name specified by the administrator when installing the Operations Database Server Component. The management group name cannot be changed after installation, so it is a good idea to select a name that is easy to remember and makes sense given the organization’s geographic or administrative needs.
When creating a management group, remember that the name is case-sensitive.
Here are a dozen possible computer components, or roles, that can be deployed in an OpsMgr 2007 management group. Focusing now on what components constitute a single OpsMgr 2007 management group, let’s begin with describing the core, or basic, server components. The core components are those that an OpsMgr 2007 deployment must include to have minimum functionality. These basic components (displayed in Figure 3.2) are installed in every management group, including the all-in-one server OpsMgr environment.

Operations Database Server Component—. The heart of the management group is the Operations database. The Operations database contains operational data about managed objects, the configuration store of what objects are managed, and all customizations to the OpsMgr environment. The Operations database is the central repository and processing point for all data in a management group. When you install an OpsMgr 2007 management group on multiple computer systems, the first thing to take place is installing the Operations database on an existing SQL 2005 database server running Service Pack (SP) 1 or later. The Operations Database Server Component can be clustered in high-availability environments.
Root Management Server Component—. The first management server installed in a management group is the Root Management Server Component. Like all OpsMgr 2007 management servers, the RMS sends configuration information to managed computers and receives data from agents. The RMS alone runs some distinctive services that the entire management group depends on, and like the Operations Database Server Component, the RMS Component can be clustered. The RMS requires that the Operations database be available and accessible. The function of the entire management group also depends on the RMS; in high-availability environments you should consider clustering both the Operations database and the RMS components.
Agent Component—. The Agent Component is used to monitor servers and clients. This is a Windows service that runs on managed servers and client computers. You might create an all-in-one server management group whose only purpose is monitoring network devices such as routers or switches; in that case, no agents need to be deployed. However, for most OpsMgr setups, the deployment of core management group components is not complete until one or more computers are selected for management and the Agent Component is installed. As we mentioned previously in the “Management Group Defined” section of this chapter, an OpsMgr 2007 agent can participate in more than one management group simultaneously.
Console Component—. The OpsMgr 2007 console is the only application needed to interact with the management group, and it is used by both operators and administrators. Operations Manager 2007 implements role-based security to ensure an optimized experience for all users. There is also a web-based console with a subset of the regular console functions.
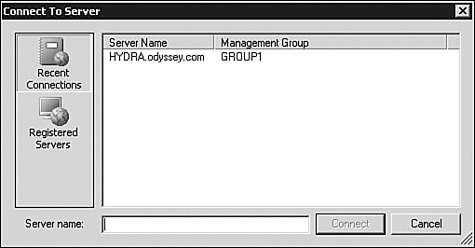
Each console connects directly to the RMS, even if additional management servers have been deployed in the management group. This dependence makes RMS availability critical to perform almost every function in OpsMgr 2007. The first time a user opens the Operations console, there is a prompt to enter the name of the RMS, unless the user accessing the console is at a management server. After connecting, the console stores that server name, as well as the management group name, in the Connect to Server dialog box shown in Figure 3.3.
The four components listed here are mandatory components and required for any OpsMgr management group to function. In addition, there are two core components related to reporting that most OpsMgr administrators will install regardless of their environment size:
Reporting Data Warehouse Server Component—. A long-term data store is created with the Reporting Data Warehouse Server Component. The data warehouse stores aggregated historical performance and availability data beyond the few hours or days of data available in the Operations database. Without a data warehouse, an OpsMgr management group will only present information based on the real-time and very recent data captured in the Operations database, which is aggressively groomed of historical data. The Reporting Data Warehouse Server Component can be hosted on a clustered SQL Server backend.
Reporting Server Component—. This component adds the reporting function to an OpsMgr management group and is required for the Reporting Data Warehouse Server Component. The Reporting Server is installed on a server running SQL Reporting Services 2005 SP 1 or later. Because of the integration between the Operations console and the Reporting Server, it is transparent to the user that the data for the reports is coming from the Reporting Server and not the Operations database or the RMS. This differs from the Microsoft Operations Manager (MOM) 2005 Reporting implementation.
You can install the Reporting Data Warehouse Server and Reporting Server Components on the same Windows server, although in large and high-availability environments, these two components typically run on dedicated servers.
Finally, there are six optional components in an OpsMgr management group. Computers are deployed with these components as needed or desired to increase the monitoring capacity, or to add further features to the management group:
Management Server Component—. This component refers to additional management servers installed after the RMS is installed. The primary reasons to deploy additional OpsMgr 2007 management servers are to enable agent failover and to manage a larger number of objects. There are specific procedures to promote a management server to the RMS Role in a disaster-recovery scenario, which we discuss in Chapter 12, “Backup and Recovery.” You would also install an additional management server to host the Audit Collector Component, described later in this list, because that component requires installation on an existing OpsMgr management server that is not the RMS.
Audit Database Server Component—. SQL Server 2005 is required for the Audit Database Server Component when adding the Audit Collection Services feature to the management group. Security events from managed computers are stored in this database and are used in generating reports. The Audit Database Server can be a clustered service for high availability. Reports on security events are generated from the Audit database.
Audit Collector Component—. This server function collects events from the audit collection–enabled agents. The Audit Collector Component is added to an existing OpsMgr management server. Audit collection is enabled on OpsMgr agents by running a task in the OpsMgr console. Each collector needs its own individual Audit Database Server. The Audit database can be located on the same computer as the ACS Collector, but for optimal performance, each of these components should be installed on a dedicated server.
Web Console Server Component—. Any OpsMgr management server running the Internet Information Services (IIS) web server service can optionally host a web-based version of the OpsMgr console. Functionally similar to using a thin client much like Outlook Web Access (OWA), operators can view topology diagrams and performance charts and run tasks made available to them appropriate for their role. The Web Console Server might be a management server dedicated to hosting this role in an organization that makes heavy use of the Web console.
Gateway Server Component—. A communications conduit to monitoring agents in untrusted domains (or on remote networks without routed network connectivity), this server resides in an external environment and uses certificates to secure communication back to the other roles in the management group. A gateway server can also host the Audit Collector Component.
Client Monitoring Server Component—. The Client Monitoring Configuration Wizard is used to configure the Client Monitoring Server Component on one or more management servers in a management group. The Agentless Exception Monitoring (AEM) Client Component is activated by a Group Policy Object (GPO) applied to client computers. An important note is that the management server and AEM clients must be in the same domain or fully trusted domains.
Figure 3.4 illustrates a management group with all components on distributed servers, and with many high-availability features deployed. This large-enterprise management group could provide end-to-end service monitoring of many thousands of objects with a high degree of reliability.

Computers running OpsMgr components also host particular Windows services in specific configurations depending on their function(s). The presence of the OpsMgr Health service is universal to all Windows computers participating in an Operations Manager 2007 management group. The next sections describe the Health service as well as the other four services that exist in a management group with Audit Collection Services deployed.
The Health service provides a general execution environment for monitoring modules. Such modules form different workflows, enabling end-to-end monitoring scenarios.
There are actually two flavors of the Health service:
The first implementation, the Agent Health service, runs on monitored Windows computers. The service executes tasks, collects performance data, and performs other functions on the managed computer. The Agent Health service continues to run, collecting data and performing tasks, even when disconnected from a management server. Data and events accumulate in a disk-based queue, and they are reported when the connection to the management server is restored.
The other implementation of the Health service runs on a management server. The functionality of the Health service running on a management server varies depending on the setup of the management group and the management packs installed.
Installing new or additional management packs extends the Health service running on both types of computers (agent-managed computers and management servers). Another important feature of the Health service is that it provides credential management services to other OpsMgr processes, supporting execution of modules running as different users.
A public/private key pair, used for secure communications, is created on each instance of the Health service (RMS, Management Server, Gateway Server, and agent). This key pair can be regenerated at any time. The public key is published at the following times:
During startup
When the key expires
During a failure to decrypt a message
Upon request by the SDK (discussed in the next section) to republish the key
If the key is not successfully published, the SDK may post errors. The agent key may also drop “key mismatch” events. Because OpsMgr is self-healing, the agent republishes the key or the SDK re-requests the key if there is a problem. When the key is close to expiring, the Health service restarts itself, regenerating the key. If you think the key has been compromised, remove it and restart the Health service to generate a new key.
The OpsMgr SDK service is found in the services list of all management servers. However, the service is disabled unless the server is also the RMS. This service and the OpsMgr Config service, described next, are both found only on management servers.
The SDK service is responsible for providing access for the OpsMgr console to the Operations database, viewing the current state of a monitored object, importing management packs to the database, storing management packs in the database, and storing management group configuration information in the database. The SDK service also handles the following functions:
Writing event data to the database
Writing state-change data to the database
Writing performance counter data to the database
In addition, the SDK service owns a symmetric encryption key for the management group that accesses the Run As Account information, which is stored in the Operations database. We introduced Run As Accounts in Chapter 2, “What’s New.”
The encryption key information is stored in the Registry. If you lose this key, you will have to clear out and reset the Run As accounts. The management group key is also required if you are promoting a management server to become your new RMS and want to keep your Run As Accounts. You can back up and restore this key using a Microsoft-provided key backup tool. This process is further discussed in Chapter 10.
Similar to the OpsMgr SDK service described earlier, the OpsMgr Config service will also be found installed on all management servers, but disabled unless the server is also the RMS. The OpsMgr Config service manages the relationships and the topology of the OpsMgr 2007 environment.
The OpsMgr Config service is responsible for providing the monitoring configuration to each agent’s Health service, which may include sensitive information. The service acts as an intermediary for delivering sensitive information in an encrypted format from the Operations database to the target Health service on a monitored agent.
This service sends events to an ACS collector server for storage in a SQL Server database. The Audit Forwarding service is found on each Windows computer in an OpsMgr management group. By default, the service needed for an agent to be an ACS forwarder is installed but not enabled when the OpsMgr agent is installed. After you install the ACS collector and database, you can then remotely enable this service on multiple agents through the Operations console by running the Enable Audit Collection task.
The Audit Collection service is responsible for receiving audit events over the network and writing them to the Audit database. This service is found running on management servers that also have the ACS Audit Collector Service Component Installed. The service and the Audit database are created during setup of the ACS service on the selected management server(s).
Operations Manager 2007 uses a variety of communications methods that are optimized for security and efficiency. Communication with the three OpsMgr database backend components—the Operations database (DB), the Data Warehouse DB, and the Audit Collection Services DB—is always via standard SQL client/server protocols, specifically OLE DB (Object Linking and Embedding Database).
Between agents, as well as management and gateway servers, the primary Transmission Control Protocol (TCP) port used by OpsMgr is 5723, which is the only outbound firewall hole needed to manage a computer in a minimal configuration (after the agent is installed or preinstalled). Additional outbound ports are used when enabling ACS and AEM. A complete list of communications protocols and default ports used in an OpsMgr management group is provided in Table 3.1.
Table 3.1. Communication Paths and Ports
From Component | To Component | Bidirectional | TCP Port |
|---|---|---|---|
Root Management Server (RMS) or Management Server (MS) | Operational Database (Ops DB) and Data Warehouse Database (DW DB) | No | OLE DB 1433 (SQL); in a cluster the second node requires a unique port number. |
RMS | MS or Gateway Server | Yes | 5723. |
Operations console | RMS | No | 5723. |
Agent | RMS, MS, or Gateway | No | 5723. |
Reporting Server, Web Console Server | RMS | No | 5724. |
Connector Framework Source | RMS | No | 51905. |
Agentless Exception Monitoring (AEM) Client | AEM file share on RMS or MS | No | SMB 445, 51906. |
Software Quality Metrics (SQM) Client | SQM Endpoint | No | 51907. |
Web console | Web Console Server | No | HTTP 51908. |
Audit Collection Services (ACS) Agent | ACS Collector | Yes | 59109. |
ACS Collector | ACS DB | No | OLE DB 1433 (SQL). |
Reporting Server | DW DB | No | OLE DB 1433 (SQL); in a cluster the second node requires a unique port number. |
Operations console | Reporting Server | No | HTTP 80. |
The logic in Table 3.1 is diagrammed in Figure 3.5. A quick study of the communication paths verifies the criticality of the RMS in an OpsMgr 2007 management group. The RMS is clearly the communications nexus for the monitoring organization, with most features of OpsMgr unavailable if the RMS is down or inaccessible. For example, you cannot open new Operations Manager console sessions if RMS is down. Of course, the RMS depends completely on its connection to the Operations database to function.

In effect, both the RMS and the Operations database need to be continuously available to provide uninterrupted continuity of management functions. That makes clustering the Ops DB and the RMS top considerations when seeking to architect a highly available management solution for the enterprise. For computers managed via the Gateway Server Component, additional gateway servers can be deployed to the same remote domain or site, providing failover coverage to one another.
The diagram in Figure 3.5 does not illustrate the need for RPC/DCOM communication between a management server and a managed computer in order to push the agent to a managed computer. Details on this, as well as how to configure the Windows Firewall on a managed computer to perform “push” installation of the agent from a management server, are covered in Chapter 9, “Installing and Configuring Agents.”
So far in this chapter, we have covered what a management group is, and how the components, or computer roles, of a management group communicate with one another—the macro view. Now we shift our focus to the micro view of the management pack—the computer and device management work the whole OpsMgr infrastructure was deployed for. The management group is the framework within which management packs do that work.
Operations Manager 2007 is a product established on the concept of model-based management. The abstraction of services into models is needed to describe and act on physical entities such as routers, and logical entities such as distributed applications, using software tools that by definition exist in cyberspace. Using models is a way to transform human knowledge and experience into something machines can operate with. In OpsMgr, service models live inside management packs. The management pack author or vendor encapsulates service health knowledge into the redistributable management pack.
Having a solid, accurate model of an object’s health lets OpsMgr 2007 present information to the operator in the most immediately useful way. As you will see, the models underpin both the OpsMgr 2007 application, with a workflow framework, and the OpsMgr 2007 operator, with augmented and accelerated decision making.
Operations Manager 2007 introduces an architecture that sets the foundation for a new, broader spectrum of monitoring capabilities and extensibility than has ever been available before using Microsoft management technologies. OpsMgr 2007 fundamental concepts include service and health modeling (we will explain and differentiate between those terms). We’ll briefly cover the schema of a management pack so that you understand how a service model is distilled into actionable components such as monitors and tasks. In addition, we will illustrate how monitors are the intersection between the models, and how health information progresses inside the OpsMgr workflow engine to its presentation in the OpsMgr console.
One can capture knowledge through models! Service modeling in Operations Manager 2007 is rooted in the well-known Service Modeling Language (SML) used by Microsoft developers in the .NET development environment. SML is an extensible language, built for describing the cooperating systems found not just inside the computer, but also inside an entire datacenter. SML provides a way to think about computer systems, operating systems, application-hosting systems, and application systems—as well as how they interact and are combined, connected, deployed, and managed. SML is used to create models of complex IT services and systems.
A software engineer authoring in Visual Studio Team Edition for Software Architects uses SML to define how an application interacts with various layers of the datacenter, such as the hardware layer, where the servers and routers live, and the operating system layer, which is “hosted” by the hardware layer. The SML concept of one layer hosting another is used in OpsMgr service modeling when relationships are defined between objects managed by OpsMgr, such as a hard drive that hosts a website.
OpsMgr 2007 operates on a class-based structure. When the monitoring infrastructure discovers an “object” (or entity), it assigns a set of logical classes to the object. These classes serve as descriptors for the managed object. The SML for a managed object is imported into OpsMgr using the vehicle of the management pack. Specifically, the management pack adds the formal definitions of “types of objects” (or classes), their properties, and the relationship between objects in the management group. Relationships usually take the form of a dependence on another object, or of a container of another object.
Without management packs and the knowledge they deliver, any OpsMgr group is just a big empty brain. You can compare a management group to the brain, which is a physical structure; in contrast, management packs are analogous to the memories and ideas that live in that brain. Useful thoughts are crafted in the brain based on knowledge and experience. Useful workflow in a management group is made possible by management packs.
We can continue to use a biological metaphor to explain the way management packs convert human knowledge and experience into actionable machine workflows. In the medical profession, a very precise lexicon exists to describe objects in the body. If you think of the parts of your body, you realize the many classes, properties, and relationships that exist. Here are some examples to get you thinking this way:
You have a sensory organ “class” that include “objects” such as your eyes, ears, tongue, nose, and skin.
Many objects in your body need to be described along with a property or qualifier, such as “left” or “right,” or “proximal” or “distal” to distinguish the particular body part (object).
Every object in the body has one or more relationships with other objects, such as the hand “depending” on the arm, or arteries that “contain” blood.
Classes, objects, and relationships are how OpsMgr recognizes an object, understands what the object is, and how to work with the object. Just as we more precisely describe a particular body part by adding the descriptor “left” to the object “hand,” OpsMgr describes objects using a hierarchical system of descriptors that are increasingly specific.
Now you will see this SML layer concept in action as we describe a particular object, a website running on a managed Windows server. See the diagram in Figure 3.6, starting in the upper-left portion of the description, the Entity. This is another word for “object” in OpsMgr, and it’s like a placeholder for the object’s root.
Proceeding down and to the right in the hierarchy, or “tree,” depicted in Figure 3.6, we add descriptors to successively narrow, or focus, the description of the particular managed object. As depicted, the Windows Computer Role is a subordinate descriptor to Computer Role. Likewise, the Internet Information Services (IIS) service is a particular Windows Computer Role in OpsMgr, and the monitored website is a particular feature of the IIS service.
Also illustrated in Figure 3.6 are relationships between objects, such as the Windows Operating System (OS) hosting the IIS service, and a particular disk drive hosting the monitored website—which is the object of interest in this description.
The ability of management packs to define relationships between objects, using such terms as “reference,” “using,” “hosting,” and “containing,” is critical to technological innovations found in OpsMgr over previous Microsoft management technologies. OpsMgr features such as monitoring distributed applications with containment relationships, diagrammatic cross-platform fault identification, and maintenance mode on individual computer components are possible via SML and its layered approach to describing objects.
Management pack authors include the ability to discern both objects and relationships between objects in the discovery process. Objects and relationships are discovered with probes that examine computer registries using Windows Management Instrumentation (WMI) queries, scripts, database queries (OLE DB), the Lightweight Directory Access Protocol (LDAP), and custom or “managed” code.
We’re going to dive right into an advanced view of the Authoring space to highlight the importance of the process to discover both objects and their relationships in order to understand how OpsMgr works. In Figure 3.7, observe the OpsMgr Authoring space, focused on the Object Discoveries branch of the Management Pack Objects section. In the upper portion of the center pane, notice we have expanded three discovered type classes:
Windows Server 2003 Disk Partition
Windows Server 2003 Logical Disk
Windows Server 2003 Physical Disk
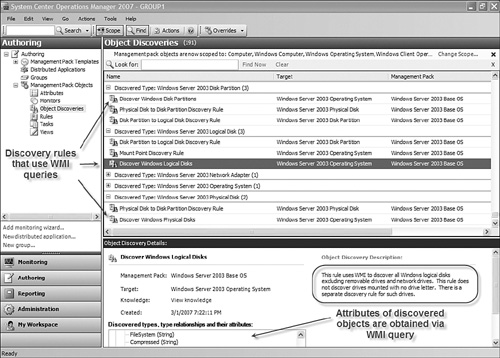
Arrows on the left in Figure 3.7 point to object discovery rules (distributed in the Windows Server 2003 Base OS management pack) that discover disk partitions, logical disks, and physical disk attributes using WMI queries. In the lower (Details) portion of the center pane, we can see the actual WMI query strings used when discovering Windows logical disks (in this case looking for attributes such as what file system is in use and whether the volume is compressed).
Of course, disk partitions as well as logical and physical disks are highly interrelated object classes. Physical disks can contain multiple disk partitions, which in turn may contain multiple logical disks. Logical disks can span multiple disk partitions and physical disks.
Notice in Figure 3.7 that the target column of the discovery rules for a particular object type such as “Windows Server 2003 Disk Partition” identifies the object type that hosts the discovered type. For example, the Windows Server 2003 Operating System (OS) hosts Windows disk partitions; therefore, the Discover Windows Disk Partitions object discovery rule targets the Windows Server 2003 OS object type (or class).
Relationship discovery rules operate in addition to object discovery rules. Object discovery rules use WMI or other probes to locate managed objects and populate the Operations database with actionable object attributes. This enables relationship discovery rules to look at object properties for particular discovered attributes that indicate a dependence, hosting, or containing relationship.
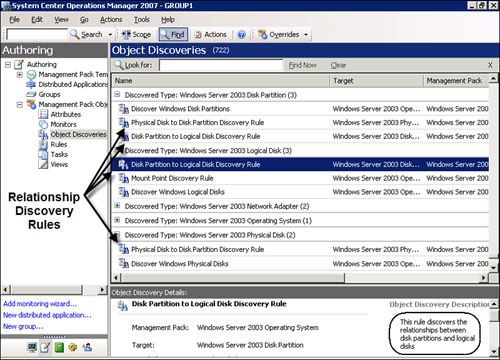
After the Windows Server 2003 Base OS management pack discovers various disk objects, it also discovers the relationships between these classes of disk objects using separate relationship discovery rules. See the relationship discovery rules called out in Figure 3.8. The four relationship discovery rules in this example identify the relationships between physical disks and disk partitions, and between disk partitions and logical disks.
After object and relationship discovery is complete, the Operations database is populated with the object’s descriptive data (its attributes). Now OpsMgr can begin performing the primary work of the management pack, managing the state of the object’s health model.
Every class, or object type, has a health model. The status, or health, of even the simplest managed object is represented by a health model. A model is a collection of monitors. We will be covering monitors in detail later in the “Monitors” section of this chapter. As we add monitors, we enrich the health model.
Monitors are arranged in a tree structure that is as deep or as shallow as required. The status of the health model represents the current state of the object. The Health Explorer shows a live view of an object’s health model. The Health Explorer tool can be launched against any managed object from all views in the Monitoring pane of the console.
A key monitoring concept in OpsMgr 2007 is the rollup. We first heard this term from Microsoft early in OpsMgr development, used to describe the way health status “bubbles up” from lower levels in the health model hierarchy, or tree, to higher-level monitors. The top-level monitor in a health model, located at the root Entity object layer, is the rollup, which represents the overall health state of the object.
We return to the Service Modeling Language layer-based method of classifying objects introduced along with the concept of service modeling. Figure 3.9 diagrams (on the left side) the tree-like class hierarchy of the IIS service on a Windows computer. Notice the unit monitors located at the lower right of the diagram inline with the IIS service. Monitors in each of the four basic categories (Availability, Security, Performance, and Configuration) are represented by round “pearl” shapes.

Lower-layer monitor status is propagated by the health model up to monitors in successively higher layers. For any given health model, monitors are not necessarily located at every layer, or within every monitor category. The management pack author determines what monitors are targeted against what object classes.
Finally, notice in Figure 3.9 the uppermost, triangular arrangement of four monitors rolling up into the health state for the managed object. The rollup occurs at the entity level; this is a universal feature of OpsMgr object health models. The second-level monitors that roll up into the top-level state monitor are called aggregate monitors.
Another key theme in OpsMgr is the employment of state-based management, in contrast to previous versions of Operations Manager that were alert-based. An alert-based management system watches for a condition, raises an alert, and optionally changes the state of the object due to the generation of the alert.
The point of the Health Explorer is to illustrate the state of a managed object’s health, not to present a list of new or unacknowledged alerts that require operator evaluation. MOM 2005 administrators already know the difficulty in rapidly correlating and triaging a laundry list of alerts in order to answer the question, “What do we need to do to fix the problem?”
The OpsMgr implementation of state-based management applies the following workflow sequence:
A unit monitor watches for a condition.
When the unit monitor detects the condition, it changes the state of the unit monitor.
Unit monitor states are rolled up as required to higher-level aggregate monitors in the object’s health model.
Rules optionally generate an alert or initiate a notification event.
A management pack is an eXtensible Markup Language (XML) document that provides the structure to monitor specific software or hardware. A sealed managed pack is a read-only, encrypted version of the XML document. This XML document contains the definitions of the different components in software or hardware and the information needed by an administrator who must operate that application, device, or service efficiently.
We will take a quick look at the schema of the management pack so that you can appreciate how tightly management pack construction is aligned with the health model of an object. A high-level view of the management pack schema is diagrammed in Figure 3.10. From the management pack root, moving right, there are eight major sections: Manifest, TypeDefinitions, Monitoring, Templates, PresentationTypes, Presentation, Reporting, and LanguagePacks.
Only the Manifest section is mandatory, and that section is expanded in the upper-right portion of Figure 3.10. The Manifest section defines the identity and version of the management pack as well as all other management packs it is dependent on. The Identity, Name, and References sections are common and included in every management pack. Any management packs referenced must be sealed, and they must be imported to the OpsMgr management group before the management pack can be imported.
The other major schema section that is expanded in Figure 3.10, Monitoring, is where most of the action takes place in OpsMgr, and this chapter also is mainly about the sections you see contained there. The following list summarizes the purpose of each section of the Monitoring schema:
Discoveries—. A discovery is a workflow that discovers one or more objects of a particular type. A discovery can discover objects of multiple types at one time. As introduced previously in the “Service Modeling” section of this chapter, there are both object discovery and relationship discovery rules.
Rules—. A rule is a generic workflow that can do many different things. As an example, it could collect a data item, alert on a specific condition, or run a scheduled task at some specified frequency. Rules do not set state at all; they are primarily used to collect data to present in the console or in reports and to generate alerts.
Tasks—. A task is a workflow that is executed on demand and is usually initiated by a user of the OpsMgr console. Tasks are not loaded by OpsMgr until required. There are also agent-initiated tasks, where the agent opens up a TCP/IP connection with the server, initiating the communication. After the connection is established, it is a two-way communication channel.
Monitors—. A monitor is a state machine and ultimately contributes to the state of some type of object that is being monitored by OpsMgr. There are three monitor types: aggregate (internal rollup), dependency (external rollup), and unit monitors. The unit monitor is the simplest monitor, one that simply detects a condition, changes its state, and propagates that state to parent monitors in the health model that roll up the status as appropriate. We cover monitors in more detail in the next section of this chapter.
Diagnostics—. A diagnostic is an on-demand workflow that is attached to a specific monitor. The diagnostic workflow is initiated automatically either when a monitor enters a particular state or upon demand by a user when the monitor is in a particular state. Multiple diagnostics can be attached to a monitor if required. A diagnostic does not change the application state.
Recoveries—. A recovery is an on-demand workflow that is attached to a specific monitor or a specific diagnostic. The recovery workflow is initiated automatically when a monitor enters a particular state or when a diagnostic has run, or upon demand by an operator. Multiple recoveries can be attached to a monitor if required. A recovery changes the application state in some way; hopefully it fixes any problems the monitor detected!
Overrides—. Overrides are used to change monitoring behavior in some way. Many types of overrides are available, including overrides of specific monitoring features such as discovery, diagnostics, and recoveries. Normally the OpsMgr administrator or operator sets overrides based on his specific, local environment. However, in some cases, a management pack vendor may recommend creating overrides in particular scenarios as a best practice.
It all starts with monitors in Operations Manager 2007. We have mentioned that a health model is a collection of monitors. If you were to author a management pack, you would probably start with creating unit monitors. Unit monitors would detect conditions you determine are essential to assess some aspect of the health of the application, device, or service needing to be managed.
Monitors provide the basic function of monitoring in OpsMgr. You can think of each monitor as a state machine, a self-contained machine that sets the state of a component based on conditional changes. A monitor can be in only one state at any given time, and there are a finite number of operational states.
A monitor can check for a single event or a wide range of events that represent many different problems. The goal of monitor design is to ensure that each unhealthy state of a monitor indicates a well-defined problem that has known diagnostic and recovery steps.
Using a single monitor to cover a large number of separate problems is not recommended, because it provides less value. We mentioned in the lead-in to the “Health Models” section of this chapter that adding monitors to a health model increases the richness of an object’s monitoring experience. The enhancement of an object’s health model with many monitors adds fidelity to the health state of the object. More monitors in a health model also means more relationship connection points for other managed objects that host, contain, depend on, or reference that object.
We pointed out the “pearl” icon used to represent a monitor in health model diagrams. An empty pearl icon represents a generic or a non-operational monitor. Figure 3.11 is a chart showing the default monitor icon images and their corresponding operational state.

A functioning monitor displays exactly one of the primary state icons: green/success, yellow/warning, or red/critical. A newly created or nonfunctional monitor will show the blank pearl icon. The gray maintenance mode “wrench” icon appears in all monitoring views inline with the object that was placed in maintenance mode. The final type of state icon you will encounter is the grayed state icon, which indicates that the managed object is out of contact. For example, this could reference a managed notebook computer that is off the network at the moment.
To be clear, there are three kinds of monitors that management pack authors can create: aggregate rollup monitors, dependency rollup monitors, and unit monitors. In the next sections we will describe each of these monitor types.
Let’s return to the Figure 3.9 view of the layers of the SML, which permits tactical placement of interrelated monitors. On the right, notice the monitors are classified in categories, essentially four vertical columns that are connected by a rollup to the top-level entity health status. Microsoft selected these four categories during OpsMgr development as a framework to aggregate the health of any managed object.
The four standard types of aggregate monitors in a state monitor are detailed in the following list:
Availability Health—. Examples include checking that services are running, that modules within the OpsMgr health service are loaded, and basic node up/down tracking.
Performance Health—. Examples include thresholds for available memory, processor utilization, and network response time.
Security Health—. Monitors related to security that are not included in the other aggregate monitors.
Configuration Health—. Examples include confirming the Windows activation state and that IIS logging is enabled and functioning.
The second category of monitor is the dependency rollup. Such a monitor rolls up health states from targets linked to one another by either a hosting or a membership relationship. Dependency rollup monitors function similarly to aggregate rollup monitors, but are located at intermediate layers of the SML hierarchy.
In Figure 3.9, notice again the unit monitors for the IIS service located in the lower right. There are two unit monitors of the performance type at the IIS Service level that merge at the Windows Computer Role level. The merge point represents one or more dependency rollup monitor(s) targeted at the Windows Computer Role.
Earlier in the “Service Modeling” section of this chapter, we explored how objects such as disk partitions, logical disks, and physical disks have numerous relationships. Figure 3.12 shows a sample dependency rollup monitor involving disk systems created in the OpsMgr authoring space.

The monitor created in Figure 3.12 is targeted against the Windows Server 2003 Disk Partition class. OpsMgr knows that disk partitions contain logical disks, so when you create a new dependency rollup monitor targeting the Windows Server 2003 Disk Partition class, OpsMgr offers existing monitors to select from for the Windows Server 2003 Logical Disk class.
We can also expand the example of the “merged” IIS service performance unit monitors in Figure 3.9. If we were creating that dependency rollup monitor in the authoring space, we would have selected the Windows Computer Role as the target of our monitor. The Create a Dependency Monitor Wizard would provide us with a list of dependent objects to select from that includes those IIS service performance monitors.
A unit monitor allows management pack authors to define a list of states and how to detect those states. A simple unit monitor is a Basic Service Monitor. This monitor raises state changes when a Windows service stops running. More complex unit monitors run scripts, examine text logs, and perform Simple Network Management Protocol (SNMP) queries. A unit monitor is deployed, or targeted, at a class of objects when it is authored.
Tip: Target the Agent to Deploy a Monitor to All Computers
Targeting a monitor at the Agent object class deploys the monitor to all managed computers. Use the Agent target like an “All Computers” group for monitors, but also use it sparingly. It is an OpsMgr best practice to deploy the minimum set of appropriate monitors to a managed computer.
When creating monitors and envisioning operational states, Microsoft advises OpsMgr administrators and management pack authors to do so without initially regarding actual implementation of those monitors. The reasoning is that OpsMgr not only provides many monitor types by default for common scenarios, but makes it possible to build different workflows to meet any monitoring requirement. Basically, the management pack architect is encouraged to think “outside the box” and describe in plain ideas how an application’s health can be assessed. After that, you can look to the many tools OpsMgr provides to instrument the application accordingly.
Figure 3.13 presents a montage screenshot that includes all possible types of unit monitors available in the authoring space of the OpsMgr console. These are the tools used to architect the instrumentation of the health model.
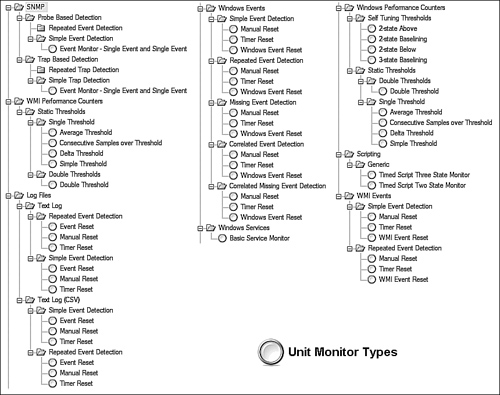
Over 50 unit monitor types are available to place as software instrumentation in the SML framework. Remember that unit monitors roll up into the aggregate monitors (Availability, Performance, Security, and Configuration), sometimes via dependency rollup monitors. The goal of monitor design is to ensure that each unhealthy state of a monitor indicates a well-defined problem that has known diagnostic and recovery steps. Table 3.2 provides some explanation of the unit monitor types found in the menu in Figure 3.13.
Table 3.2. Unit Monitor Types
Monitor type | Description |
|---|---|
Average Threshold | Average value over a number of samples. |
Consecutive Samples over Threshold | Value that remains over or below a threshold for a consecutive number of minutes. |
Delta Threshold | Change in value. |
Simple Threshold | Single threshold. |
Double Threshold | Two thresholds (monitors whether values are between a given pair of thresholds). |
Event Reset | A clearing condition occurs and resets the state automatically. |
Manual Reset | Event based; wait for operator to clear. |
Timer Reset | Event based; automatically clear after certain time. |
Basic Service Monitor | Uses WMI to check the state of the specified Windows service. The monitor will be unhealthy when the service is not running or has not been set to start automatically. |
Two State Monitor | Monitor has two states: Healthy and Unhealthy. |
Three State Monitor | Monitor has three states: Healthy, Warning, and Unhealthy. |
To conclude this section on monitors, we’re going to put it all together by overlaying the SML and the health model for a live service monitor. Figure 3.14 is a fully expanded view of the health model of the OpsMgr Health service itself running on a management server.

Beginning at the lowest level of the object description tree, we see the MonitoringHost Private Bytes Threshold unit monitor on the computer Hurricane. Five unit monitors are shown in the lowest row that roll up into the Health Service Performance monitor. These unit monitors are labeled with the abbreviations Svc Handle, Svc Priv, Mon Handle, Mon Priv, and Send Queue in Figure 3.14. The MonitoringHost Private Bytes Threshold (abbreviated Mon Priv) unit monitor is in a critical state.
We can follow the propagation of this unit monitor state up the health model. The OpsMgr Health service is an application component of Windows Local Application Health Rollup. The Health Service is in a critical state due to the critical state of the MonitoringHost Private Bytes Threshold (abbreviated Mon Priv) unit monitor. Progressing upward, the application state is rolled up along with the hardware, OS, and computer states to the performance component of the object.
The critical state is propagated to the application component of the performance monitor. Finally at the top of the health model, an aggregate monitor rolls up the performance, availability, security, and configuration monitors. The root entity, which is the server Hurricane itself, indicates the aggregated health state, which is critical.
Figure 3.15 shows the Health Explorer for the computer in the state illustrated in Figure 3.14. If you noticed the critical state of the computer in the Monitoring pane of the Operations console, you would probably open the Health Explorer for the computer, which allows you to understand quickly what is wrong. By comparing the structure of the Health Explorer in Figure 3.15 with the SDK and health model layers presented in Figure 3.14, you can match up the same critical health icons in the health model and the Health Explorer.

It is accurate to describe Operations Manager 2007 at its core as being a giant workflow engine. In fact, monitoring in OpsMgr is based around the concept of workflows. An Operations Manager agent and server will run many workflows simultaneously in order to discover and monitor applications, devices, and services.
Module types are the building blocks of Operations Manager workflows. Workflows are defined in management packs and then distributed to managed computers. Workflows can do many things, including collecting information and storing data in the Operations database or data warehouse, running timed scripts, creating alerts, and running on-demand tasks. Workflows are defined using modules, and modules are defined to be of a particular type known as a module type. Four different module types can be defined: data source, probe action, condition detection, and write action. Figure 3.16 illustrates these module types.
In the “Architectural Overview” section of this chapter, we compared the management group and management pack to macro and micro views that answer the question “How does OpsMgr do it”? In this section, we are going sub-micro! At the programmatic level, these are the terms and data flow structures used internally by the OpsMgr services:
Data Source—. A data source module type generates data using some form of instrumentation or some timed trigger action. As an example, a data source may provide events from a specific Windows event log or it could poll Windows performance counters every 10 minutes for a specific performance counter. A data source takes no input data and provides one output data stream. Data sources do not change the state of any object.
Probe Action—. A probe action module type uses some input data to provide some output data. A probe action will interrogate a monitored entity in some way, but it should not affect system state in any way. An example would be running a script that queries WMI to get some data. A probe action is often used in conjunction with a data source to run some action on a timed basis. The probe action module type may or may not use the input data item to affect the behavior. In other words, when triggered, a probe action generates output from external sources. Probe actions have one input stream and one output stream. Like data source modules, probe action modules do not change the state of objects.
Condition Detection—. A condition detection module type filters the incoming data in some way. Examples of filter types include a simple filter on the input data, consolidation of like data items, correlation between multiple inputs, and averaging performance data. A condition detection module type can take one or more input data streams and provides a single output data steam. Condition detection modules do not use any external source and do not change object state.
Write Action—. A write action module type takes a single input data stream and uses this in conjunction with some configuration to affect system state in some way. This change could be in the monitored system or in Operations Manager itself. As an example, the action may be to run a script that writes data into the Operations database, or one that generates an alert. A write action may or may not output data. This data cannot be passed to any other module because the write action is the last module in a workflow. However, the data may be sent to the Operations database. A sample action is running a command that outputs data, such as a command line that returns a report of success or errors. This data may be useful to the operator who executes the command, and it is returned to the Operations console and stored as task output.
Tip: Probe Actions Can Cause Unintended State Changes
Changes to object states should only occur in response to write action modules. Take note that Operations Manager cannot determine if a probe action is being used to change an object’s state in some way. For example, if you run a script that is part of a probe action module type, you could be changing object state in some way in your script. It is up to the management pack author to adhere to the module type definition guidance. If you are changing system state, you should use a write action module type instead.
Cook down is an important concept in management pack authoring. The Operations Manager agent or server is running many hundreds or even thousands of workflows at any given time. Each workflow that is loaded takes some system resource. Obviously the less system resources we take up for monitoring, the better.
The management pack author can do a lot to reduce the impact of monitoring on the system. One way is to ensure that workflows are not targeted too generically. We mentioned this already in this chapter, in the section on “Unit Monitors.” For example, if you have a rule that is only applicable to servers running Microsoft ISA Server 2006, don’t target the rule at all Windows servers; instead, you should target it at the appropriate ISA Server class.
Cook down is not about targeting; it is a principle whereby in most modules the Operations Manager Health service will try to minimize the number of instances in memory. This is accomplished by considering the configuration of modules. Usually, if the Health service sees two modules with the same configuration in different workflows that have the same configuration, it will only execute a single module and feed the output to all the workflows that defined the module. This is an efficiency you should be aware of, particularly if you will be authoring scripts for use by OpsMgr.
Here is a simple example of two rules that will “cook down”:
Rule 1—. Collect an event from the application log where Event ID =11724 and Event Source = MsiInstaller (application removal completed).
Rule 2—. Collect an event from the application log where Event ID =1005 and Event Source = MsiInstaller (system requires a restart to complete or continue application configuration).
Operations Manager sees that the event log provider data source (application log events) is configured the same for both rules. Only one instance of the module will run. The two MsiInstaller event ID rules, or expression filters, will take input data from the output of the same module. A large number of expression filters can be handled by one condition detection module. In the case of the event log provider example, there will normally be only one module executing for each log being monitored (unless you are running the module under different credentials for different workflows).
Cook down becomes particularly important when writing scripts to be run by OpsMgr, especially when there are scripts running against multiple instances of an object type on the same Health service. If you do not think about cook down, you could end up running many scripts when you could actually run a single script by thinking about configuration and targeting.
We have discussed module types and how they are used by OpsMgr internally to achieve workflow. Obviously, OpsMgr must pass data between modules. The format of this data varies depending on the module that output the data. As an example, a data source that reads from the event log will output a different type of data than a module that reads from a text-based log file. Some module types expect a certain type of data. A threshold module type expects performance data and the module type that writes data to the Operations Manager database expects event data. Therefore, it is necessary for Operations Manager to define and use different data types.
Data types are defined in management packs. However, this definition is merely a pointer to a code implementation of the data type. Operations Manager 2007 does not support extension of the data types provided out of the box.
Data types follow an inheritance model in a manner similar to class definitions, introduced in the “Service Modeling” section of this chapter. Whereas the class hierarchy starts with a base class called System.Entity, the data type hierarchy starts with a data type called System.BaseData. All data types eventually inherit from the base data type. Examples of data types in the System.BaseData class include Microsoft.Windows.RegistryData (for a probe action module that examines Registry values) and System.CommandOutput (for write action modules that return useful command-line output).
When a module type is defined it must, where applicable, specify the input and output data types that it accepts and provides. These must be valid data types defined in the same management pack or a referenced management pack. When a module is used in a workflow, the data types that the module type accepts and provides must be compatible with the other modules in the workflow.
This chapter has dived into progressively more detailed descriptions of how OpsMgr works at the management group, management pack, and workflow levels. Now we will come up for some air and finish with a discussion of the presentation layer in OpsMgr. This is the part of OpsMgr that you see with your eyes and will work with on a continuous and routine basis.
As with any user-level application (as opposed to an application designed only to be run in the background by machines as a Windows service) the presentation layer in OpsMgr is responsible for delivering and formatting relevant and interesting information to the user or operator. The main interface for Operations Manager 2007 is the Operations console. For doing monitoring work away from the office, Microsoft provides a web-based console with a subset of the full console’s functionally, optimized for monitoring functions. Finally, there is the command-line PowerShell for text-based interaction with OpsMgr.
OpsMgr can deliver management information to users with a variety of external notification techniques, such as email and instant messaging. Examples of those notifications and how they are configured are discussed in detail in Chapter 8, “Configuring and Using Operations Manager 2007.” However, OpsMgr cannot be administered and run only through notifications.
Unless you are using the Web console from a remote location, or running PowerShell for specialized work, all interaction between operations personnel and the Operations Manager 2007 application will occur using the Operations console. The console is not a Microsoft Management Console (MMC) snap-in, but a standalone application installed on management servers and optionally installed on any supported Windows computer.
The Operations console is composed of several panes, as shown in Figure 3.17, each of which serves a particular purpose. We will be covering the OpsMgr features accessed in the various console panes in detail in Chapter 8.

As you can see in Figure 3.17, the Operation console shares some features with the popular Microsoft Office Outlook application, such as the Navigation pane and navigation buttons. The Actions pane shares the look of another contemporary Microsoft application, Exchange 2007 (which also features PowerShell as an integrated component). The navigation buttons in the lower-left corner are a key feature of the console. They provide a rapid, intuitive way to shift between management tasks without firing up other consoles or applications. Here is a quick rundown on those navigation buttons:
Monitoring Pane—. Displays several different types of views that enable operators to analyze monitoring results within the managed environment(s). This is where most users of OpsMgr will spend their time because the Monitoring pane is where the action is!
Views of alerts, events, object states, performance, diagrams, tasks, and dashboards exist here. When reporting is installed, the lower portion of the Actions pane provides context-aware reports for the objects in the Results pane.
Authoring Pane—. Enables creation of additional monitoring objects to customize or supplement the default monitoring settings provided in management packs. New customized management packs can be created using several templates provided with OpsMgr. Custom groups used to target rules are created here. Only administrators and advanced operators have access to this pane.
Reporting Pane—. If OpsMgr reporting is installed in the management group, this pane displays a report library with the reports included in management packs, and it enables editing of customized reports. Only administrators and report operators have access to this pane. This navigation button is not present if reporting is not installed.
The report library contains generic reports, such as Alert Logging Latency and Most Common Events reports. Reports launched from the Reporting pane have no prespecified context, and operators must manually specify the context for the report in the parameter header before running the report. Reporting is discussed in more detail in Chapter 8.
Administration Pane—. Enables editing of high-level Operations Manager settings that affect the entire management group. It also enables viewing and configuring individual management servers and managed objects. The critical Security roles, Run As Accounts, and Run As Profiles are managed here. All work related to adding and deleting agent-managed computers, agentless managed computers, and network devices is performed in this pane. Only administrators have access to this pane.
My Workspace Pane—. Enables creation and storage of console customizations for later reuse. Although OpsMgr administrators can modify the main views and add new views using the Administration pane, there are many occasions where the operator has her own ideas or requirements for monitoring. The My Workspace pane is a personal area where console users can make new customized views to their heart’s content and not impact other system users. Users can also store possibly complex search criteria here, saving lots of time on each future occasion when those searches are used.
Tip: Turn the Navigation Button Area into a Toolbar
The navigation button area of the Operations console provides a quick way to change the functionality of the Results, Details, and Action panes in the console. However, the default navigation buttons encroach on the more useful Navigation pane above them and occupy almost 10% of the console area. You can recover that space by dragging the grouping bar above the top navigation button downward. This collapses the larger navigation buttons into much smaller icons that resemble a standard toolbar.
The center portion of the console, where the Results and Details panes are located, is particularly reconfigurable and divides into as many as nine separate panes in some console views. The Operations console also uses multiple windows, which open like popups, and can be closed without affecting the main console. For example, when Operations Manager features such as override, search, Health Explorer, and Security are being used, new windows open to support the selected operation.
The Find, Search, and Scope buttons in the Operations console make it easier for users to manage data. The Scope and Search controls are located at the top of the console in the toolbar area, and the Find filter is found at the top of the Results pane. Because OpsMgr can manage many thousands of objects, these filtering functions are a critical usability feature in large environments.
Borrowing again from the success of the Outlook interface, which is a very well received, almost identical web interface to Outlook Web Access, Microsoft delivered a Web console for OpsMgr. The Operations Manager 2007 Web console is really a triumph of web interface design and execution. It mimics many features of the Monitoring and My Workspace portions of the full Operations console.
An ActiveX control is downloaded to the user’s web browser on his first visit to the Web console from any given computer. If the Web console is installed on a management server, additional notification and access features become available to the management group. Specifically, there is a mobile access feature for smart phones and Personal Digital Assistants (PDAs) with network or Internet access, along with a Really Simple Syndication (RSS) version 2.0 feature that allows operators to set up RSS subscriptions to OpsMgr alerts.
PowerShell provides a means to interact with the OpsMgr application without any graphical interface. Much of the work that can be done in the Operations and Web consoles can also be done using PowerShell. PowerShell is particularly useful in a variety of specialized situations. Compared to the immensely usable OpsMgr console, it is an adjustment to work with the command line of PowerShell, particularly at first. However, just having the opportunity to view and set data in the Operations database programmatically using the command line is a fantastic addition to the administrator’s toolkit.
We will close this section with an example of the functionality and presentation of PowerShell compared to the OpsMgr console. We created a custom user role in the Security -> User Roles node of the OpsMgr Administration pane, named Partner Staff Acme. In Figure 3.18, you can see the properties of that user role, in a window launched from the console.
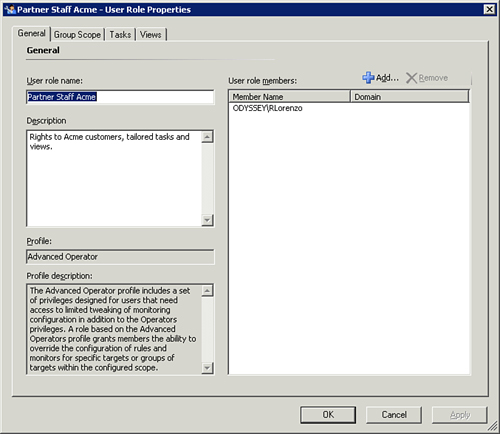
To access the Properties window in Figure 3.18, you simply right-click the user role in the OpsMgr console and select Properties. Notice that there is one user, RLorenzo, who is a member of that role in the ODYSSEY domain. Now we will use PowerShell to access the same information.
In Figure 3.19, notice the command window with the output of the PowerShell cmdlet get-UserRole. You can see the same information, such as the description of the role and the membership for RLorenzo. However, to achieve that output, you have to know the GUID (Globally Unique Identifier), a code name that is a long set of alphanumeric characters associated with the Partner Staff Acme user role. To learn the GUID of that role, you first have to use PowerShell to list the GUIDs for all the created and installed user roles. Of course, you also have to learn the syntax of the cmdlet. So there is a learning curve, and a rather brutal interface involved. For the true scripter, however, PowerShell could become the presentation layer of choice in some situations, and it adds the ability to perform OpsMgr actions in batch mode.

This chapter promised a look inside OpsMgr from the macro and micro perspectives. We described first how OpsMgr components are deployed on a single server to a small organization, or across many servers for the large enterprise. We also closely examined the communication channels used between components. We next covered how management packs encapsulate and distribute knowledge about objects and classes of objects, including relationships between objects. Then we looked even deeper at the workflows occurring between modules in a management pack. Finally, we discussed how the Operations console, Web console, and PowerShell present useful management information to the operator and administrator.
With this information, you are ready for the next two chapters, where we discuss designing an OpsMgr 2007 implementation.