
Microsoft System Center Operations Manager (OpsMgr) 2007 can monitor Windows events, services, and performance thresholds, in addition to providing availability monitoring for servers, components, and distributed applications, capabilities that we covered in detail in Chapter 14, “Monitoring with Operations Manager.” With this detailed level of monitoring, OpsMgr facilitates alerting and reporting the availability status and health of servers and applications. However, just because an application has not generated errors, it does not necessarily mean that the application is working correctly. The application could be running slowly or simply not responding to user requests, but without errors, one may have an artificial comfort level regarding the application’s health. Often, these sorts of problems are undetected until someone accesses the application, and compares their experience against the results that are expected.
As part of OpsMgr 2007, Microsoft provides synthetic transactions. Synthetic transactions allow you to configure and simulate a connection into an application. You run these actions in real time, against monitored objects. You can use synthetic transactions to measure the performance of a monitored object and to see how the object reacts when (synthetic) stress is placed on it. You create synthetic transactions by recording a website, or by manually creating requests.
Using synthetic transactions means that in addition to monitoring an application or server to ensure that it is online and working correctly, you can also simulate a connection or login to an application to validate that it is actually responding to user requests. This additional aspect of monitoring helps proactively identify potential issues with an application, typically long before an issue is identified using traditional methods such as Windows events or seeing services fail.
Synthetic transactions are particularly useful in monitoring High Availability (HA) architectures, where a single or multiple components may be taken offline without the overall service being significantly affected. When monitoring HA configurations, you can use synthetic transactions to augment the SLA (Service Level Agreement) and availability data gathered from OpsMgr for the components by actually monitoring to ensure the system is responding as expected, regardless of the status of the individual components.
As an example, consider a large web farm where multiple servers can fail before users are affected—OpsMgr may show the failure of servers, and this will affect the SLA data for the farm. In reality, however, the farm is not adversely affected by the fact that servers are down. Configuring a synthetic transaction to monitor the websites hosted by the farm is a way of validating the availability of the farm and the websites it hosts as a whole rather than as individual servers. If a server is offline, the SLA information for this server will show a failure, but the synthetic transaction SLA that is testing the website will still show as healthy, giving us more accurate availability information.
Synthetic transactions are able to monitor response times, in addition to monitoring to ensure something is online. This means that you are not simply limited to validating that an application or website is responding; you can also track and alert against response time. This capability allows you to monitor the end user experience, as you are able to trend the response time of an application from an agent-managed end user system.
Synthetic transactions can also be configured to monitor specific components of an application (especially web applications), allowing you to pinpoint problems to a specific sub-component of the application. As an example, you can configure a web application synthetic transaction to monitor the login process to a web-based system and the process for creating a record in the system, separately from one another. That way, if the login succeeds but creating the record fails, you are able to identify this and take the appropriate troubleshooting steps based on which sub-component has generated the errors.
Synthetic transactions utilize the OpsMgr class-based architecture; this means that you can target and use these transactions just like a server object or role. When you create a distributed application, you can add the synthetic transaction as an object in that distributed application. From a monitoring and reporting perspective, this capability allows the synthetic transaction to affect the status of the distributed application, with any failure of the transaction then reflected in availability reporting. (We cover distributed applications in depth in Chapter 19, appropriately named “Managing a Distributed Environment.”)
This chapter looks at the different types of synthetic transactions provided in Operations Manager 2007 and the process for creating synthetic transactions.
The most reliable way to ensure an application or server is working is to actually log into it, perform a typical process, and then observe the results. If the results are what you expected, chances are that the application or server is working correctly. If not, those results will often indicate where the problem is located, or at least provide a starting point to troubleshoot the problem. OpsMgr’s ability to simulate a transaction and mimic the user experience makes its simulation capabilities quite valuable.
OpsMgr provides the ability to synthetically monitor a number of different applications out of the box, and the capability is included in several of the key management packs available for download at Microsoft’s System Center Pack Catalog (http://go.microsoft.com/fwlink/?linkid=71124). A number of management pack templates to create synthetic transactions are included with the OpsMgr product, and we anticipate that we will see additional templates included as Microsoft releases new management packs. The current templates include the following:
Web application monitoring
Transmission Control Protocol (TCP) port monitoring
ASP.NET application monitoring
Windows Service monitoring
You could also create a VBScript to carry out synthetic monitoring of a particular application and launch the script using a rule. This is useful when monitoring proprietary applications that you may not be able to monitor using the out of the box management pack templates. An example of this would be creating a script to send a SOAP message to a SOAP-enabled application and validating the response. You could configure this script to generate an alert as required.
Note that this chapter will not look at the Windows Service management pack template, as it is not strictly a synthetic transaction.
The management pack templates are a set of wizards that walk you through the steps to create all the necessary rules, monitors, classes, and so on, to carry out a simulated connection to the monitored object. Using the templates makes configuring these synthetic transactions very simple and straightforward, without manually needing to create large numbers of rules or monitors to achieve the same results.
In the following sections, we will discuss the processes to create the different synthetic transactions using the management pack template wizards. We will start with explaining the terms we will be using. The term synthetic transaction refers generally to any transaction that simulates user activity. A management pack template refers to the object in the Operations console used to create the necessary rules, monitors, and so on that enable the synthetic transaction to occur.
When simulating connections to the application, you want to do more than ensure that the connection is accurate and reflective of what users would do. You also want to initiate the connection from different locations, as this simulates the user experience. You should initiate the connection from a server close to what you are connecting to, in addition to initiating the connection from a computer in the same location(s) as the users that are making the connections. You can then compare the results from each location to see whether the user experience is the same.
The agents performing synthetic transactions are known as watcher nodes. These watcher nodes actually perform the actions of a synthetic transaction, such as connecting to a website or querying the specified database. Placing these watcher nodes where the users are located is particularly important when those servers hosting the applications are located in geographically remote locations from the users, which often is the case with Information Technology (IT) systems today.
You configure the watcher nodes (the client computers designated to run these transactions) as part of creating the synthetic transaction. Watcher nodes allow you to specify the computer(s) that will launch the simulation. The only prerequisite is that the computer you want to run the simulation from has an installed OpsMgr agent. The computer can be running a Windows server or client operating system and can be located anywhere, provided it can communicate with the OpsMgr environment and the application it is configured to “watch.”
The information collected from one or more watcher nodes can assist you with locating the source of a problem. As an example, let’s say you have configured two watcher nodes, with one on the same network segment as the server you are connecting to and one located elsewhere on the client network. If your (remote) client network watcher fails to connect, this would indicate a network problem because the application is still responding, yet the client network is not able to connect. We illustrate this scenario in Figure 18.1.

As Figure 18.1 shows, using watcher nodes properly can help to not only detect when an application is failing, but can additionally be used to assist in locating the source of other problems—such as network connectivity problems when the application itself is responding correctly.
An additional way to use synthetic transactions is by using Operations Manager to assist with monitoring network devices. You can use these transactions to highlight potential network problems, and to simulate connections to network devices. You can connect to network devices using the TCP port monitor monitoring template that we discuss in the “Monitoring LOB Applications Through Port Activity” section of this chapter.
You can monitor other issues external to the application with any type of synthetic transactions, since physical connectivity is always required from the client to the server, regardless of the connection type.
Using OpsMgr 2007’s capability to monitor network devices means the location of network-related problems can also be determined and resolved. For additional information on network device monitoring in OpsMgr, see Chapter 17, “Monitoring Network Devices.”
Businesses utilize the Internet in many different ways, and websites continue to become increasingly popular as a way to access information. Companies use websites to display and share information within their company as well as externally. This high level of interest in the Internet and web technologies brings with it a requirement to monitor these technologies, ensuring they are working correctly and within required parameters. Out of the box, OpsMgr monitors not only the core Microsoft technologies behind the Internet, that being the Internet Information Services (IIS) application and services, but also allows you to configure synthetic transactions to simulate a connection to a website. Using synthetic transactions offers an additional level of monitoring, alerting you to errors in the web application and simulating user access to the site. These transactions lets you validate that the site loads correctly, displays as expected, and loads within an acceptable amount of time.
The level of monitoring provided by the web application monitor in OpsMgr goes beyond loading a page and validating that the page loads correctly and does not produce any errors. The monitor also allows you to configure navigating through different pages within the website and provides the ability to input information into the web pages. For instance, you may browse a site, navigate to the search page, input some search terms, and then use the results to validate that the website is working correctly. This capability is particularly useful for identifying issues that affect the website but may not be linked directly to the site itself.
As an example, consider a website with a backend database containing data you are able to search against. Although the page may display correctly, an error may be generated if the database is offline when you are running a search. Using the Web application management pack template allows you to detect this condition.
You can also utilize the Web application management pack template to collect performance data from the website, including DNS response time and total response time. The level of performance data you can collect is very impressive; Figure 18.2 shows an example of the counters you can collect using an application created with the template.

As Figure 18.2 illustrates, a huge number of counters can be collected. After collecting the information, you can display it in a performance graph in the Monitoring space in the Operations console, or perhaps generate a report to show the trend in website performance over time.
This section looks at the process to monitor a web application using the Web application management pack template. Configuring a web application synthetic transaction is quite straightforward; a wizard allows you to configure basic monitoring, and OpsMgr includes a Web Application Designer that allows you to configure advanced settings such as login information for the website. The designer also makes it easy to configure the website for monitoring, providing a web recorder you can use to record the synthetic transaction you will create using Internet Explorer.
Note: Recording SSL (Secure Sockets Layer) Sites
Currently, there is no way to record an SSL-enabled (HTTPS) site using the web recorder. To add a site of this type, it is necessary to use the Insert Request button in the web application designer. When you click the button, the Create New Request dialog launches. This dialog is very similar to the Web Application Properties dialog, which we cover in more detail in the “Configuring Advanced Monitoring for a Website” section of this chapter. Therefore, we will not look at this dialog in detail in this section.
The following steps look at the process for creating a web application synthetic transaction:
Launch the Operations console and navigate to the Authoring space.
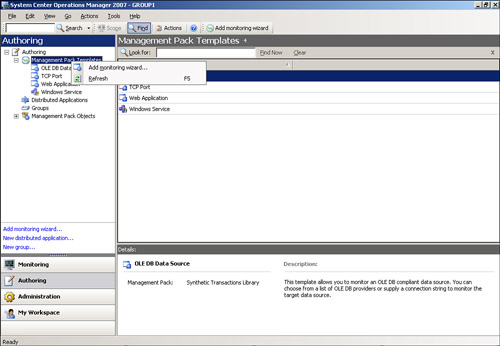
Right-click on the Management Pack Templates sub-tree and select Add monitoring wizard..., as shown in Figure 18.3.
The wizard displays the screen shown in Figure 18.4. From this screen, select Web Application as the monitoring type, and then click Next.
On the following screen, input the name and a description for the synthetic transaction, and select the management pack to create the transaction rules in. We will call the transaction Microsoft Website Monitor and select the Sample management pack we have used elsewhere in this book. Click Next to continue.
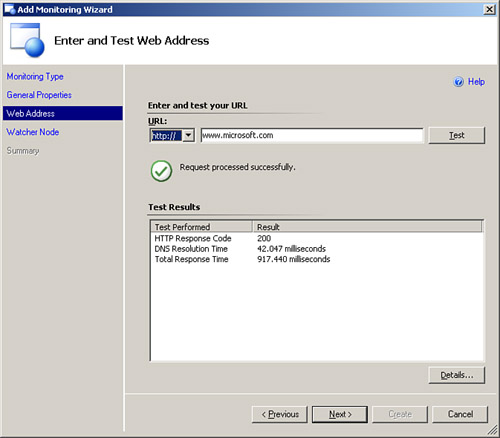
The next screen is the Enter and Test Web Address screen. Here you will enter the basic URL you wish to monitor. We will enter www.microsoft.com (although, as you will see later in this process, the information you enter here is irrelevant—we will change it using the Web Application Editor in the “Configuring Advanced Monitoring for a Website” section of this chapter). After entering the URL, click the Test button to validate you can contact that URL. Figure 18.5 displays this completed screen. Click Next.
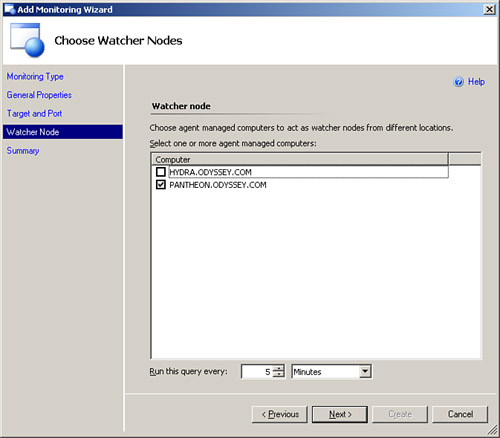
At the Choose Watcher Nodes screen you will identify and configure the computer initiating the test. The screen lists all machines running OpsMgr agents; you simply tick the checkboxes to carry out the test on the machines you choose. In our example, we will run the test from PANTHEON.ODYSSEY.COM. We will also configure the test to run every five (5) minutes instead of the default setting of two (2) minutes. Figure 18.6 shows the completed Watcher Node screen. Click Next to continue.
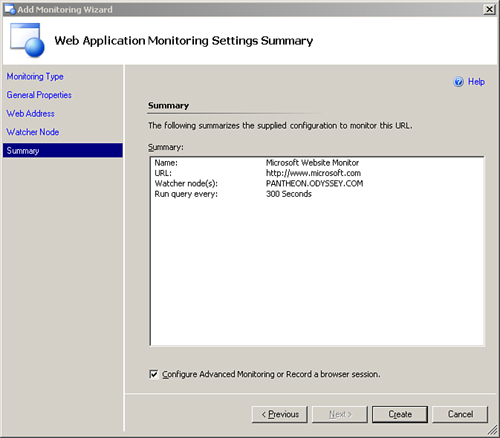
The final screen displays a summary of the information you have inputted throughout the wizard. The screen also allows you to Configure Advanced Monitoring or Record a browser session. If you do not check this option, the wizard completes and the web application synthetic transaction is saved to the management pack you specified.
For our example, we want to configure more advanced monitoring of the website, so we will tick the checkbox at the bottom of the screen, as we show in Figure 18.7.

In the next section, we cover the steps for advanced website monitoring.
Now that we have stepped through the Add Monitoring wizard, we will look at the process to configure advanced monitoring of a website or web application:
When you click Create in the Add Monitoring wizard with the Configure Advanced Monitoring option checked, the wizard closes and the Web Application Editor will open, as shown in Figure 18.8.
Using the Web Application Editor, we will record a web session and look at the extra options available when creating a web application synthetic transaction. The first step is to delete any web addresses present in the editor in preparation for recording a web session. Select the website we configured in the wizard earlier and click the Delete option on the right-hand side in the Actions pane under the Web Request section. Click OK when prompted.
With the editor cleared, we record a web session where we will browse a number of pages on the Microsoft website and enter a search term, demonstrating OpsMgr’s ability to simulate entries in a website.
Click the Start Capture button. This opens an Internet Explorer browser window with a Web Recorder pane on the left-hand side, displayed in Figure 18.9.
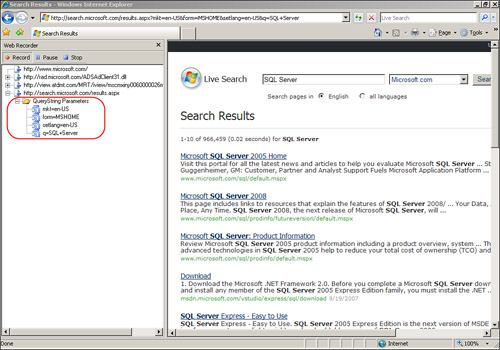
For our example, we will visit the main Microsoft website (http://www.microsoft.com). Once we visit the page, we will enter the search parameter SQL Server in the Live Search bar as shown in Figure 18.10. We click the search button, and allow the results page to load.
When the search results page loads, you will notice the Web Recorder pane has the search information added, as displayed in Figure 18.11.
After you complete recording the web session, click the Stop button in the Web Recorder pane. This closes Internet Explorer, bringing you back to the editor with the web addresses displayed in the console.
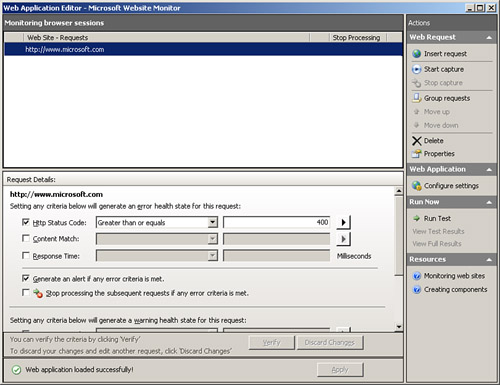
We will now configure the performance counters we wish to collect for the entire web application monitor. Click the Configure Settings link, which opens the Web Application Properties window shown in Figure 18.12.
From the screen shown in Figure 18.12, you can configure a number of options that affect the entire web application, including performance counters to collect, and any logon information required to access the website (the logon information is specified using Run As Accounts, explained in Chapter 11, “Securing Operations Manager 2007”). You can also add or remove watcher nodes from this screen.
Using the Performance Criteria tab, you can also configure additional alerts to generate when the total response time for the entire website takes longer than an amount of time you specify.
We will next configure the performance counters we want to collect. Navigate to the Performance Counter tab and tick the checkbox next to the following counters:
Total—DNS Resolution Time
Total—Time To First Byte
Total—Time To Last Byte
Total—Total Response Time
Click OK to save the options and close the options window.
This example configured performance counters for an entire web application. Note that a large number of the options configured globally are also available to each individual website. You can also configure extra options such as custom conditions for generating alerts. Figure 18.13 shows the options we configured.
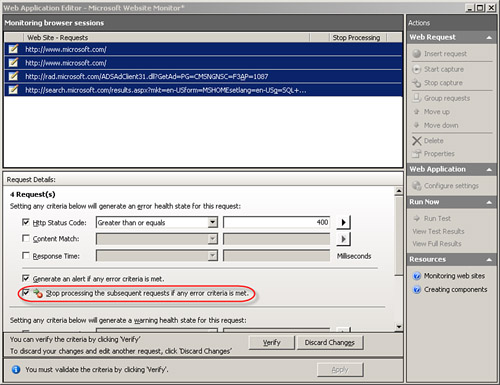
The last setting we need to apply will limit the number of alerts generated in the event of a failure. Although this option is not required, we recommend you use this functionality to prevent an alert storm. To prevent the transactions continuing to process when the previous transaction fails (and limit the number of alerts generated), select all web addresses in the editor and select the Stop processing the subsequent requests if any error criteria is met checkbox, circled in Figure 18.14.
After selecting the Stop processing the subsequent requests option, verify the settings you have applied. Click the Verify button, also displayed in Figure 18.14.
Finally, click the Apply button to save the settings. This creates all of the monitoring components automatically (this button is grayed out until you verify your criteria). You can then close the editor.


You may want to monitor websites that require authentication. In this case, you can configure authentication options from the Web Application Editor using the following process:
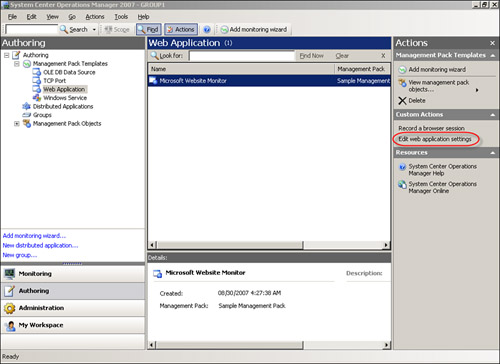
Open the Web Application Editor by navigating to the Authoring Pane and the Web Application sub-tree. From there, left-click the web application we created earlier in the “Creating a Web Application Synthetic Transaction” section of this chapter. From the Actions Pane, select Edit web application settings, as shown in Figure 18.15. This reopens the Web Application Editor.
Click the Configure settings link, which opens the Web Application Properties screen shown previously in Figure 18.12.
Using the Authentication drop-down (in the middle of the screen), select the Authentication Method for the website.
Tip: Setting the Authentication Method
The authentication method should match the type used in IIS for that website. If you are using another Internet technology such as Apache, you will want to match the authentication type with that application. For reference, with IIS, the NTLM (NT LAN Manager) authentication type is the same as Integrated Authentication.
After selecting the authentication method, you need to specify a user account. This account needs to be created as a Run As Account before you can use it. More information on creating Run As Accounts can be found in Chapter 11.
Note: Testing the Connection
When you configure a website that requires authentication, you will not be able to test the connection from the Web Application Editor. If you attempt to test the settings, you are presented with the following pop-up warning:
Running a test of this web application may fail. While running the test, credentials that have been configured for this web application will not be used. If the site you are testing does not explicitly require authentication, the test may still succeed.
To test sites that are using authentication, you will need to use the monitor state and alerts generated in the Operations console.
Now that we have a web application to monitor the Microsoft website, we will look at the performance counters we specified for collection.
Tip: Leave Time Before Viewing Performance Data
Be aware that it can take some time to collect the performance data. The amount of time depends on the frequency of the specific test; we recommend waiting up to 24 hours before viewing the data. This time allows enough data to be collected to generate a report with sufficient performance data.
To view the performance counters, perform the following steps:
Navigate to the monitoring space of the Operations console; expand the Web Application folder in the navigation tree, and right-click the Web Application State view. In the right-hand pane, we see the web application monitor displayed that we created earlier. Right-click on the object, then select Open -> Performance View, as shown in Figure 18.16.
You now see the Performance view for the web application, and you will notice that the available performance counters are the ones selected in the example. To demonstrate the performance graph, select the Total Response Time and the Total DNS Resolution Time counters, displayed in Figure 18.17.

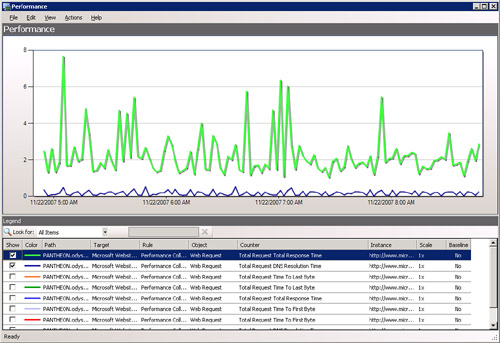
This section discussed the web application synthetic transaction and documented the procedures to create a web application synthetic transaction using the Web application management pack template. We looked at the Web Application Designer and the process for recording web sessions to enable advanced monitoring of websites and web applications. We also covered the process for creating synthetic transactions to connect to sites that require authentication.
In addition, we highlighted the large amount of performance information you can collect with the web application synthetic transaction, and the steps to display the data using the Performance view in the Operations console.
Operations Manager can monitor SQL Server databases, including availability, performance, and size monitoring. This is in addition to its capability for monitoring the SQL Server platform that hosts the databases. But what about verifying that the database is responding, or monitoring the databases that underpin your business critical application and are not hosted by SQL Server? This is where OLE DB synthetic transactions come in. The OLE DB (Object Linking and Embedding Database) management pack template allows you to create a synthetic connection to any database that supports OLE DB.
OLE DB is an Application Programming Interface (API) designed by Microsoft for accessing different types of data stores in a uniform manner. OLE DB is implemented using the Component Object Model (COM) and was designed as a replacement for ODBC (Open Database Connectivity). OLE DB enables supporting connections to a much wider range of non-relational databases than possible with ODBC, such as object databases and spreadsheets that do not necessarily implement SQL technology or Microsoft SQL Server.
This support for non-Microsoft SQL Server databases using OLE DB makes the management pack template in OpsMgr much more powerful, enabling it to accurately monitor databases hosted in other non-Microsoft SQL enterprise database systems such as Oracle.
We will now look at the process for creating an OLE DB synthetic transaction, as follows:
Open the Operations console and navigate to the Authoring space.
Right-click on the Management Pack Templates sub-tree and select Add monitoring wizard....
The screen shown in Figure 18.18 is displayed. From this screen, select OLE DB Data Source and click Next.
On the next screen, input the name and a description for the synthetic transaction and select the management pack in which you want to create the transaction rules. We will call our transaction Operations Manager Database Monitor and select the Sample management pack we have used elsewhere in this book. Click Next to continue.
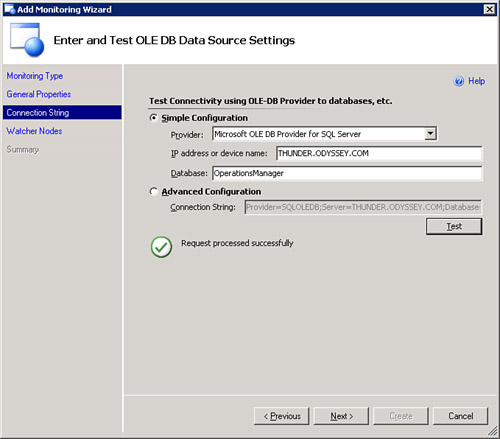
The next screen is the Enter and Test OLE DB Data Source Settings screen. Here you will enter the connection information for the database you wish to test. On this screen, you have two options:
You can use the Simple Configuration option, which allows you to input the server, database, and connection provider using a drop-down list.
If you are an accomplished database administrator, you may wish to use the Advanced Configuration option and input the connection string manually.
For this example, we will use the Simple Configuration option and configure the connection, as shown in Figure 18.19:
The Provider is specified in the drop-down list as Microsoft OLE DB Provider for SQL Server.
For the IP address or device name, we entered THUNDER.ODYSSEY.COM.
The Database is OperationsManager.
Note that as you are entering the information, the connector string is formed in the grayed-out box under the Advanced Configuration option. After configuring the database connection, click the Test button to validate the configuration. Figure 18.19 shows the completed screen. Click Next to continue.
The following screen is the Choose Watcher Nodes screen, where you specify the computer(s) initiating the test. The list displays all computers running OpsMgr agents, and you can tick the checkboxes to perform the test on the machines you choose. In our example, we will simply run the test from the HYDRA.ODYSSEY.COM machine. We will also configure the test to run every five (5) minutes instead of the default setting of two (2) minutes. Figure 18.20 shows the completed screen, which is similar to what we saw earlier as Figure 18.6, except that in Figure 18.6, we specified the watcher node as PANTHEON. Click Next.
The final screen displays a summary of the information you have entered throughout the wizard. Click Create to complete creating the OLEDB synthetic transaction. Figure 18.21 shows the summary screen for this monitoring template.


By default, the OLE DB management pack template allows you to configure a synthetic transaction to connect to a database and verify that the database is online. Although this level of monitoring is adequate for a large number of environments, there may be instances where an additional level of monitoring is required.
The OLEDB module defined within the System Library management pack supports an additional level of monitoring. This module allows you to configure custom queries to run against the monitored database, meaning not only can you verify that the database is online, but you can also verify that the database is responding to queries. In addition, you can output the results of the query, allowing validation of data in the database. As an example, you can configure a SELECT statement to run against the database and then have the results of the query appear in an alert to validate the data that is returned. We discuss this capability in the next section.
There is a downside to using the additional options available in the System Library—you cannot configure these options using the Operations console graphical interface. To use this synthetic transaction, you would create it using the Operations console, and then use Visual Studio to edit the XML file for the management pack that contains the synthetic transaction to configure the other options.
In this section, we walk through the steps to accomplish this. Before you can perform this process, you must create the OLE DB synthetic transaction using the Operations console, and export the management pack containing the transaction. We will assume here that the management pack has been exported to the Sample.Management.Pack.xml file on the desktop:
Open the management pack file using Visual Studio 2005 and search for “System.OleDbProbe.” The search locates the section of the management pack containing the XML that makes up the OLE DB synthetic transaction. The section will look something like this:
<LINELENGTH>90</LINELENGTH><ProbeAction ID="Probe" TypeID="System!System.OleDbProbe"> <ConnectionString>Provider=SQLOLEDB;Server=THUNDER.ODYSSEY.COM; Database=OperationsManager;Integrated Security=SSPI</ConnectionString> </ProbeAction>
After locating the section in the XML document, add the following additional options before the </ProbeAction> line:
Query—. Used to run a query against the database defined in the connection string (example:
Select * FROM Table1).GetValue—. Sets whether or not the query defined in the previous option is outputted or not (possible values are “true” or “false”).
IncludeOriginalItem—. Because the Oledb.Probe module is a probe-action module, it will need a trigger in most cases. However, in some scenarios, the input item data needs to be preserved, and this element allows you to set this (values are “true” or “false”).
OneRowPerItem—. If multiple rows are returned by the query string, then setting this causes multiple items to have a separate row for each (values are “true” or “false”).
DatabaseNameRegLocation—. In your environment, the database name might not be available to you and must be read from a Registry location. In other words, you would use this option if the DatabaseName is not provided in the ConnectionString and you can provide the Registry location information here (example: SOFTWAREMicrosoftMicrosoft Operations Manager3.0SetupDatabaseName, which is stored in the Registry on the management server).
DatabaseServerNameRegLocation—. As with the previous option, this allows you to read the database server name from a Registry key in place of entering it in the connection string (example: SOFTWAREMicrosoftMicrosoft Operations Manager3.0SetupDatabaseServerName, also stored in the Registry on the management server).
For this example, we will simply configure a query to run against the OperationsManager database. Therefore, the updated section of the XML should look something like this:
<LINELENGTH>90</LINELENGTH><ProbeAction ID="Probe" TypeID="System!System.OleDbProbe"> <ConnectionString>Provider=SQLOLEDB;Server=THUNDER.ODYSSEY.COM; Database=OperationsManager;Integrated Security=SSPI</ConnectionString> <Query>SELECT MPName FROM dbo.ManagementPack</Query> <GetValue>true</GetValue> </ProbeAction>
This code will run the "SELECT MPName from dbo.ManagementPack" query against the Operational database, and display the management packs imported into OpsMgr. We will know by seeing output that the database is online and responding.
Be aware that this test does not output the query results. If you need to display the output in an alert, the best approach is to create a monitor and use the Oledb.Probe write action (which is a standard OpsMgr write action) to generate the data for the monitor. Chapter 23, “Developing Management Packs and Reports,” includes additional information on creating management packs using XML.
Tip: More Information on Write Actions
More information about write actions and other components of the OpsMgr workflow can be found on Steve Wilson’s AuthorMPs site at http://www.authormps.com/dnn/Concepts/WorkflowBasics/ModuleTypes/tabid/115/Default.aspx.
To read data in from the Registry (if the database information cannot be provided in the connection string for some reason), you can use the DatabaseNameRegLocation and DatabaseServerNameRegLocation options. The following is an example of code that would read these values from the Registry. For our example, we will assume that we have stored the database name in the HKLMSoftwareMicrosoftMicrosoft Operations Manager3.0SetupDatabaseName key, and the server information in the HKLMSoftwareMicrosoftMicrosoft Operations Manager3.0SetupDataBaseServerName key by default. (These are the locations used to store the location of the Operational database.) You may need to create these keys as required. The code sample is shown here:
<ProbeAction ID="Probe" TypeID="System!System.OleDbProbe">
<ConnectionString>Provider=SQLOLEDB;Integrated Security=SSPI</ConnectionString>
<Query>SELECT MPName FROM dbo.ManagementPack</Query>
<GetValue>true</GetValue>
<DatabaseNameRegLocation>
SOFTWAREMicrosoftMicrosoft Operations Manager3.0SetupDatabaseName</DatabaseNameRegLocation>
<DatabaseServerNameRegLocation>
SOFTWAREMicrosoftMicrosoft Operations Manager3.0SetupDatabaseServerName
</DatabaseServerNameRegLocation>
</ProbeAction>
This code runs the SELECT MPName from dbo.ManagementPack query again, but the server and database information is not included in the connection string. This time, we read the information from the Registry on the management server. This may be for security reasons, where it is not acceptable to show server and database information in clear text in a connection string.
After creating the OLE DB data source monitor and allowing sufficient time to pass to enable data to populate the reports, we are able to look at the performance data related to the OLE DB data source monitor we created. Perform the following steps:
Navigate to the Monitoring space and expand the Synthetic Transaction folder in the navigation tree to open the OLE DB Data Source State view. You can see the OLE DB data source monitor we configured displayed on the right-hand side. Right-click the object; then select Open -> Performance View, as we previously showed in Figure 18.16.
You can see the performance view for the OLE DB data source. The available performance counters are Open Time and Connection Time. Select one or both of these counters and view the graph. Figure 18.22 shows the graph from our Odyssey environment, where the watcher node is Hydra. If you configured additional watcher nodes, these will appear as separate counters, so you can compare the open time and connection time from different watcher nodes.
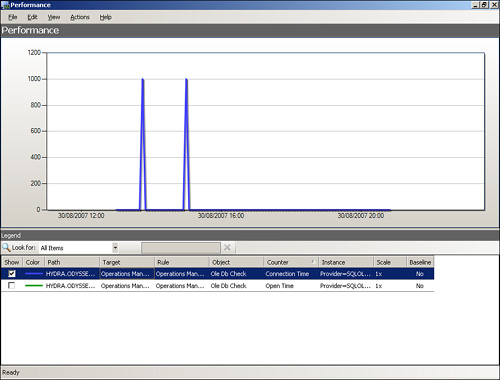
This section looked at the process for creating a synthetic transaction to monitor a database using an OLE DB connection. Although we monitored the OperationsManager database hosted by SQL Server, you can monitor any database that supports OLE DB as long as the OLE DB driver is installed where required. As an example, if you will be monitoring Oracle databases, you will need to install the Oracle client to use either the Microsoft or Oracle OLE DB driver.
We also showed the performance data you could generate using the OLE DB data source synthetic transaction.
Although Operations Manager makes it straightforward to monitor applications, the level of monitoring you ultimately achieve depends on how well the application integrates with the operating system. Factors that play into this include the following:
Whether the application logs events to the Windows NT Event logs
If the application runs using Windows services
Whether there are Windows performance counters associated with the application
Even if an application is well integrated with the operating system, it still may be necessary to validate that the application is actually responding. This is where the TCP port synthetic transaction comes in.
A large number of applications use a particular TCP port to send data. Some examples include port 25, used by email applications, and port 5723, used by the OpsMgr agent. The level of integration between the application and the operating system will affect the amount and type of monitoring data that may be collected. For those applications that are not integrated, TCP port monitoring may be the only way to verify whether an application is online and responding.
It is important to note that just because an application’s TCP port is responding, this does not necessarily indicate that the application is working correctly. Monitoring a TCP port does help build a picture of application availability and response, but preferably it is not the only method used for testing an application. This is particularly true for non-Microsoft applications that run on the Windows platform, such as Oracle and Siebel, for example.
The TCP port management pack template allows you to create the necessary monitoring objects to test connectivity to a specified TCP port. The template also collects the performance and response information of that port, allowing you to analyze the response time of the TCP port.
In addition to monitoring applications using the TCP port synthetic transaction, you can also monitor hardware devices such as Simple Mail Transfer Protocol (SMTP) relay hardware devices that respond on port 25, as an example. We do not address the SMTP relay aspect of TCP port monitoring in this chapter; you can find that information in Chapter 22, “Interoperability.”
This section looks at the process for creating a TCP port monitor. Perform the following steps:
Launch the Operations console and navigate to the Authoring space.
Right-click on the Management Pack Templates sub-tree and select Add monitoring wizard..., as we previously showed in Figure 18.3.
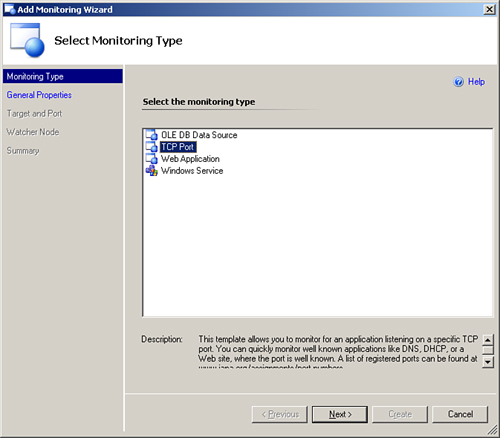
The screen shown in Figure 18.23 is displayed. From this screen, select TCP Port and click Next.
On the following screen, input the name and a description for the synthetic transaction and select the management pack you will save the transaction rules to. For this example, we will call the transaction OpsMgr Management Server Port Monitor and we will select the Sample management pack we have already used in this book. Click Next to continue.
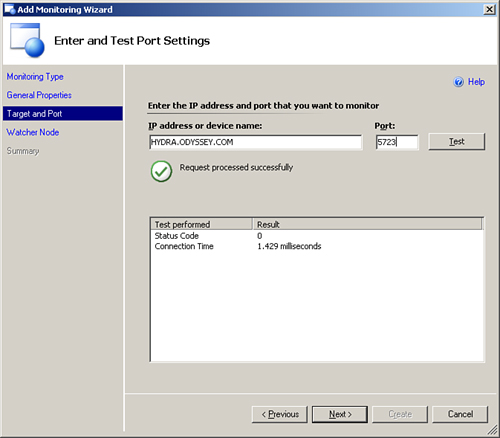
The next screen is the Enter and Test Port Settings screen. Enter the TCP Port and IP Address or device name for the object and port you wish to test. Because we are monitoring the OpsMgr port on the management server, we will configure the device to be HYDRA.ODYSSEY.COM and configure the port as 5723. Type these values into the boxes.
Of course, in your environment you would input any server or network device’s IP address or DNS name, and the appropriate port to monitor. Click the Test button to validate the port. Figure 18.24 shows the completed screen. Click Next to continue.
The following screen is the Choose Watcher Nodes screen, where the computer initiating the test is selected and configured. The screen lists all computers running OpsMgr agents, and you can tick the checkboxes to carry out the test on the computers you choose. In our example, we will run the test from the PANTHEON.ODYSSEY.COM machine. We will also configure the test to run every five (5) minutes instead of the default setting of two (2) minutes. You can refer to Figure 18.6 for an example of the Watcher Node screen. Click Next, and you will continue to the final screen of the Add Monitoring wizard.
The final screen summarizes the information you have inputted throughout the wizard. Click Create to complete creating the TCP port synthetic transaction. Figure 18.25 displays the summary screen.

Similar to the other synthetic transactions we have discussed in this chapter, the TCP port monitor synthetic transaction collects performance data. You can view this information using the process described next:
Navigate to the Monitoring space; expand the Synthetic Transaction folder in the navigation tree, then open the TCP Port Checks State view. Displayed on the right-hand side is the web application monitor we configured earlier. Right-click the object, then select Open Performance View, similar to what we did earlier in Figure 18.16.
The Performance view opens, with the only performance counter available being the Connection Time counter for the TCP port we are monitoring. Of course, if we configured additional watcher nodes, these nodes would appear as separate counters, allowing us to compare the connection time from different watcher nodes. Figure 18.26 shows this Performance view.

We have discussed the basics of monitoring LOB applications using TCP ports, documenting the process for creating a TCP port monitor, and monitoring the OpsMgr management server port of 5723. Although we chose to focus on monitoring an application port, it is very useful to use the TCP port monitor to test ports used by network devices and SMTP relay devices as well. Chapter 22 discusses the process for creating a TCP monitor.
We also looked at the performance data available from the TCP port monitor synthetic transaction, and we showed you where to view this information in the Operations console.
In addition to the synthetic transaction management pack templates available out of the box with OpsMgr, a number of individual product management packs provide synthetic transaction monitoring of their own.
The Microsoft Exchange management pack is one of the major management packs to use synthetic transactions for validating application response and availability.
Note: Clarifying the Exchange Management Pack Version
In this section of the chapter, all references to the Microsoft Exchange management pack reference the Microsoft Exchange 2003 management pack for Operations Manager 2007, unless otherwise specified.
The Exchange management pack performs in-depth monitoring of Exchange, including monitoring for Windows events, monitoring the status of the services, and checking for performance thresholds that are exceeded. The management pack also contains a number of scripts that perform Exchange simulations. We will look at these simulations or synthetic transactions in more detail.
The Exchange management pack includes scripts, rules, and monitors to carry out simulations on the key Exchange components. It contains synthetic transactions for MAPI (Messaging Application Programming Interface) logon, Mail Flow, Outlook Web Access (OWA), Outlook Mobile Access (OMA), and Exchange ActiveSync (EAS). These synthetic transactions are performed using an Active Directory user account and Exchange mailboxes, which typically are configured when you deploy the management pack.
We will examine some of these different transactions in more detail in the next sections, and look at the process for configuring the Exchange environment prior to deploying the management pack, which uses the Exchange Management Pack Configuration Wizard.
In order for the Exchange management pack to fully monitor Exchange, you must configure your Exchange environment for Operations Manager.
The configuration includes creating of a number of disabled user accounts and associated mailboxes and assigning a number of security permissions throughout the Exchange environment. You can perform these configurations manually as documented in the Exchange Management Pack Guide (which you can download from http://technet.microsoft.com/en-us/opsmgr/bb498235.aspx#EFG) or use the Exchange Management Pack Configuration Wizard, which is by far the easiest (and recommended) method. You can find the specific details of the changes to make in the Exchange Management Pack Guide.
The Exchange Management Pack Configuration Wizard is available for download at http://go.microsoft.com/fwlink/?LinkId=35942.
After downloading the configuration wizard, extract the downloaded files and install the utility. The utility requires that you have .NET Framework 2.0 and the Exchange System Manager tools installed on the computer on which you run the wizard. Therefore, unless you have these client tools on a workstation, we advise installing the tool on an Exchange front-end server.
After meeting the prerequisites and installing the tool, execute it using an account with Exchange Administrator rights to the entire Exchange Organization. Perform the following steps:
When you launch the tool, the wizard presents a welcome screen that we show in Figure 18.27.
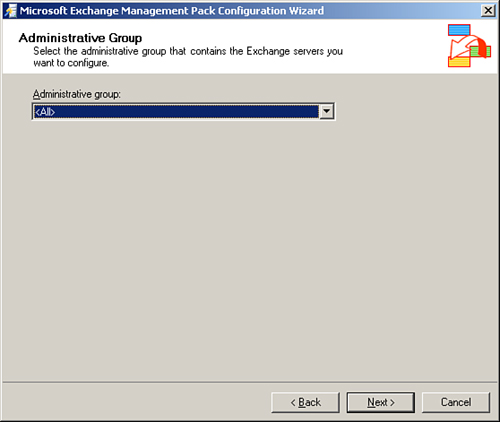
Click Next, and select the Administrative group to apply the changes to. We will select the <All> option from the drop-down list. Figure 18.28 shows the Administrative Group screen. Click Next to continue.
The following screen displays the Exchange servers in your environment. Select those computers with OpsMgr agents installed that you wish to monitor. The server selection screen is shown in Figure 18.29. Click Next.
At the next screen, you can choose to select the default configuration or customize your options. We will select Custom configuration so that we can choose our own settings throughout the wizard.
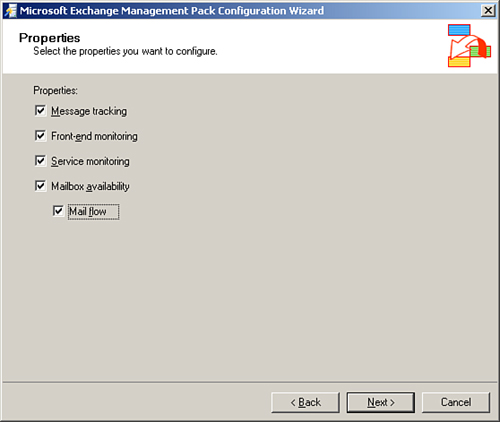
The first screen of the custom configuration option allows us to choose the properties we want to configure. Select all options, as shown in Figure 18.30, and click Next to continue.
The screen shown in Figure 18.30 allows you to enable or disable Message Tracking and Front-End monitoring. We will choose to enable both and continue.
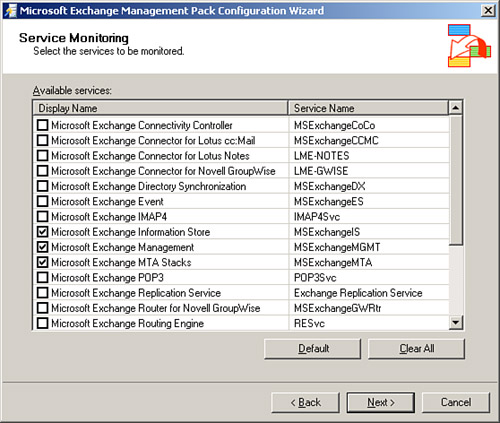
Figure 18.31 allows you to specify the Exchange services to monitor. Unless you have a requirement to monitor a specific service, click the Default button and click Next to continue.
The next screen is an important one. It allows you to choose whether to have an Exchange mailbox created and therefore whether to monitor servers or individual stores. We will choose to monitor servers. Click Next to continue.
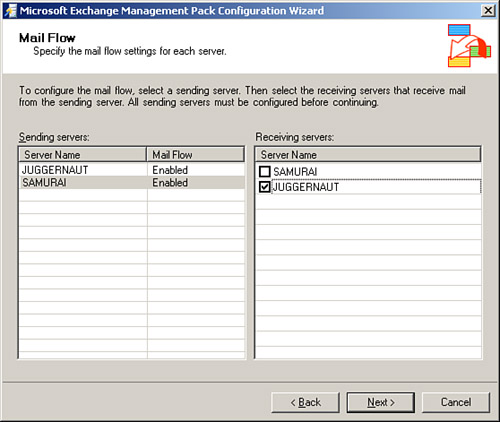
In the following screen, we configure the mail flow options. We are indicating which email servers send mail to which other email servers. The configuration here will depend entirely on your environment. We have configured our environment as shown in Figure 18.32.
The final screen of the Exchange Management Pack Configuration Wizard is where you specify the Exchange Access user account that we mentioned earlier. Input the account, click Next to continue, and finally click Next on the summary screen.


The wizard will apply the changes to the Exchange environment; once that is complete and Active Directory has sufficient time to replicate the changes, the Exchange environment is ready for monitoring by Operations Manager. You will need to rerun the wizard if you add additional Exchange servers.
Note: Importing the Exchange MP Prior to Running the Configuration Wizard
Before running the wizard, it is essential to import the Exchange management pack into OpsMgr and verify that the Exchange servers are already discovered. The discovery process can take up to 24 hours, particularly if you have Exchange hosted in a clustered environment. If you have not imported the management pack and discovered the servers before running the wizard, you may receive errors.
Now that we have configured Exchange for Operations Manager, let’s look at what we want to accomplish with monitoring Exchange. The bottom line when it comes to Exchange functionality is that Exchange needs to route mail between mailboxes and between different Exchange servers in the environment and beyond. If this functionality is not working, Exchange’s functionality is severely hindered.
For this reason, monitoring Exchange mail flow is critical to ensure your Exchange environment is working correctly. The Exchange management pack provides a number of scripts that work out of the box after preparing the Exchange environment (discussed in the “Preparing to Monitor Exchange” section of this chapter), monitoring mail flow in your environment and beyond.
These scripts use Exchange mailboxes configured specifically for OpsMgr to use to send emails and verify they arrive at their destination within an acceptable timeframe. The data is used to determine the health of the Exchange system, generating alerts and altering the status of the relevant monitors if mail messages are not received as expected. This level of monitoring helps identify mail flow problems before they seriously affect the Exchange infrastructure by filling up mail queues and such.
After mail flow, the next most important capability in an Exchange infrastructure is to login to mailboxes from Microsoft Outlook or another MAPI-compatible application. This process is known as establishing a MAPI logon.
MAPI is a messaging architecture and a Component Object Model-based API for Microsoft Windows. MAPI allows client programs to become email-enabled or aware by calling MAPI subsystem routines that interface with certain messaging systems and message stores. A typical example of a MAPI-enabled server product is Microsoft Exchange, and an example of a MAPI-enabled client program is Microsoft Outlook.
The scripts in the Exchange management pack perform synthetic MAPI logons, using the mailboxes created by the Exchange Management Pack Configuration Wizard. These scripts behave as if they were a connection coming from a MAPI-enabled application; as far as Exchange is concerned, these connections are coming from such an application. Exchange thus responds as it would to a true MAPI logon, allowing OpsMgr to verify whether MAPI logons are working and if the logon performance time is acceptable.
As with mail flow monitoring, Operations Manager will generate alerts and change monitor states if the script fails to perform a MAPI logon to a particular Exchange server or mailbox store.
In addition to using MAPI-enabled applications such as Outlook to log into Exchange, many companies use OWA, OMA, and EAS to access mail across the Internet. If these systems are unavailable, remote users are often not able to access their emails or synchronize their smartphones.
To assist with checking availability, the Exchange management pack includes rules that monitor these Internet-based components of Exchange. The Exchange management pack contains scripts, rules, and monitors that simulate a login to the OWA, OMA, and EAS websites and validate that the sites respond correctly and within an acceptable time. These scripts also use the Exchange mailboxes created specifically with the Configuration Wizard to monitor Exchange using OpsMgr.
OpsMgr will generate alerts if OWA, OMA, or EAS do not respond. It is also possible to specify custom URLs to monitor if you have customized the OWA, OMA, or EAS sites in your particular environment. You will specify the URLs in the Registry on the front-end Exchange servers, in the HKLMSoftwareMicrosoftExchangeMOM<FrontEndServerName> key. You will create the following string values to store OWW, OMA, and EAS URLs:
CustomUrls
CustomOMAUrls
CustomEASUrls
These processes are documented in the Exchange Management Pack Guide.
The Exchange sections of this chapter looked at the synthetic transactions provided in the Exchange management pack and the additional monitoring capabilities this adds to OpsMgr. We also discussed the process for preparing the Exchange environment for monitoring with OpsMgr by using the Exchange Management Pack Configuration Wizard.
After creating your synthetic transactions, you will want to utilize the monitoring provided by these transactions to the maximum. You will also want to create and configure distributed applications (DAs) using the designer tool (more information on the Distributed Application Designer is found in Chapter 19).
One very nice feature of OpsMgr is the ability to take the synthetic transaction objects you created and use them in your own distributed applications. This capability enables the results of the simulations to affect the status of the application, and therefore affects your availability reports. The synthetic transaction functionality allows the status and availability of the applications to not only be based on Windows events, service status, and performance thresholds, but also on whether or not the application is actually responding as you expect. By measuring response time, synthetic transactions can assist you in meeting your SLAs.
The additional depth of monitoring utilized with DAs means that the monitoring information obtained from a DA you configure can be very accurate when comprised of a combination of service information, Windows events, performance data, and simulated connections into the application.
When you create a synthetic transaction, Operations Manager adds that transaction to the Perspective class. This is true for all synthetic transactions and allows them to be easily located and added to DAs as required. We will use the Perspective class in our example to add the synthetic transaction we have created to a new DA.
We will now look at the process to add a synthetic transaction to a DA. In this example, we will create a basic DA to monitor Operations Manager using the TCP port and OLE DB synthetic transactions we created earlier in this chapter (in the “Using OLE DB to Monitor Databases” and “Monitoring LOB Applications Through Port Activity” sections). Please be aware that the process for creating a DA is also included in Chapter 19. There may be a level of duplication with the material in this chapter, but this duplication is necessary to enable us to demonstrate the example in this chapter.
To reiterate, in this section, we will:
Create a distributed application
Add component groups
Associate components with component groups
Establish relationships between component groups
We illustrate this in the flowchart in Figure 18.33.

To configure the new DA, perform the following steps:
Open the Operations console and navigate to the Authoring space.
Right-click Distributed Applications and select Create a new Distributed Application.... The first screen in the Distributed Application Designer opens. You will provide a name and optional description for the DA, and select a template to use and a management pack for saving the DA. In our example, we will name our distributed application OpsMgr Environment, and we will select the Line of Business Web Application template. We will use the drop-down box to save the DA to the Sample management pack we have previously used in this book. We show the completed screen in Figure 18.34.
Click OK, which loads the template and enters the Distributed Application Designer.
The screen shown in Figure 18.35 is displayed. From here, you can build out the DA.
We will start by populating our application with the database and website components we created earlier in the “Using OLE DB to Monitor Databases” and “Monitoring Web Applications” sections of this chapter. Drag the OperationsManager database from the database object type on the left into the database component. We show this in Figure 18.36.
Next, repeat the procedure to add the Operations Manager 2007 web console site to the website’s component, dragging it from the bottom-left side of the screen up into the website’s component.
Now that we have the default components populated, we need to create a custom component that will contain our transactions.
Click the Add Component button, highlighted in Figure 18.37.
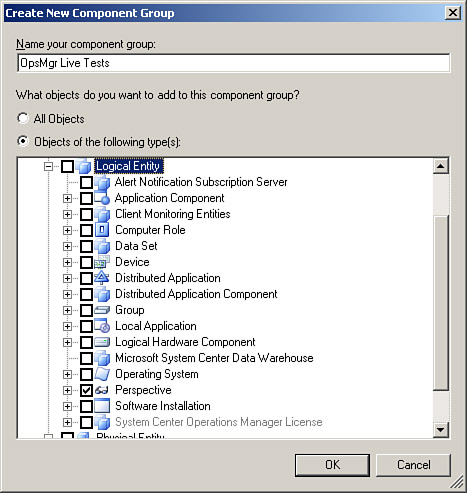
After a short delay during which the designer collects information about all the classes present in OpsMgr, the Create New Component Group dialog appears. We will name our component OpsMgr Live Tests, select the objects of the following type(s): radio button, and tick the classes shown in Figure 18.38. This screen allows us to add the transactions we created earlier. As you can see, we have ticked the checkbox next to the Perspective class, which is the class all synthetic transactions are added to automatically.
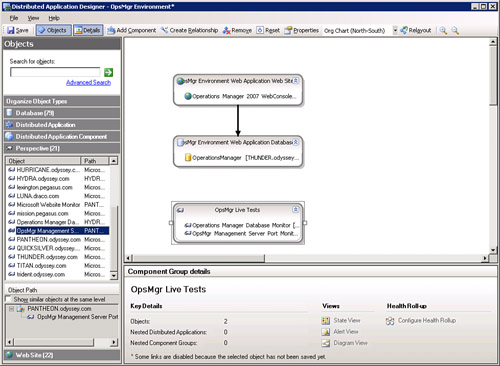
After selecting the relevant classes, click OK and the class appears in the object organizer on the left. Under Perspective, you can locate the two synthetic transactions we created—Operations Manager database monitor and OpsMgr Management Server Port Monitor—and drag them into the new component we have just created. Figure 18.39 shows the result.
We know that if the Operations database is offline, the management server cannot work correctly, which means that one or both of the synthetic transactions will fail. We will want to create a relationship to ensure that if the Operations database is offline, the transaction’s state will update to reflect this.
In Figure 18.39, click the Create Relationship, and drag the cursor from the OpsMgr Live Tests component to the database component since the transactions use the database (e.g., are dependent on it). Figure 18.40 shows the results.
For this particular example, we will assume that we do not want to customize the DA any further; therefore, we will click Save and close the DA designer. Chapter 19 includes more information on the Distributed Application Designer and additional options.
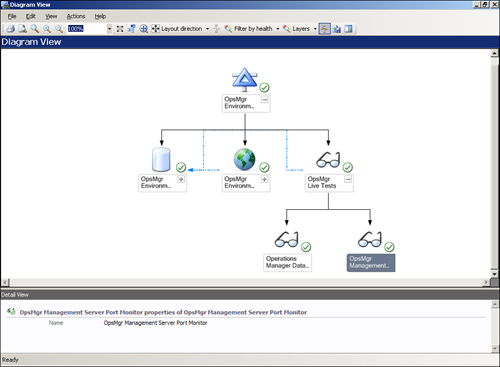
After creating the DA, we can look at the diagram view to validate that it is configured correctly. Open the diagram view for the DA (by right-clicking on it and selecting Open -> Diagram view), and you will be presented with a view similar to that shown in Figure 18.41.


In this section, we looked at the functionality included in OpsMgr that makes it possible to add synthetic transactions to new and existing DAs for monitoring and reporting purposes. We also summarized the process for adding a previously created synthetic transaction to a new DA that we created in this section.
In this chapter, we looked at the different synthetic transactions offered by OpsMgr out of the box. These include the Web Application, TCP Port, ASP.NET Application, ASP.NET Web Application, and Windows Service management pack templates.
We explained the role of watcher nodes in monitoring applications using simulation, and covered the process for selecting watcher nodes. We also looked at the different types of synthetic transactions including web application, TCP port monitors, and OLE DB data source synthetic transactions and the processes for creating them and configuring advanced options.
In addition, we covered the role synthetic transactions play in monitoring Exchange using the Exchange management pack and the different types of synthetic transactions that are included with the management pack. Finally, we looked at the ability to add synthetic transactions to distributed applications created using the Distributed Application Designer, and we included the process for adding synthetic transactions to distributed applications.
The next chapter discusses managing a distributed environment. It covers the built-in distributed applications provided by OpsMgr and discusses using the Distributed Application features of OpsMgr to create your own custom management solutions.