
System Center Operations Manager 2007 (OpsMgr) facilitates monitoring and managing servers, clients, applications, operating systems, network devices, and business services, using a combination of built-in technology and third-party additions. The monitoring architecture of Operations Manager 2007 is significantly different from that of Microsoft Operations Manager (MOM) 2000 and 2005; in OpsMgr 2007, the focus moves from rule-based monitoring to the concept of monitors. Monitors can provide the real-time state of a component at a very granular level.
This chapter discusses rules, monitors, and alerts (defined in Table 14.1), including the process for locating them in a complex environment. We will also discuss providers, which dictate what data OpsMgr will collect. Additionally, we will look at the process for tuning rules in a typical environment.
Table 14.1. Primary Monitoring Objects Used by OpsMgr 2007
Object | Description |
|---|---|
Rules | Rules define what you want to monitor. In MOM 2000 and 2005, rules formed the backbone of the business logic. Rules defined what data to collect, and they described how to process and respond to that data. Rules are still very important in OpsMgr 2007. |
Monitors | Monitors represent the state of individual components of a system. They gather data from events, performance counters, scripts, and other sources such as Windows services. You can configure monitors to “roll up” their state; this allows for the creation of dependencies that assist in the accurate mapping and monitoring of complex and distributed systems. Monitors can generate changes in state and perform diagnostic and recovery tasks based on that change. |
Alerts | Alerts are raised by either rules or monitors and call attention to issues that are occurring. Although monitors and states are more prevalent than alerts in Operations Manager 2007, using alerts provides additional information to an issue by interfacing with the Knowledge Base. Unlike in MOM 2000 and 2005, an alert generated by a monitor in OpsMgr 2007 can be automatically resolved when the monitor returns to normal, thus reflecting the fact that the issue no longer exists. |
Rules and monitors, together with everything else needed for monitoring, are assembled into management packs, which are grouped by application or operating system, such as the Windows Server 2003 and Exchange 2003 management packs. We discuss the structure of a management pack in Chapter 13, “Administering Management Packs.”
This chapter discusses the different rule and monitor types in OpsMgr and the process of creating rules and monitors. We will also address alerts and adding knowledge information to alerts. We explain the concept of overrides as well as document the process for creating an override and locating a previously created override. Finally, we will look at approaches for monitoring and tuning alerts in OpsMgr.
As Information Technology (IT) systems continue to become more inclusive and versatile, the quantity and complexity of potential issues can proliferate. With businesses becoming more reliant on their IT systems, these issues are more noticeable and failures have a greater impact. Ensuring your systems are working correctly is a difficult and time-consuming task, particularly in a distributed environment. Traditional monitoring for IT systems tends to be reactive, with problems unidentified until they have a noticeable impact. Reactive response to issues is unacceptable in today’s business and IT environments.
Operations Manager 2007 provides a means to consolidate and automate system monitoring and maintenance into a single user interface where you can identify potential issues early on. This capability enables you to address and resolve a large number of issues before they affect your production systems!
OpsMgr collects data from monitored systems about the operational health state of each computer and the applications and components that make up those systems, including hard drives and databases. This data enables an accurate and up-to-date overview of one’s IT environment. In addition, OpsMgr is able to initiate scripts and responses based on a schedule or meeting a condition, such as a certain event appearing in a monitored system’s Windows NT Event log.
In complex environments with a large number of installed management packs, the number of rules and monitors can run into the thousands, making the environment cumbersome to manage. With that in mind, it is critical to tune the alerts in OpsMgr to minimize the number of false alerts appearing in the monitoring console. With the introduction of monitors in OpsMgr 2007, this process is significantly less difficult than with earlier versions, but it is still an essential part of any OpsMgr deployment.
The process of tuning involves disabling rules and monitors when they are not required. It also includes altering threshold values to ensure that the configuration is appropriate to your specific environment. This chapter begins with focusing on the major types of rules available in Operations Manager 2007.
As in the previous versions of MOM, rules exist to perform various functions. Although OpsMgr 2007 now includes monitors, rules still form a key part of the product. You will use rules where it is not appropriate to create a monitor—and a large amount of OpsMgr monitoring still utilizes rules.
Rules exist primarily to collect performance data, execute timed tasks, and launch scripts. OpsMgr 2007 has three major rule types:
Alert-generating rules
Collection rules
Timed commands
We will look at these in detail in the next three sections.
Tip: Viewing a Demo of Creating Rules
Microsoft provides step-by-step instructions on creating rules with a rule creation webcast, located at http://www.microsoft.com/winme/0701/28666/Rules_Demo.asx.
To generate an alert for a condition that does not call for a monitor (such as a backup success event), you can use an alert-generating rule. A number of different providers are supported by alert-generating rules, similar to the providers used with monitors:
Windows NT Event log
Log file
Windows Management Instrumentation (WMI)
Simple Network Management Protocol (SNMP) events
This section explains the process for creating an alert rule by creating a basic Windows Event Log alert rule. The rule generates an alert if the Computer Browser service stops. Perform the following steps:
Open the Operations console and navigate to the Authoring space.
Expand Monitoring Objects and right-click Rules. Select Create New Rule....
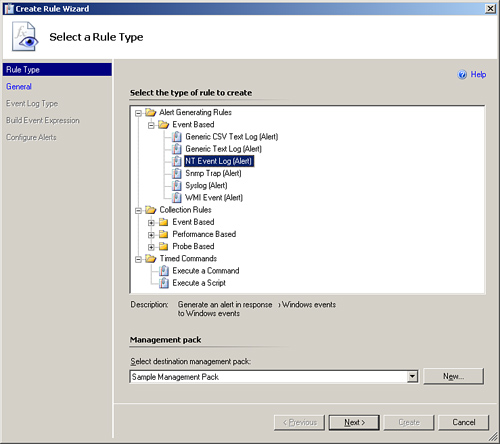
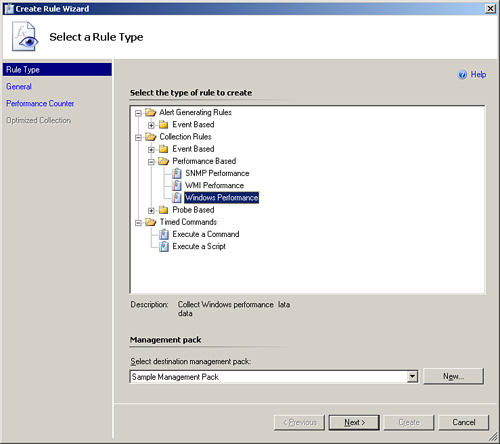
The Create Rule Wizard displays the Select a Rule Type screen shown in Figure 14.1. From this screen, select Alert Generating Rules -> Event Based -> NT Event Log (Alert). You will also want to specify the destination management pack or target for the rule. We will use a management pack we created called Sample Management Pack. (If you need to create the management pack here, go ahead and click the New... button and then enter the name of your new management pack.) Click Next.
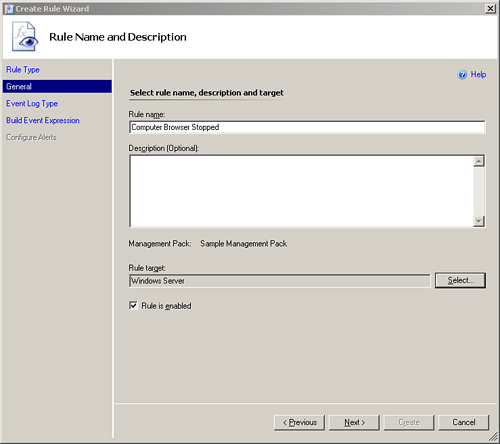
We need to name the rule and configure a target for it. In our example, we will call the rule Computer Browser Stopped. We will target the Windows Server class because we want the rule to apply to all Windows servers. We also have the option to enable (the default) or disable the rule.
Figure 14.2 displays the completed Rule Name and Description screen. Click Next to continue.
On the following screen, we select the Event log in which we will look for the event. In this particular case, it is the System log. You can click the ... button to browse and select the log, or you can simply type in the name of the log. Click Next.
At the next screen, we configure the condition we want to match for the alert rule. The condition is those items we will check against to find the event when it appears in the event log. Figure 14.3 displays the event (Event ID 8033) in the System Event log on which we want to alert.
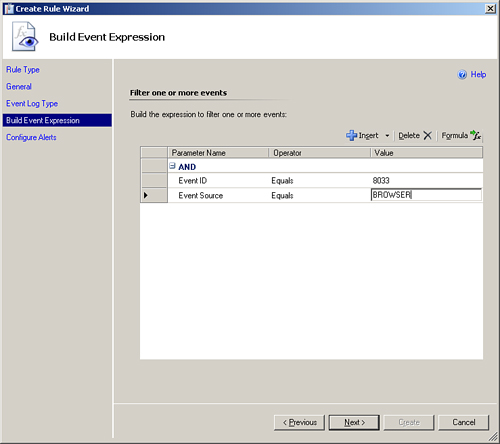
Because we now know what we want to match against, we can configure the Build Event Expression screen in the wizard. To match the event, we will use the Event ID and Event Source parameters. Configure the Event ID to be Event ID Equals 8033 and the Event Source to be Event Source Equals BROWSER. This expression (known as a filter) is shown in Figure 14.4. Click Next to continue.
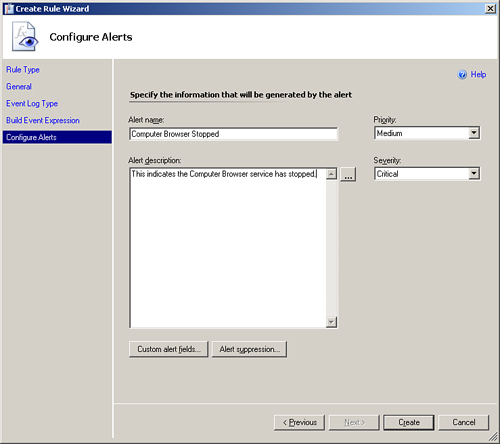
The final screen of the Create Rule Wizard configures the actual alert that OpsMgr will generate. We will leave the alert name as it is (Computer Browser Stopped) and add the description text This indicates the Computer Browser service has stopped. (see Figure 14.5). Notice this rule has a Priority of Medium and a Severity level of Critical. Click Create to create the new alert rule.

Collecting data is an important function of rules. Whereas you will use monitors to represent the health of a component based on an event or performance threshold, using rules provides the means to collect this data for trending and reporting purposes.
You can configure collection rules to collect event or performance data and can additionally configure them to launch a script, which generates an event for collection. This is referred to as a probe.
Because the most common type of collection rule is a performance collection rule, we will discuss the specific steps to create one. We will also describe the new Probe collection rule type. Configuring a performance collection rule is actually quite similar to configuring a monitor.
This process will show you how to create a performance collection rule. For our example, we will collect the % Processor Time counter for the print spooler (spoolsv) process. Perform the following steps:
Open the Operations console and navigate to the Authoring space.
Expand Monitoring Objects and right-click Rules. Select Create New Rule....
The Create Rule Wizard displays the Select a Rule Type screen shown in Figure 14.6. This is similar to the screen shown in Figure 14.1, but we are selecting Collection Rules -> Performance Based -> Windows Performance as the rule type. We also select the Sample Management Pack we previously created as a target for the rule. Click Next to continue.
On the Rule Name and Description screen, we name the rule and configure a target for it. We will call our rule Print Spooler Process CPU Time and target the Management Server class because we want the rule only to apply to management servers.
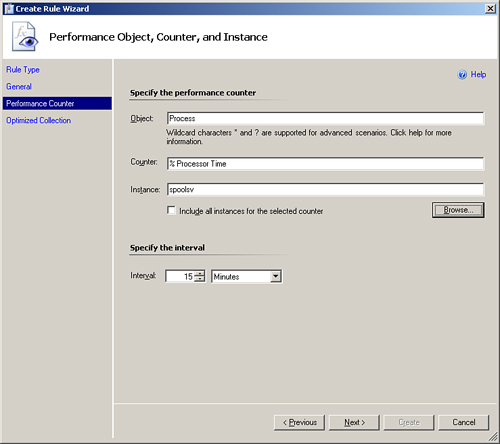
Now we select the performance counter we want to collect. You can type this manually. However, this is often confusing and time consuming. It is usually easier to browse and select the Process -> % Processor Time counter for the spoolsv process (Select instance from list). For this example, we will select the counter on Hydra (the counter actually exists on all servers; specifying Hydra simply means we are not browsing to another server to select the counter). Figure 14.7 shows the performance counter selected.
At the Performance Object, Counter, and Instance screen (shown in Figure 14.8), we will leave the collection interval at the default of 15 minutes. Click Next to continue to the final screen of the wizard.
The last screen in the wizard allows you to configure optimized collections. OpsMgr uses optimized collections to reduce the amount of disk space a performance counter collection uses in the Data Warehouse. We explain this next in more detail. Click Create to create the performance collection rule.

In previous versions of Operations Manager, performance data constituted a large part of the reporting data warehouse, and it was very easy to (inadvertently) generate huge amounts of data with a small number of performance counters. Microsoft has addressed this issue in OpsMgr 2007 by introducing optimized collections. You configure this new feature on the final screen of the Create Rule Wizard screen when creating a new performance collection rule, which we show in Figure 14.9.

Use the Optimized Performance Collection Settings screen to enable optimized collections and set the tolerance level for the performance data you are collecting. You can configure two options on this screen (shown in Figure 14.9):
Absolute number—. This is where you specify the top value for a collection, regardless of the collection schedule. For example, if the value is set to 90% for CPU, and the CPU hits 90%, a data collection takes place regardless of the collection schedule.
Percentage—. This is the percentage of change that must occur for a data collection to occur. For example, if the percentage were set to 10%, the performance counter would need to change by 10% (say, from 60% to 70%), for a data collection to occur.
We are not suggesting that you configure all performance collection rules to use optimized collection, but this may be appropriate for counters that typically generate a large amount of data.
The probe-based rule is a new type of rule in OpsMgr. In MOM 2005, it was possible to create a script and forward events and alerts into the MOM database using the VBScript ScriptContext object. This was a useful technique because it allowed you to output the results of a script such as a file size-monitoring script directly into MOM. The VBScript ScriptContext object does not exist in OpsMgr. In place of this feature, you can use a probe-based rule. In OpsMgr 2007, instances of using a probe-based rule include
When you want a script to generate events for a condition but you do not want those events appearing in the log files on the computer.
When you want to pass more information to OpsMgr than is possible in a basic Windows event.
With this new method, the script is inserted into the probe rule and the new VBScript object objPropertyBag is used. This object is a container for the information that OpsMgr understands.
In addition to probe-based rules, you can still launch scripts using rules, similar to MOM 2005. For instance, you could use a rule to launch a script that logs an event directly to the Operations Manager Event log.
One example of this would be a ping script. The script would generate events logged to the Operations Manager Event log for collection by OpsMgr.
The following steps document how to create an Execute a Script rule to run a ping script:
Open the Operations console and navigate to the Authoring space.
Expand Monitoring Objects and right-click Rules. Select Create New Rule....
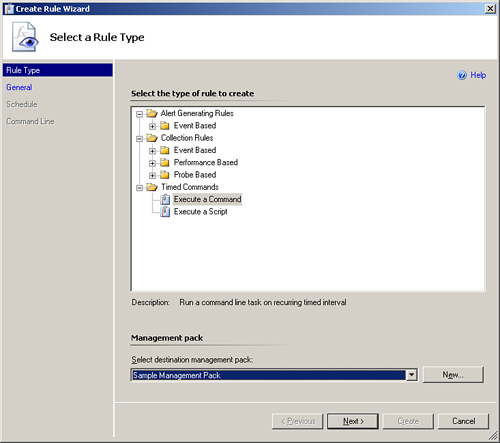
The Select a Rule Type Screen appears. In Figure 14.10, select Collection Rules -> Timed Commands -> Execute a Script. Also, select the Sample Management Pack we used earlier in this chapter as a target for the rule. Click Next.
Next, we name the rule and configure a target for it. We will call this rule Ping Script Rule and will target the Management Server class because we want to launch the ping script from a management server. Alternatively, you could create a group and target the monitoring to the group.
Set the rule category to AvailabilityHealth. Because we are targeting a class with a number of subclasses, you may want to disable the rule to prevent it running on all subclasses. (To run the script, you would create an override enabling the rule, and target the override to the agent where you want the script to run.) Click Next.
Now, we select the schedule for running our script. In our example, we will accept the default of 15 minutes and click Next.
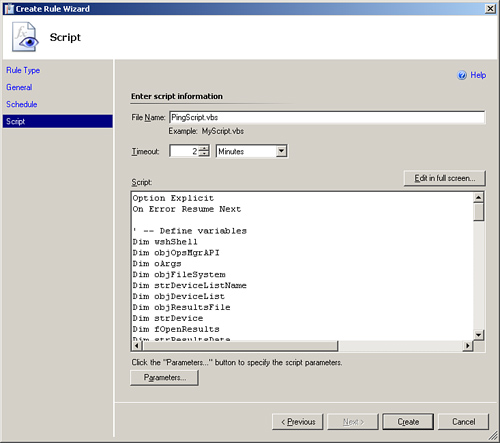
The Script screen is where the script itself is entered. The script we will use is shown here:
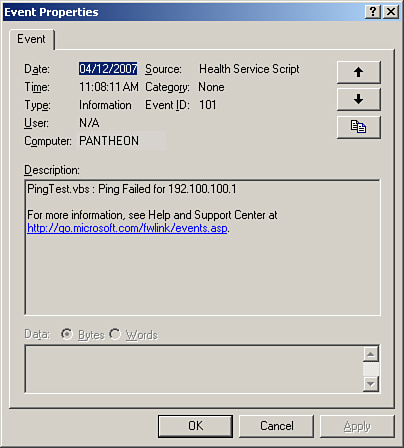
<LINELENGTH>90</LINELENGTH>Option Explicit On Error Resume Next ' -- Define variables Dim wshShell Dim objOpsMgrAPI Dim oArgs Dim objFileSystem Dim strDeviceListName Dim objDeviceList Dim objResultsFile Dim strDevice Dim fOpenResults Dim strResultsData Dim objMOMEvent Const ForReading=1 ' -- Create a Shell object Set wshShell = CreateObject("WScript.Shell") ' -- Create MOM Script API Object Set objOpsMgrAPI = CreateObject("MOM.ScriptAPI") ' -- Create the object for Parameters Set oArgs = WScript.Arguments ' -- Get the script values from parameters strDeviceListName = oArgs.Item(0) ' -- Define results file location objResultsFile = "C:PingResults.txt" ' -- Create a FileSystemObject and open device list Set objFileSystem = CreateObject("Scripting.FileSystemObject") Set objDeviceList = objFileSystem.OpenTextFile(strDeviceListName, ForReading) ' -- Run ping against each device one at a time ' -- until all devices have been read from the file and pinged Do Until objDeviceList.AtEndOfStream strDevice = objDeviceList.Readline ' -- Run the ping and pipe output to the results file wshShell.Run "cmd.exe /c ping " & strDevice & " -n 2 > " & objResultsFile,,true ' -- Open log file and read line 4 Set fOpenResults = objFileSystem.OpenTextFile(objResultsFile, ForReading) fOpenResults.ReadLine fOpenResults.ReadLine fOpenResults.ReadLine strResultsData = fOpenResults.ReadLine ' -- Generate alert if the 4th line is Request timed out. Select Case strResultsData Case "Request timed out." & vbCR ' -- Create error event to be submitted to MOM server ' --(Ping Test failed) Call objOpsMgrAPI.LogScriptEvent ("PingTest.vbs", 101, 0, "Ping Failed for " & strDevice) Case Else End Select ' -- Close Results File objResultsFile.Close ' -- Clear ResultsData Variable Set strResultsData = Nothing Loop ' -- Close Device List objDeviceList.Close ' -- Reset all variables Set wshShell = Nothing Set objFileSystem = Nothing Set objOpsMgrAPI = Nothing Set oArgs = Nothing Set objDeviceList = Nothing Set strDeviceListName = Nothing Set objResultsFile = Nothing Set strDevice = Nothing Set fOpenResults = Nothing Set strResultsData = Nothing Set objMOMEvent = NothingThe script reads the name of the device list from the parameter that we will specify in the rule. You must create the device list manually and copy it to all servers where you want to run the ping script. List the devices you want to ping in a text file (we named ours C:DeviceList.txt), with one on each line, as shown here:
<LINELENGTH>90</LINELENGTH>192.168.10.1 192.168.8.1 192.168.10.10
The IP addresses and devices listed may not apply to your environment and will most likely need to be changed. Using IP addresses and DNS names are both acceptable, providing the server you are launching the script from can resolve DNS names.
Also ensure that the device name can be resolved. In order for the script to work, the device must respond either as “Reply...” or “Request Timed Out.”
We name the script PingTest.vbs and configure the timeout to 2 minutes, as shown in Figure 14.11.
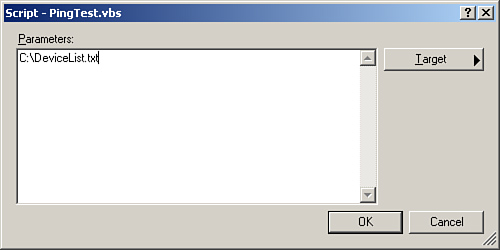
After naming the script and copying it into the rule, you need to configure the parameters to be loaded into the script. Click the Parameters... button to display the Parameters screen. For the PingTest script, this screen should be configured as shown in Figure 14.12. Our script only requires specifying one parameter: the location of the device list. We have set it to C:DeviceList.txt. Click OK and then Next to continue to the Event Mapper screen.
Finish the wizard by clicking Create to create the Execute a script rule.

Once the script runs on the appropriate server, the event logged by the script will look like the event displayed in Figure 14.13.
The next rule type in OpsMgr we will discuss is the timed command. Timed command rules are very simple and can launch a script or execute a command based on a schedule. This capability is similar to using the scheduled provider in previous versions of MOM.
Timed commands are particularly useful for launching ping scripts, for example, as you can use OpsMgr to control the schedule and manage the script. OpsMgr also supports using a timed command for launching Windows commands and scripts.
In this section, we show you how to launch a batch file using a timed script. The batch file we will launch is a very simple one that restarts the print spooler service. The file has the following two lines of code and should be saved as C:SpoolerRestart.bat:
@echo off
Net stop spooler & net start spooler
Tip: A Scripting Tip Using an Ampersand
You can use the ampersand (&), as in the preceding example, to allow two commands to exist on the same line.
The following process shows you how to create a timed command rule to launch a batch file:
Open the Operations console and navigate to the Authoring space.
Expand Monitoring Objects and right-click Rules. Select Create New Rule....
The Select a Rule Type screen is shown in Figure 14.14. From this screen, select Timed Commands -> Execute a Command. Once again, we will select our Sample Management Pack as a target for the rule. Click Next.
At the Rule Name and Description screen, we name the rule and configure a target for it. In our example, we will call the rule Print Spooler Service Restart and target the Management Server class, because we want the rule only to apply to management servers. Click Next to continue.
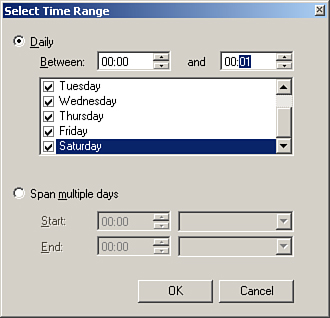
We will now create the schedule for running the batch file. We will configure our script to run daily at midnight. Click the Base on fixed weekly schedule radio button and select the Add button. Check the box for each day and specify the time range as being between 00:00 to 00:01, as shown in Figure 14.15. Click OK.
After creating the schedule, click Next to continue.
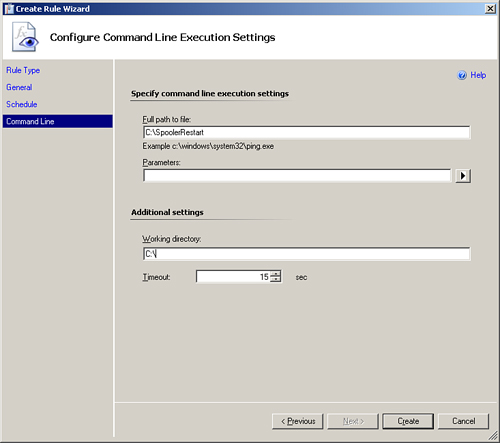
The final screen of this wizard is where you configure the actual batch file to run. We will configure the timed command to run the C:SpoolerRestart.bat file we created earlier in this section. We do not need to specify parameters in this example. The working directory can be set to C:. Click Create to create the timed command. Figure 14.16 displays this screen.
In addition to using rules, OpsMgr 2007 introduces monitors. Although monitors perform the same functions as rules in MOM 2000 and 2005, they are representative of a specific component on a managed machine. This capability makes them very powerful. Monitors also update in near real time, meaning they accurately represent the current state of the managed computer.
Although the monitoring capability of OpsMgr 2007 is similar to the State feature in MOM 2005, OpsMgr has a large number of monitors that can observe every aspect of a managed machine down to the component level, whereas previously there were a limited number of levels you could monitor. You can appreciate the sheer volume of monitors when looking at the Health Monitor for a managed computer, shown in Figure 14.17.

It is worth mentioning that while we use monitors for monitoring, monitors are not responsible for collecting performance data or launching scripts. Use rules for this purpose. We discussed the functionality and capabilities of rules previously in the “Rules” sections of this chapter.
There are many different types of monitors in OpsMgr. This chapter discusses the main types. Figure 14.18 shows some of the different monitor types.

We discuss the major types of monitors in the following sections.
One of the most basic types of monitor is the Windows Events monitor. This monitor detects Windows events and uses these events to update its status. These monitors can vary in complexity from simple, single-event detection to a complex correlation of events; even missing events can contribute to the status of a Windows Events monitor.
We will walk through the process to create a Windows Events monitor in the “Creating a Monitor” section later in this chapter.
The Windows Performance Counters monitor collects data from a Windows operating system or application performance counter and reacts to that data. There are two key types of Windows Performance Counters monitors, which we discuss in the following sections:
Static Thresholds
Self-Tuning Thresholds
The Static Thresholds monitor is the simplest monitor type. It is used to monitor for changes in a static threshold, such as exceeding a threshold of 90% CPU utilization. With that said, you can still create five distinct types of Static Threshold monitors for additional granularity in the monitoring process:
Average Threshold
Consecutive Values over Threshold
Delta Threshold
Simple Threshold
Double Threshold
The first four of these are of the Single Threshold type.
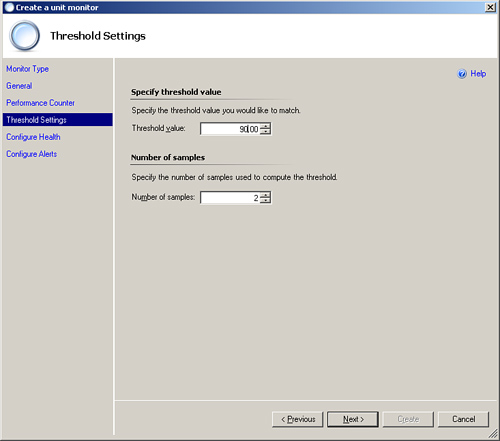
The Average Threshold monitor takes the average value of a performance counter over a certain number of samples. The state changes if the average is above the specified threshold.
This monitor is particularly useful when you need to receive an alert when a performance counter is running near to or over a threshold for a defined period, rather than every time the performance exceeds a threshold.
Figure 14.19 displays the average threshold configuration screen.
Use the Consecutive Values over Threshold monitor when you need to reflect the state of a computer that consistently and repeatedly exceeds a threshold (so monitoring the average threshold is not appropriate). This capability is useful for systems that may occasionally have spikes on performance counters that do not indicate a problem, although it is an issue if a spike does not return to normal.
We have configured this monitor using the settings shown in Figure 14.20. We check for a value greater than or equal to 20 (the threshold), but collect four samples for comparison before defining it as a concern.

A Delta Threshold monitor does not measure the actual value of a performance counter but rather the change in value. For example, if you were measuring a change of 50, a performance counter change from 75 to 20 would be of interest, whereas a change from 75 to 30 would not. You can also configure the monitor to measure for a percentage drop rather than a physical value change.
Figure 14.21 shows the configuration screen for this monitor.

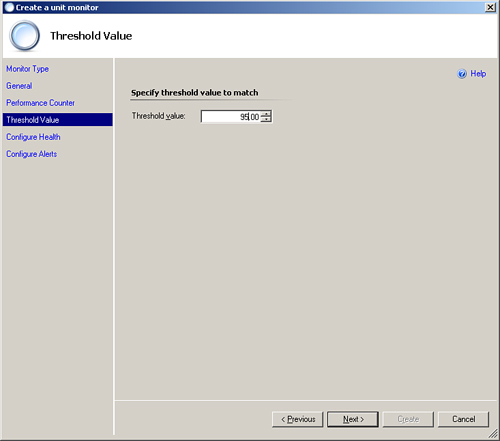
The Simple Threshold monitor does exactly what is says. It simply monitors a performance counter and changes the status of the monitor when the threshold is exceeded. This is the most basic and easiest to configure Performance Threshold monitor in OpsMgr 2007.
Figure 14.22 displays the Threshold Value screen for configuring the Simple Threshold monitor.
The MOM 2000 and MOM 2005 products were somewhat static, reacting to performance issues only if the particular counters deviated outside of a predefined value. Although this method of monitoring is effective, it has its drawbacks. The main issue is the fact that not all servers perform equally, even servers that fulfill the same role (Exchange servers being a good example).
When servers perform differently, a performance value appropriate for one server may not be applicable for another system, making it necessary to create separate performance thresholds for different servers. This can be very time consuming and difficult to manage in large and complex environments, especially when you consider previous versions of MOM did not have the luxury of sealed management packs! It was not uncommon for management packs to become very messy with changes often accidentally overwritten, especially when the vendor released a new version of its management pack.
With self-tuning thresholds, this is no longer the case. Self-tuning thresholds are a completely new feature in Operations Manager. Using self-tuning thresholds enables dynamic monitoring of performance counters, where OpsMgr adapts the thresholds as appropriate. As an example, if you monitor an Active Directory Domain Controller (DC) for CPU utilization using a self-tuning threshold, the threshold will “learn,” noticing repeating CPU fluctuations on the server, such as the extra demand placed when users log in at the same time on a Monday morning. The monitor will then ignore these CPU fluctuations, and the state of the monitor will only change if the fluctuations are sufficient to move outside of the baseline that the monitor has learned.
A self-tuning threshold is also particularly useful to simply collect a baseline of a particular performance counter. When you view the associated performance graph, you can overlay the baseline, which gives you an overview of the trend of the counter in addition to the exact values.
OpsMgr 2007 uses baselines to continually monitor and collect the usual running values for a performance counter. This allows it to automatically set and adjust alert thresholds to limit the amount of extraneous alerts that appear.
In addition, baselines are available in performance graphs to show the trend of a particular performance counter. To access a baseline from a performance view graph (where available), simply generate the graph, right-click, and select Show Baseline.
The process for configuring a self-tuning threshold is similar to that of configuring a normal threshold. The only real difference is in configuring the logic for the self-tuning threshold to “learn.” You define this using the wizard when you initially create the threshold monitor, or by creating an override or editing the InnerSensitivity and OuterSensitivity values directly in the monitor.
Changing sensitivity using the wizard is straightforward. Perform the following steps:
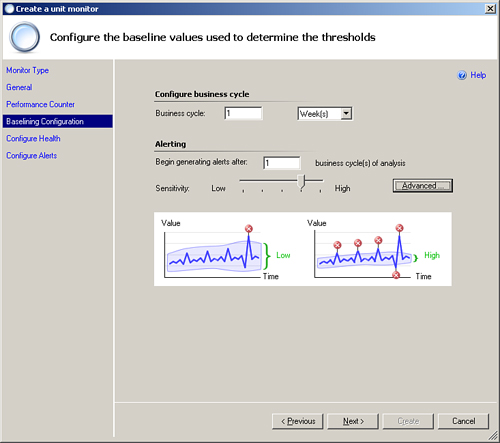
After you select the performance counter you will use, the Baselining Configuration screen appears, shown in Figure 14.23.
From this screen, you can configure your business cycle, meaning what you consider a unit of time to monitor. A business cycle is defined in terms of days or weeks; the default is 1 week.
The screen also allows you to configure how many business cycles should pass before generating alerts. This is useful because the monitor is able to learn efficiently before it starts generating alerts for exceeded thresholds.
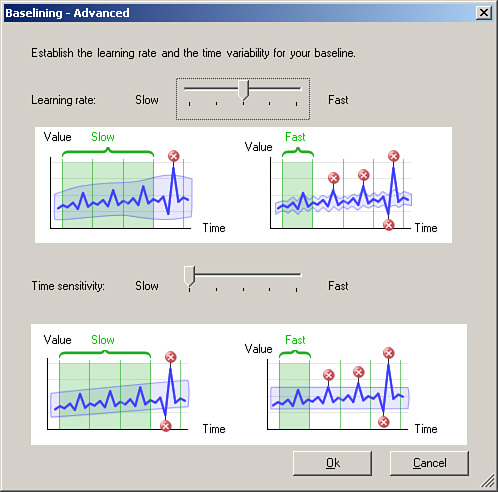
You can also specify how sensitive (or insensitive) the threshold monitor will be. Moving the sensitivity slider automatically adjusts the sensitivity, or you can configure it in more detail by clicking the Advanced button. Selecting Advanced displays the screen shown in Figure 14.24.
From the Baselining Advanced screen, you can configure the two settings for the sensitivity manually: the learning rate and time sensitivity settings. The learning rate is the rate at which the baseline is adjusted based on frequency of occurrences, and time sensitivity is the rate at which the baseline is adjusted based on a time interval.
There are a number of different self-tuning thresholds:
2-state Above
The 2-state Above baseline is used to generate a status change and an alert when the performance counter strays above the learned baseline. When it is below the baseline, the status of the monitor is normal.
2-state Baselining
This monitor is very much the same as the 2-state Above threshold monitor except that the baseline information is recorded for use in performance graphs.
The 2-state Below baseline is the opposite of the 2-state Above baseline. If the counter strays below the learned baseline, the status is updated and an alert generated.
3-state Baselining
The 3-state Baselining monitor collects the baselining information. It also allows the monitor to update the health state when the performance deviates both above and below the learned baseline.
Despite the benefits of self-tuning thresholds, there are still drawbacks to using this new technology. Currently, self-tuning thresholds are unable to take into account periods of prolonged inactivity, such as weekends and holidays. As an example, OpsMgr may calculate a baseline for a server during the month of November. The baseline is automatically calculated over the period of a month, and is thus assumed relatively accurate.
However, during December many businesses close or run reduced operations over the Christmas period, which negatively affects the baseline. The monitored servers are less heavily utilized during the holiday period, and the baseline adjusts to reflect this. When everyone returns to work the server has a more typical load, and its new baseline is no longer accurate. When the server now becomes busy, it will have unnecessary alerts generated for performance counters outside the baseline, because OpsMgr still thinks the server should not have that much activity.
Currently, the only way to work around this issue is by temporarily disabling the baseline rule using an override for the periods of extended inactivity, or putting the machine or class object the performance counter applies to in maintenance mode. However, we do not recommend the latter method because it results in the computer or class object no longer being monitored.
A Windows service monitor does what the name suggests. It monitors a Windows service and updates the status of the monitor based on whether the service is running or not. You can also monitor a Windows service with a management pack template (explained in Chapter 18, “Using Synthetic Transactions”) that creates a Windows service monitor.
Using the management pack template creates a class for the monitored service. This is useful when you want to monitor the service as an individual item and potentially add it to a distributed application (DA). We cover distributed applications in more detail in Chapter 19, “Managing a Distributed Environment.”
We will step through the process of creating a Windows service monitor that monitors the Print Spooler service. Perform the following steps:
Open the Operations console and navigate to the Authoring space.
Expand Monitoring Objects and right-click Monitors. Select Create a Monitor -> Unit Monitor....
The Create a Unit Monitor Wizard displays the screen shown in Figure 14.25. From this screen, select Windows Services -> Basic Service Monitor. Also, select the Sample Management Pack as a target for the monitor. Click Next to continue.
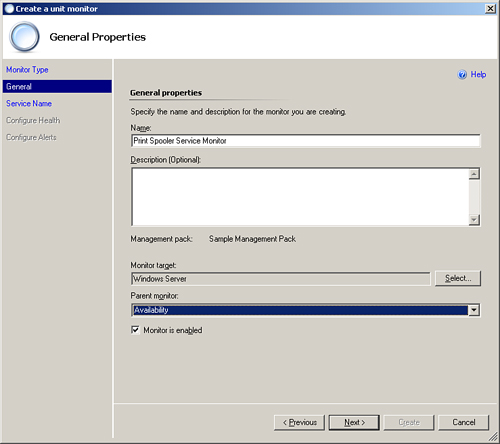
On the next screen, we name the rule and configure a target for it. For our example, we will call the rule Print Spooler Service Monitor and we will target the Windows Server class, because we want the rule to apply to all Windows Servers. Notice here, unlike when we named rules, we are asked to specify the parent monitor. In this case, we will leave the setting at the default of Availability. Figure 14.26 shows the completed General Properties screen. Click Next to continue.
Now, we will configure the service we want to monitor. In this case, it is the Print Spooler (Spooler) service. You can either click the ... button to browse for the service or type Spooler into the service name box. Click Next.
The next screen is the Configure Health screen. This is where you define what the health of the monitor will be in relation to the state of the service. Because this is a basic service monitor, it is already correctly defined (see Figure 14.27).
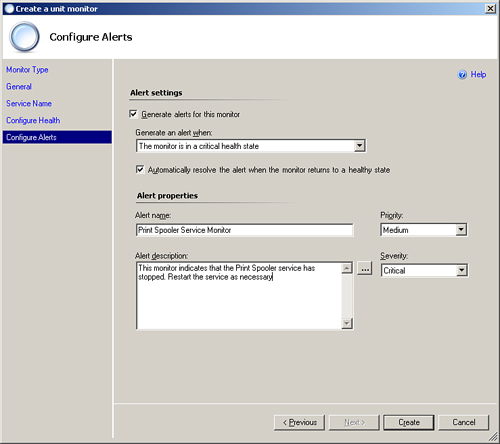
The final screen of the wizard configures the actual alert OpsMgr will generate. We will tick the Generate alerts for this monitor check box, leave the alert name as it is, and add an alert description, as shown in Figure 14.28. We will also leave the check box enabled for Automatically resolve alert when.... This means that once the monitor returns to a Healthy state, any generated alerts are automatically resolved. Click Create to create the new service monitor.


If the data you want to gather is located in a log file rather than an Event log, you can configure OpsMgr to monitor for a particular line or string appearing in a log file of your designation. As with other monitor types, multiple options are available, but the different monitor types will basically allow you to watch for a single event or text string, or watch for repeated events or text strings. Figure 14.29 shows the complete list of choices.

Here are some points to keep in mind:
Watching for a single event is simple. OpsMgr looks for an event that appears in an Event log or a text string that appears in a log file.
Looking for a repeated event is the same as looking for a single event, although the health state is not updated and no alerts are generated until an event has appeared a certain number of times within a certain time period.
If you need to monitor a SNMP-enabled device, you can create a monitor. A couple of approaches are available:
The monitor can react to a SNMP trap received by the server.
You can configure a SNMP probe that will actively run a SNMP query based on a schedule you specify; the monitor will update depending on the results of the query.
To configure SNMP monitoring, you must first add the network devices into OpsMgr; then you can create SNMP trap-based or performance-based rules, depending on your requirements. When creating these rules, you use the OIDs (Object Identifiers) of the SNMP objects. OIDs are unique labels for SNMP counters and traps.
To collect SNMP traps on the management server, you must first install the Windows SNMP trap provider (Control Panel -> Add/Remove Programs).
SNMP monitoring is particularly useful for those devices or servers you wish to monitor that run non-Windows operating systems, or for monitoring hardware appliances such as firewall nodes. Chapter 17, “Monitoring Network Devices,” discusses SNMP monitoring in detail.
WMI event and performance monitors behave in a similar way to the normal event and performance monitors. The data, however, is not obtained using the operating system and application APIs (application programming interfaces) but is instead collected using WMI. Due to the nature of these performance counters, self-tuning thresholds are not available when you use WMI performance monitors.
These particular monitor types are typically configured for machines monitored using the Agentless monitoring mode.
In this section, we will create a basic Windows event monitor. Perform the following steps:
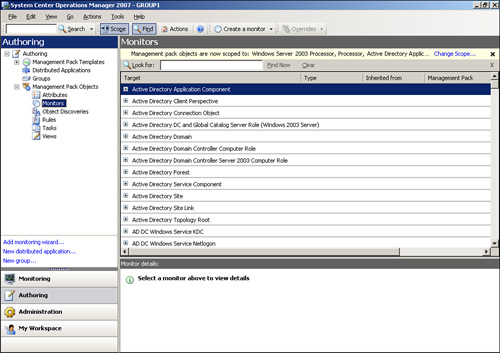
Open the Operations console and navigate to the Authoring space. Highlight the Monitors object, as displayed in Figure 14.30.
You can now begin to create a new monitor. Right-click Monitors in the right pane and then select Create a monitor. This displays three options (see Figure 14.31). You have the choice of the following monitors:
Unit Monitor—. The Unit monitor is the lowest level of monitor and charged with actually carrying out the monitoring of a particular component or aspect of a monitored machine. This is the most commonly used monitor.
You can roll up Unit monitors to either Dependency or Aggregate Rollup monitors.
Dependency Rollup Monitor—. The Dependency Rollup monitor is configured to roll up the health state of a particular monitor or component to the next level in the monitored computer’s health state. For example, if a SQL Server database resides on a physical disk and the disk fails, a Dependency Rollup monitor is created to ensure that the state of the physical disk affects the state of the database that relies on it.
Aggregate Rollup Monitor—. An Aggregate Rollup monitor is designed to reflect the state of a collection of Unit monitors, Dependency Rollup monitors, or other Aggregate Rollup monitors. For example, the state of multiple SQL Servers can be grouped and rolled up to a SQL Servers group.
Generally, you will be creating simple monitors, so this example will create a Windows Event monitor, which is a Unit monitor.
From the list in Figure 14.31, select Unit Monitor. The Create a unit monitor Wizard opens with the Select a Monitor Type screen displayed, similar to the screen shown in Figure 14.25.
We will create a monitor that updates its state based on Windows events. The monitor will fail based on a Windows event and return to a normal state based on a different Windows event. From the Select a Monitor Type screen, select Windows Events -> Simple Event Detection -> Windows Event Reset.
You will also need to specify the management pack you want to add the monitor to (we will use the Sample Management Pack we previously created). Click Next.
Enter a name, description, monitor target, and parent monitor for the new monitor. Type a name for the monitor and a description if desired. We will call our monitor Server Time out of Sync.
Set the target for the monitor to Windows Server by browsing to the object and selecting it. For this example, we will set the parent monitor (the monitor under which this one will reside) to Configuration. Click Next.
The next few screens of the wizard, we configure Windows events that alter the state of the monitor, both healthy and unhealthy.
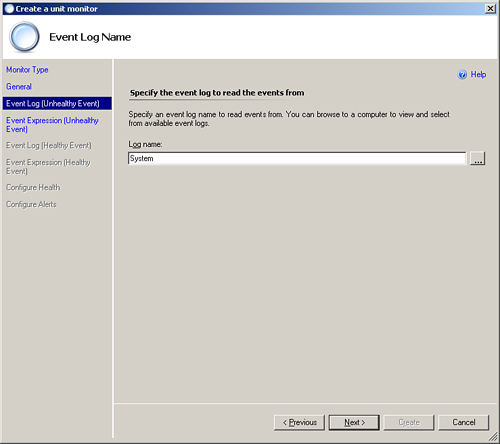
On the first of these screens, shown in Figure 14.32, we select the source of the Windows events for the event that will cause the monitor to register an unhealthy state. For this instance, set the log to System either by typing the name or clicking ... to select the log. The System log is where the events will appear. Click Next.
At the next screen, we specify the formula by which OpsMgr will match the unhealthy state event. Figure 14.33 displays this screen.
The Build Event Expression screen is where we specify the parameters of the event that enables OpsMgr to accurately detect and update the state to unhealthy when the event appears in the System Event log. By default, the wizard adds the Event ID and Event Source parameters. You can remove these parameters as required, and you can add different or additional parameters such as Event Description and Logging Computer Used. To add a new parameter, simply click the Insert button and then use the ... button on the newly created row to specify the parameter you want to add.
For this example, we will look for an event with an Event ID of 50 and a source of W32Time. This event indicates that time synchronization is not working.
Once you have specified the event information for the unhealthy event, repeat the processes illustrated in Figures 14.32 and 14.33. This will define the event that causes the monitor to return to a healthy state. For this monitor, we will use an event from the System log with an Event ID of 37 and a source of W32Time. Event 37 indicates that time synchronization is now working correctly.
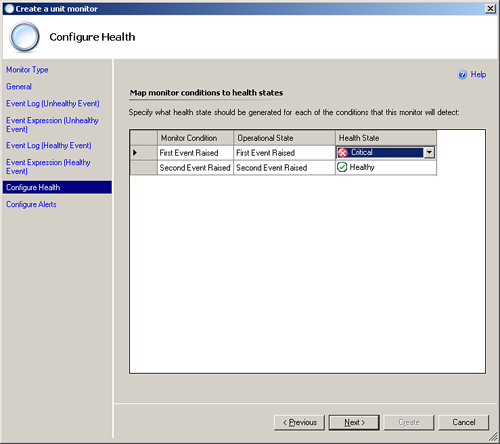
After you complete these steps and click Next, the Configure Health screen displays, shown in Figure 14.34.
Here we can specify the severity of the different states of the monitor. For our example, we will change the First Event Raised option (unhealthy event) to Critical and leave the Second Event Raised option (healthy event) as Healthy. Click Next.
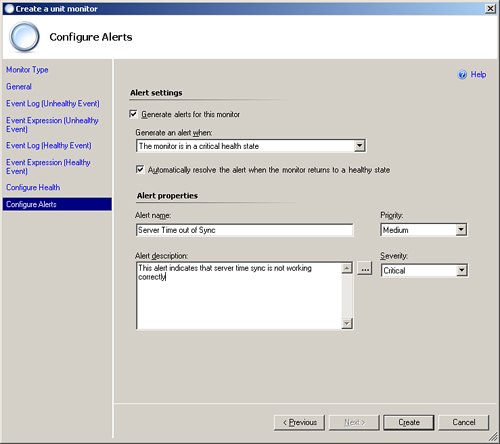
In the final screen of the Configure a unit monitor Wizard, you can specify if the monitor will generate an alert (explained in more detail in the “Alerts” section, later in this chapter). Figure 14.35 displays the Configure Alerts screen.
For this monitor, we will choose to create an alert. Once you check the Generate alerts for this monitor check box, a number of options appear below. Although we will leave most of these at the default setting for our example, we will explain each option:
You can configure at what level the monitor must be at before an alert is generated (Warning or Critical). In this case, we will keep the default setting of Critical. You can use the check box below this option to specify whether OpsMgr will automatically close the alert when the monitor returns to a healthy state. You will want to do this in most cases—by enabling monitors to resolve their own alerts, you minimize the number of excess alerts residing in the console at any one time.
In the bottom section of the screen, you can configure the details of the alert, which defines what appears when OpsMgr generates the alert. This information includes the name of the alert, any descriptive information, and the priority and the severity of the alert. The alert description field has similar functionality to the event expression builder we used earlier in step 7.
After you are satisfied with the alert details and the rest of the settings in the wizard, click Create. Creating the monitor will take several seconds; once it is complete, the monitor is visible and accessible in the console.


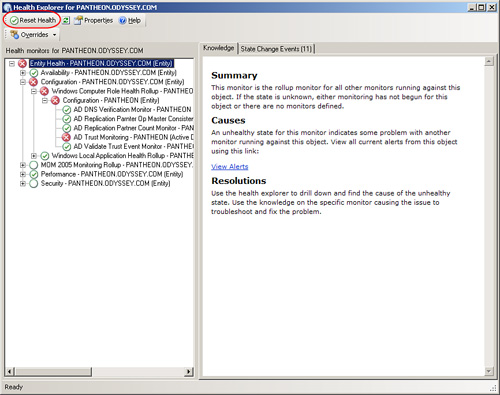
You may have noticed that the Health Explorer includes the option Reset Health. Figure 14.36 displays the Reset Health button.
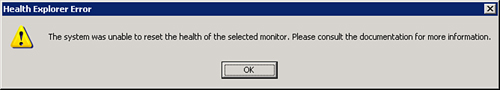
This feature’s functionality is limited in the pre-Service Pack 1 (SP 1) version of OpsMgr. Although some of the monitors can manually reset, many monitors will not. In this case, when you click the button, you may not receive an error, but the monitor does not reset. Alternatively, you may receive the message in Figure 14.37 stating that the monitor cannot be reset.
The ability to reset the health state is a good idea in principle, because sometimes monitors do not reset on their own. In extreme cases, it may be necessary to restart or even reinstall the agent to reset the monitor.
This issue occurs in the base version of OpsMgr 2007 because the button tries to spawn “on-demand detection.” If the monitor you selected does not have on-demand detection defined on its monitor type, or if the monitor is a Dependency Rollup monitor, selecting Reset Health has no effect.
This means it is up to the monitor type to be able to do something with the Reset option. Most monitor types you build do not implement the required option for Reset Health to have any effect. The result—reset doesn’t really mean reset at all, or at least for the vast majority of monitors!
With SP 1, Microsoft has announced that the reset monitor feature will be fully functional, and it will be possible to reset any monitor to a healthy state regardless of the actual status of the issue. SP 1 will also include a Recalculate button that allows you to initiate a recalculation of the state of any monitor in real time, rather than having to wait for the configured schedule. This is particularly useful with certain monitors such as the monitor that checks the age of the Exchange log files, which checks once every 24 hours. Now you will be able to check on demand as required!
Now that we have covered rules and discussed monitors, we will look at alerts in OpsMgr.
As we mention in the “Rules” and “Monitors” sections of this chapter, both rules and monitors generate alerts. Alerts represent an overview of all active issues in the system. Alerts contain more information than monitors contain, and therefore are very useful for troubleshooting. In addition, alerts are not necessarily resolved when a monitor’s status returns to normal. You can configure alerts to remain active, thus assisting in visibility and hopefully resolving the issue in question. You will find alerts in the Active Alerts view in the Monitoring space of the Operations console.
Alerts contain a number of pieces of information in the Alert Details pane in the Monitoring space of the console, an example of which is displayed in Figure 14.38.
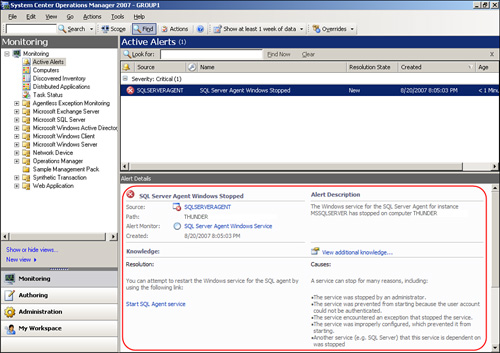
This pane of the console contains specific information about the alert, such as the computer that raised it, the source of the alert (the application or operating system component generating the alert), and any additional knowledge included by the vendor or that you created yourself.
A neat feature of OpsMgr 2007 is that you can embed tasks within the Alert Details section. This allows the user who discovers the alert to carry out troubleshooting steps, such as restarting a service directly from the Alert Details section in the Operations console, which reduces administrative overhead. Figure 14.38 is an example of this capability, including an embedded task to start the SQL Agent service because the service has stopped.
As just mentioned, rules and monitors generate alerts. Unlike with MOM 2000 and MOM 2005, monitors can now automatically resolve alerts when the state of the object returns to normal (although rules cannot). This helps minimize the number of inactive alerts resident in the console at any one time.
In MOM 200 and MOM 2005, alerts triggered email alerting and various other forms of alerting, such as instant messaging. This is no longer the case. A new feature of OpsMgr 2007 is the notification workflow, which is the engine that underpins all aspects of alert generation. Notification workflow manages the generation and resolution of alerts, and it includes the following capabilities:
Creating and forwarding email messages and other external notifications such as instant messaging/SIP with Live Communications Server 2005 and Short Message Service (text messaging).
Alert aging (previously referred to as escalation in MOM 2005).
The ability to customize the messaging format at the user level.
User-level formatting requires at least one notification channel to be previously configured by an OpsMgr administrator, and it allows individual users to configure their own recipient object and notification subscriptions.
Multiple Simple Mail Transport Protocol (SMTP) server support for redundancy.
It’s not particularly useful to try to send emails via Exchange saying that Exchange is down!
Configuring notification requires the following steps:
Establish a notification channel.
This can be via SMTP, instant messaging, or Short Message Service.
Create notification recipient(s).
Defining notification recipients includes specifying the scheduled hours during which they will receive notifications, with the address information for each channel on which the notification is available.
Recipients are defined in the Operations Console under Administration -> Notifications -> Recipients.
Create notification subscription(s).
Each subscription defines those management groups and objects for which alert notifications are sent, the alert criteria (severity, priority, category), email format, and resolution state criteria for filtering out unnecessary alerts. You can even specify alert aging as notification criteria.
You will establish subscriptions in the Operations console under Administration -> Notifications -> Subscriptions.
Create a Notification Action account (previously defined in Chapter 11, “Securing Operations Manager 2007”).
The email address associated with the Notification Action account is used as the email and instant message “From” address. Be sure to give this account the appropriate rights for the notification channel it will be using.
These steps are well documented in the white paper “Notification Setup Guide for Operations Manager 2007,” developed by Anders Bengtsson and Pete Zerger. You can download this white paper from either http://systemcenterforum.org/wp-content/uploads/SCOM_Notification1.pdf or http://contoso.se/blog/?p=132. For your convenience, we include these sites as live URLs in Appendix E on the CD.
We have developed a small management pack that creates a task you can use to forward alerts. The Forward Alerts via Email MP provides a right-click capability for forwarding the alert name and description to someone via email. You are prompted for the email address. We include this utility on the CD accompanying this book as part of the OpsMgr Unleashed management pack with Chapter 23.
To configure the management pack, import it and then copy the email_alert.vbs script to the C:scripts directory on the system you want this task to work on. You have to edit two values in the script:
Change the value for OPSMGREMAIL to the name of the email address you are sending from (for example,
[email protected])Change the value associated with SMTPFQDN to the fully qualified name of your SMTP server (for example, SMTP.ODYSSEY.COM).
This is a very useful tool for forwarding alerts to individuals who don’t have subscriptions but need to be aware of a specific alert.
Tip: Validating Email Format
There will be times when it is necessary to test whether SMTP mail is working and to validate the way the message looks before configuring OpsMgr to send emails to a mail server. A useful tool that enables testing emails from the command line is available at https://blogs.pointbridge.com/Blogs/morse_matt/Lists/Posts/Post.aspx?ID=24.
Once notification is configured, administrators no longer have to create alert rules to generate email alerts; they simply need to subscribe to the alert using the notification workflow engine. We cover notification workflow and the creation of alert subscriptions in the following section.
You configure alerting using the Notification Workflow capability of Operations Manager. In addition to managing the generation of alerts, you can configure subscriptions to alerts to ensure that only the appropriate alerts are forwarded via email, and only to the correct recipients. This also allows sending alerts and monitoring data to different recipients during off-hours. The Notification Workflow in OpsMgr is also used to configure which alerts are passed to connectors for forwarding to third-party systems. More information on integrating OpsMgr with other systems is in Chapter 22, “Interoperability.”
Figure 14.39 shows the structure of the notification workflow.

At a high level, the steps OpsMgr takes to create the workflow are as follows:
Create the recipient and subscription.
This is where we configure the recipient to send the alerts to. This can be an email recipient, IM recipient, SMS message recipient, or based on a command (which is useful for sending notifications to a third-party message system, for example).
Create a notification rule for generating notifications.
Here we create the actual notification rule to define which alerts to send and to which recipients.
Generate an alert.
The alert is generated by OpsMgr.
The AlertSubscription Data Source module periodically polls subscriptions.
Periodically, the OpsMgr notification workflow polls the subscriptions and enumerates the configuration to define whether the alert(s) that generated since the last poll need to be forwarded to a recipient.
The Resolver module processes (filters) alerts that match.
Matching alerts are passed to the next stage of the notification workflow.
The Resolver module enumerates the recipient list, addresses, and schedule for each notification.
At this point, the alert has been matched but OpsMgr carries out one final check, to ensure the subscription is configured to receive alerts during the specified time. In other words, if an alert is matched at 5 a.m. and the subscription is not configured to receive alerts between 1 a.m. and 6 a.m., the alert is not forwarded.
Notification subject and body is generated for each device per recipient.
The notification message is created and generated, based on the default notification format and any additional changes to the default format configured in the rule or monitor that generated the alert.
Delivery Action executes the delivery, with notification content included.
The message is delivered. At this point, OpsMgr passes responsibility of the message to the notification delivery software (Microsoft Exchange, for example). OpsMgr does not monitor to verify that the message arrives. If the message does not arrive, you will need to attempt to locate it in the notification delivery device.
As OpsMgr monitors its own notification workflow, if no alerts are generated in the Operations console suggesting there is a problem with the workflow, we can safely assume that the message has left the OpsMgr notification workflow and has been passed to the configured notification device.
In the next sections, we describe the process to create a recipient and notification subscription, using email to forward the messages.
Before you can configure alerts and monitors to send data via email, you must configure a recipient address for the emails to be sent to. Follow these steps:
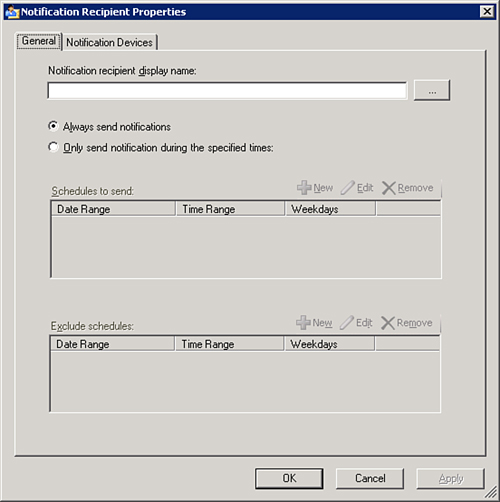
Open the Administration space and locate the Notifications -> Recipients tree. Right-click and select New Notification Recipient. This displays the Notification Recipient Properties screen, shown in Figure 14.40.
Begin with giving the new recipient a name. The easiest way to do this is to search Active Directory (AD). (If the user does not exist in AD, you will have to enter the details manually.) Click the ... button to browse the directory. Type the user’s name and click the Check Names button to validate your entry. Click OK.
The user’s account name now displays in the top box. On this first screen, you can also choose to configure a schedule to send the emails. We will assume notifications will always be sent, so accept the defaults.
We must now choose which type of notifications to send to this address (in our case, email). Click the Notification Devices tab at the top of the window. Then click Add to start the Create Notification Device Wizard.
On the screen shown in Figure 14.41, select E-mail from the dropdown list. If the user is an AD user with a mailbox, his or her email address automatically appears in the delivery address box. If the user is not in AD, you can manually add the address.
Click Next and accept the default on the schedule screen because we want emails to always be sent. Click Next.
You are prompted to give the notification channel a name. Something along the lines of E-mail alerting for xxxx (where xxxx is the user’s name) is appropriate.
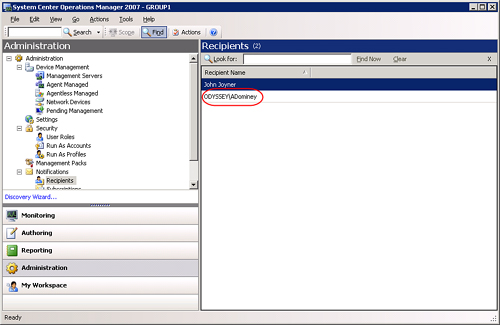
Click Finish, then click OK again to finish. The new recipient (ODYSSEYADominey) is displayed in Figure 14.42.

After creating a recipient, you must create a subscription for the recipient to get email alerts. Perform the following steps:
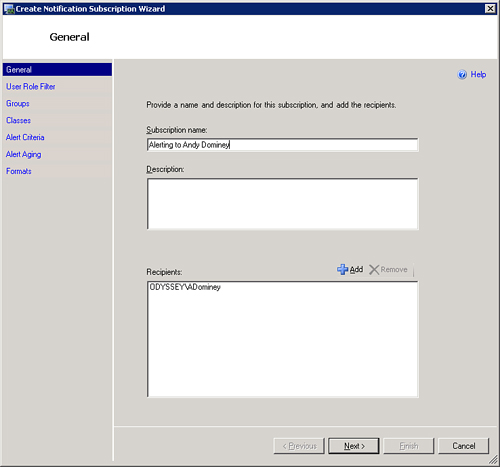
In the Administration space, locate the Notifications -> Subscriptions tree. Right-click and select New Notification Subscription to display the General properties screen. The General screen is where you give a name to the subscription and add the appropriate recipients. Click Next. We will name the subscription Alerting to Andy Dominey. Click the Add icon and then select the ODYSSEYADominey recipient. Figure 14.43 shows the completed screen.
The next screen is the User Role Filter screen. This screen is very useful if you have configured customized user roles (which we discuss in Chapter 11) because you can create a subscription based on the objects the user role has permissions to simply by checking the tick box and selecting the appropriate user role. Because we will be creating a subscription from scratch, we will not use this functionality for this example. Click Next.
The Groups screen is next. It allows configuring the groups this subscription will apply to. In this example, we are only interested in Windows Server alerts, so we will select the following groups:
Windows Server 2000 Computer Group
Windows Server 2003 Computer Group
Windows Server Computer Group
Windows Server Instances Group
Figure 14.44 displays the completed screen. Click Next to continue.
The next screen is the Classes screen. This is where you can choose to limit your subscription to individual classes or simply to accept all classes. It is worth noting that if you choose to select individual classes and any new classes are added later, you will have to add them manually. We will choose the classes displayed in Figure 14.45. Click Next.
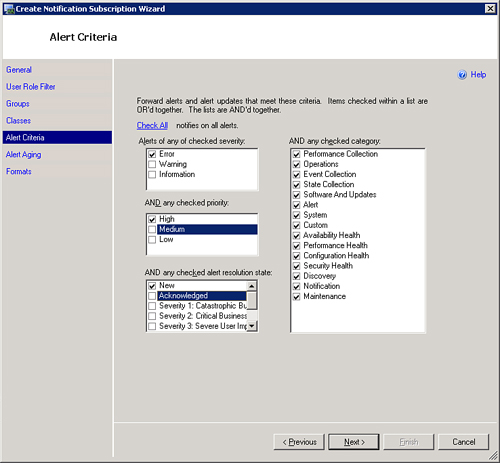
The Alert Criteria screen is a very important one. Here you choose the severity, type, priority, and resolution state of the alerts you want to email. We will configure our subscription as shown in Figure 14.46. Here we are choosing to receive only alerts of severity Error that are of high priority. We are only interested in new alerts but want to be notified for all alert categories. Click Next.
The Alert Aging screen allows you to configure additional emails for alerts that have not been updated for a specified period of time. In other words, if an alert has not been updated for a long period of time, this screen can be used to configure a “reminder” email that the alert is still unresolved. We will leave this option off for this example. Click Next to move on to the final screen of this wizard.
The Formats screen allows us to customize the format in which the email will be sent. We will leave this at the default (global) setting for this example. Click Finish to create the subscription.


Tip: Screen Capture Alert Text
Have you ever wanted to capture—as text—the screen content of an alert in the Operations console (or anything/anywhere else)? A small utility named Kleptomania uses Optical Character Recognition (OCR) technology to let capture text from anywhere on the screen, including database lists, forms and reports, error messages, dialog boxes, status lines, folder trees, and file lists.
You can get a free 40-day trial of Kleptomania, or you can get a private single user license for $29.95. See http://www.structurise.com/kleptomania/ for future information. In addition, copying data from the console to the Clipboard is scheduled to be included in OpsMgr 2007 Service Pack 1.
Now that we have looked at the different types of rules and monitors in OpsMgr, we will highlight the methods to add knowledge and troubleshooting data to alerts.
Despite the fact that monitors are now the preferred method for monitoring servers and applications because they are “real time,” alerts are still the primary source of information in OpsMgr. This is the reason a large number of monitors are configured to generate alerts.
A typical alert contains a large amount of knowledge and information about the problem that occurred and about how to troubleshoot the problem, and it often includes steps to assist in resolving the problem.
When you select an alert in the Monitoring pane of the Operations console, the bottom (Alert Details) pane displays additional information about an alert. We show an example in Figure 14.47.

As shown in Figure 14.47, some alerts contain quite a bit of information. However, the information supplied by the management pack vendor may not necessarily be applicable for every environment, or there may be other specific information you want to include such as additional troubleshooting steps or the telephone numbers and names of the engineers who manage the system in question.
This is where the Company Knowledge section of the alert comes in. By incorporating company knowledge, you can add information into an alert so that every time that alert appears in the console, it appears with your customized information in addition to vendor-supplied product knowledge.
The following list documents the steps for adding company knowledge to an alert.
Note: Tools for Creating Company Knowledge
To add company knowledge to an alert or management pack, you must install Microsoft Office Word (version 2003 recommended) and the Visual Studio 2005 Tools for Office Second Edition Runtime. You can download the runtime tools from http://www.microsoft.com/downloads/details.aspx?FamilyID=F5539A90-DC41-4792-8EF8-F4DE62FF1E81&displaylang=en (we include this link in Appendix E as a live link on the CD for your convenience).
Open the Monitoring space in the Operations console. Select an alert. This example uses the Health Service Configuration Not Up To Date alert, but the specific alert really isn’t important for this process.
You will notice that as you select the alert, the Alert Details pane fills with information. This includes a hyperlink to view additional knowledge, which we circled in Figure 14.48.
Selecting the hyperlink opens the Alert Properties dialog box with the Product Knowledge tab active. Select the Company Knowledge tab, as we have in Figure 14.49.
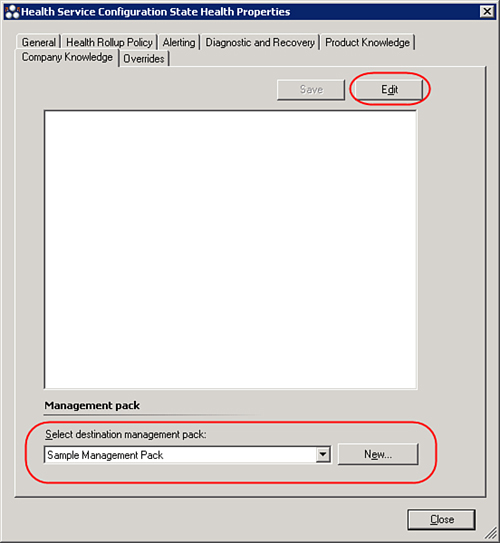
To add company knowledge, you need to click the Edit Monitor button. This displays the Properties window for the monitor. Select the Company Knowledge tab here, and you will see an Edit button, which we circled in Figure 14.50.
Also highlighted in Figure 14.50 is the Select destination management pack dropdown. Because we cannot edit sealed management packs, we need to select a management pack in which to store our customizations. Select the Sample Management Pack we created earlier and then click Edit.
If you have not installed Microsoft Word and the Visual Studio Tools for Office Runtime, you will receive an error stating that the tools are not installed. It is necessary to install this software before editing company knowledge.
After Microsoft Word loads, you are presented with the screen shown in Figure 14.51.
Now edit the company knowledge and click the Save icon in Microsoft Word. After saving the knowledge, you can close Word. The knowledge is added to the monitor. Click OK to save your changes.


Now that we have explained rules, monitors, and alerts, we will take you through the process of locating those rules, monitors, and other objects in the Operations console.
Unlike MOM 2000 and MOM 2005 objects, OpsMgr 2007 objects are indexed within the product itself. This indexing allows searching to be far more accurate and speeds up the process for finding objects in OpsMgr.
With OpsMgr 2007, you can search in your current view using the search bar shown at the top in Figure 14.52.

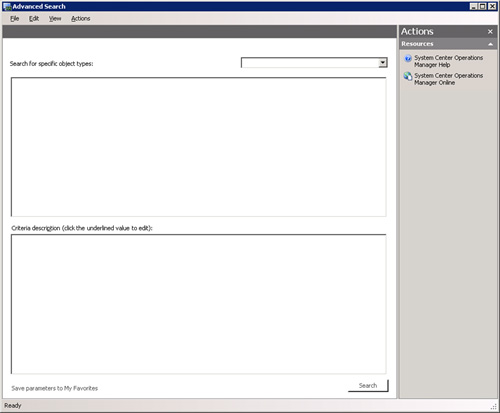
You can also use the advanced search capability located in the Tools menu (Tools -> Advanced Search). This menu simply allows you to target your search at a particular type of object in OpsMgr, rather than searching just the view you are currently looking at in the Operations console. Figure 14.53 displays the Advanced Search window.
Due to the large number of classes and objects in OpsMgr, we do not recommend displaying objects for all classes in the Authoring section of the console at one time. Therefore, you can scope the console to a particular class or set of classes to minimize the number of items you are displaying, making searching for items easier and faster.
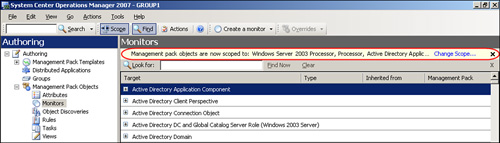
When you are navigating the Authoring space of the console, you will notice at the top of the pane on the right, just underneath the section title bar, a narrow yellow strip with a Change Scope... option on the far-right side. This is the scoping bar, which we circled in Figure 14.54. We can use the scoping bar to rescope the console to a specific class or group of classes.
After you click Change Scope..., the Scope Management Pack Objects by target(s) screen appears (see Figure 14.55). From here, you can choose to view either common targets or all targets using the radio button near the top of the window.
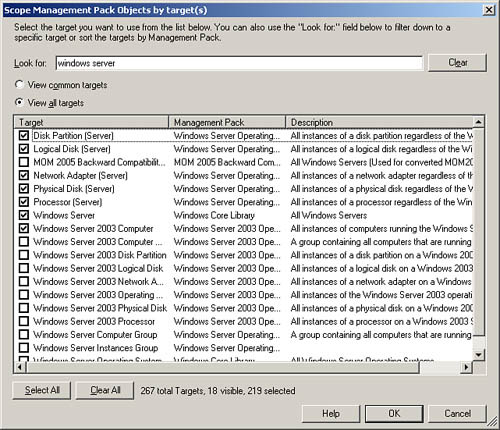
To select the objects you wish to scope or filter by, you can scroll through the list of targets and select the appropriate objects, or you can narrow the search further by typing text in the Look For box. Once the list displays the objects you wish to select, tick the check boxes next to them and click OK. The console’s right pane will then reload to display your selection, and the list of objects on the yellow scoping bar will include those items.
The scoping feature is particularly useful, not just for locating rules and monitors, but also when finding alerts and objects in the Monitoring space of the Operations console. The ability to select scope is invaluable in environments with a large number of objects and/or alerts present at any one time.
In MOM 2005, overrides allowed you to enable and disable rules and alter (override) threshold values for particular monitored computers or groups of computers. You could also use overrides to target script parameters. The technique of using overrides significantly reduces the need for changing rules and therefore editing the rule base. Although in MOM 2005 using overrides was a recommended technique, that practice was limited—there were other ways to modify management packs. However, the mechanism is predominant in OpsMgr 2007 and therefore deserves special attention in this chapter. You cannot edit management packs directly in OpsMgr 2007, and all changes to management pack objects will incorporate overrides.
Overrides are the capability that enables you to modify settings in a rule or monitor for a particular object such as a managed computer, without actually editing the rule. As an example, you could use an override to disable a rule for a specific monitored computer without affecting the rule for all other monitored systems. Alternatively, you could specify a higher CPU threshold value for a heavily utilized server to prevent false alerts, without affecting the value used with other monitored computers.
MOM 2005 overrides were attached to the GUID of a rule; although the rule itself was not changed, the override represented an overall change to the rule base. Because management packs are now sealed (explained in Chapter 13), this method is no longer available. With OpsMgr 2007, Microsoft has developed another technique to utilize overrides, without having to alter the rule base.
In this version of Operations Manager, rule settings such as the Enabled flag (which defines whether a rule or monitor is enabled) are presented as values that can be overridden. Overrides themselves, once created, are stored in either a custom management pack of your choice or the Default MP. The overrides are grouped together, forming a set of policies to be applied to managed computers. When rules pass to OpsMgr-monitored computers, those policies are applied before the rules arrive. Because the clients have the overrides applied, the copy of rules on the client will differ from the rules on the management server(s). Figure 14.56 illustrates this process.

This section looks at the process for creating an override against a monitor. Here are the steps to follow:
As in the previous examples in the “Monitors” section of this chapter, navigate to the Authoring space in the Operations console and select Monitors.
Using one of the search methods discussed in the “Search Options” section of this chapter, locate the monitor you wish to override. For our example, we will override the Available Megabytes of Memory monitor located under the Windows Server 2003 Operating System class. Using the scoping bar, scope the console to this class. You will find this monitor under the Performance aggregate monitor, as shown in Figure 14.57.
After locating the monitor, right-click it and select Overrides. Next, choose Override the Monitor (there is also the option Disable the Monitor, which is a simple way to disable the monitor for an object, class, or group without going through the steps listed in this section). Choosing Override the Monitor opens a submenu with the following options:
For all objects of type: <Class the monitor is attached to>
The For all objects of type: option creates the override and targets it at all objects encompassed by the class to which the monitor is attached. For example, in our case the override is targeted to all objects that are members of the Windows Server 2003 Operating System class.
An example of this configuration would be if you needed to update a threshold value for all occurrences of a performance counter. To change the threshold value for the Total CPU Percentage Utilization monitor for all Windows Server 2003 computers, you would create an override on that monitor using the For all objects of type: option.
For a group...
The For a group... option allows you to select a group instead of a class or object.
This is useful when you need to apply the override to a group rather than a class, such as a specific collection of computers. You can create a group, populate it with those computers, and then apply the override to that new group.
For a specific object of type: <Class the monitor is attached to>
The For a specific object of type: option is similar to the For all objects of type: option, other than the fact that this option gives you the opportunity to select a specific object (perhaps the processor on a specific monitored computer) to target the override to.
This option is useful if you want to create an override for a specific object. Take the CPU Percentage Utilization monitor that we used in the For all objects of a type: example. The For a specific option of type: option would be useful if you want to update the performance threshold for a single instance of the counter, on a single computer.
For all objects of another type...
The For all objects of another type... option allows you to apply the override to all objects of a type different from that of the rule or monitor you are overriding.
For example, you may locate or create a rule or monitor assigned to the Windows 2003 Operating System class that will also work against Windows 2000 servers. For the rule to apply to Windows 2000 servers as well, create an override using the For all objects of another type: option to select the Windows 2000 Operating System class.
These options define which object or group of objects the override will target.
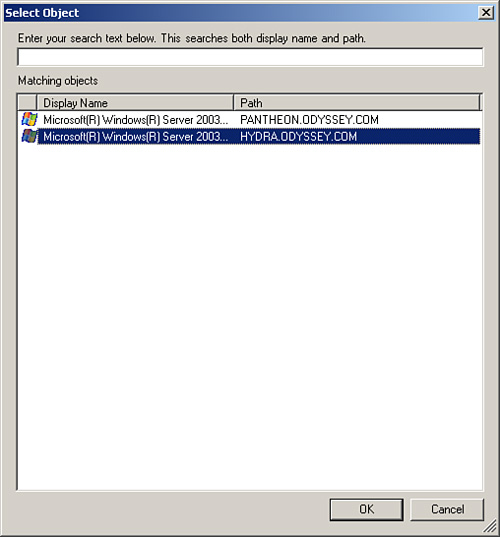
For our example, we will assume we have a single computer that is causing excessive alerts and therefore we select to target the monitor to a ...specific object of type Windows Server 2003 Operating System. Selecting this option presents the Select Object screen, as shown in Figure 14.58. Here we will select Hydra, which is the computer in our environment that is experiencing heavy usage and therefore generating alerts.
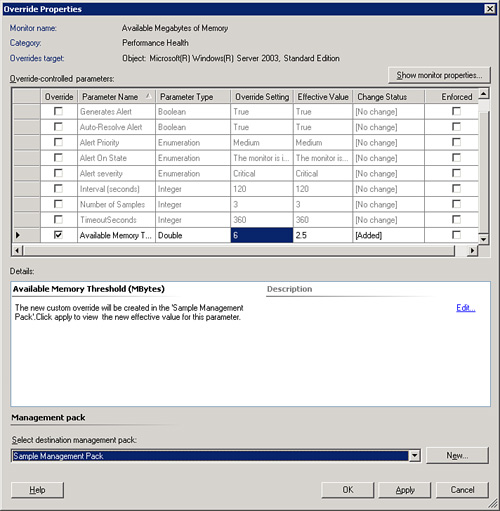
Click OK after selecting the object you wish to override. The Override Properties window displays, as shown in Figure 14.59.
The Override Properties window displays all the parameters you can override for the monitor. For this particular monitor, a large number of parameters are available to override. Because we are interested in modifying the threshold values, we will alter the Available Memory Threshold (Mbytes) parameter.
To modify this parameter, scroll down to tick the check box next to the parameter and type the new value in the Override Setting column, which should highlight automatically when you put a tick in the check box. The default value is 2.5MB, but you can change this as necessary. For our example, we will change this to 6MB. Type 6.0 into the column and click Apply (see Figure 14.60).
The next column (Effective Value) will change to reflect the change you made. Click OK to apply the override.
To verify the override, you can look in the Overrides Summary window. To locate this window, right-click the monitor and then choose Overrides Summary. You will see the override listed in the Overrides Summary screen shown in Figure 14.61. From here, you can delete or edit any overrides as required.


This section looked at overrides and stepped through configuring an override to a Windows performance monitor.
Note: Overriding Parameters
Not all parameters in monitors and rules can be overridden. If you cannot find the parameter you wish to override, it may be that it is not possible to override that parameter. If that is the case, it may be necessary to disable the rule/monitor using an override and create a custom rule or monitor to edit the values you require.
Finding overrides in the Operations console is not difficult, but in large, complex implementations where there may be many hundreds and even thousands of overrides, it can become difficult and time consuming to locate them in the console. In this case, consider using the Operations Manager Command Shell.
The Command Shell builds on Windows PowerShell. It contains the Operations Manager functions and cmdlets you can use to manage Operations Manager from the command line. Some features, such as configuring connected management groups, are only possible using the Command Shell, so you will want to familiarize yourself with it. More information on the Operations Manager Command Shell can be found in Chapter 3, “Looking Inside OpsMgr.”
In this section, we will look at one aspect of the Operations Manager Command Shell—managing overrides using the Command Shell. Follow these steps:
Load the Command Shell. Although you can do this manually through the PowerShell interface, the easiest way to load the Command Shell is to navigate to Start -> Programs -> System Center Operations Manager 2007 -> Command Shell. This opens a PowerShell interface with the OpsMgr functions and cmdlets already loaded.
Once the Command Shell window appears, you can use the following command structure to export a list of overrides to a .csv file:
<LINELENGTH>90</LINELENGTH>Get-override -managementPack <MP name>.mp | export-csv <csv file name>.csv
In this example, we will look for the override we created earlier in the “Creating an Override” section of this chapter. From the Command Shell, type the following command on a single line in the Command Shell:
<LINELENGTH>90</LINELENGTH>Get-override -managementPack Sample.Management.Pack.mp | export-csv "C:orExport.csv"
This exports into a CSV-formatted file all the overrides for our Sample Management Pack, which is where we earlier created our override. After running this command, open the file and you will see the output displayed in Figure 14.62.
This step assumes that you have previously exported the management pack. If this is not the case, you can navigate to the Administration space, right-click the Sample Management Pack, and choose Export from the context menu.

As you can see in Figure 14.62, the file output is rather raw. To get the most from the output, we suggest opening the file in a spreadsheet application (such as Microsoft Excel) that allows you to resize the columns to help with viewing the data.
Using this cmdlet is a very quick way to locate all overrides in a management pack.
Tip: Using Excel with CSV Files
Although you can view CSV files in a number of applications, we recommend Microsoft Excel because the data is automatically grouped into columns and can be manipulated as required.
After locating the appropriate override, you can modify it in the Authoring space of the Operations console, using the method described earlier in the “Monitors” section of this chapter.
Several additional techniques are available for listing active overrides:
You can simply use a Command Shell command to dump all the overrides out at one time. The following command will dump all overrides in descending order sorted by LastModified date to a CSV file. You can view the file as we did in the previous example in the “Using the Command Shell to Locate Overrides” section. The code is as follows on a single line in the Command Shell:
<LINELENGTH>90</LINELENGTH>get-ManagementPack | where {$_.Name -like "*" } | get-Override |sort-object LastModified -descending | select-object name, displayname, xmltag, value, timeadded, lastmodified | export-Csv -Path "c:overrides.csv"More information on this technique is available from http://systemcenterforum.org/tip-dumping-all-overrides-in-operations-manager-2007/.
There also is a very useful tool written by Boris Yanushpolsky of the MOM Team that you can use to locate overrides. This is the Overrides Explorer graphical tool, which simply reads from the OpsMgr configuration. You can download the tool from http://blogs.msdn.com/boris_yanushpolsky/archive/2007/08/09/override-explorer-v3-3.aspx.
When you run the tool, select File -> Connect and input the name of the Root Management Server. The tool reads the data, and the overrides are listed by group or by managed entity. We have found it most useful when searching by group. Figure 14.63 displays this utility.
One of the neatest features of this tool is its ability to move overrides to a different unsealed management pack. Say, for example, you have created a custom management pack for overrides and a junior OpsMgr administrator creates a new override—but does not specify your custom management pack to store it. Typically, you would re-create the override to specify the correct management pack to save it. That is no longer necessary! Now you can simply locate the override in the tool, right-click, and select the Move to different MP option to move it to the correct management pack, without actually deleting and re-creating the override.

In the next section of the chapter, we discuss creating custom resolution states.
OpsMgr 2007 ships with two defined resolution states: New and Closed. To provide additional granularity, you can define your own custom resolution states. The following is the process for creating a custom resolution state:
Open the Operations console and navigate to the Administration space.
Select Settings. You will see the Settings pane on the right. Notice that we have highlighted Alerts in Figure 14.64.
Double-click the Alerts option to open the Global Management Group Settings – Alerts window displayed in Figure 14.65.
Click the New icon.
The Add Alert Resolution State screen appears. Type a name for the new resolution state and select a unique ID for it. (The ID impacts where it appears in the context menu. The number 1 appears at the top, whereas 255 is at the bottom.) In our example, we will call the resolution state Support and give it an ID of 100. Figure 14.66 displays the completed screen.
Click OK and OK again to finish creating the new alert resolution state.
To use the new state, navigate to the Active Alerts view in the Monitoring space, right-click an alert, and select Set Resolution State. The Support resolution state is now available. Figure 14.67 shows the context menu and an alert we placed in the Support resolution state.

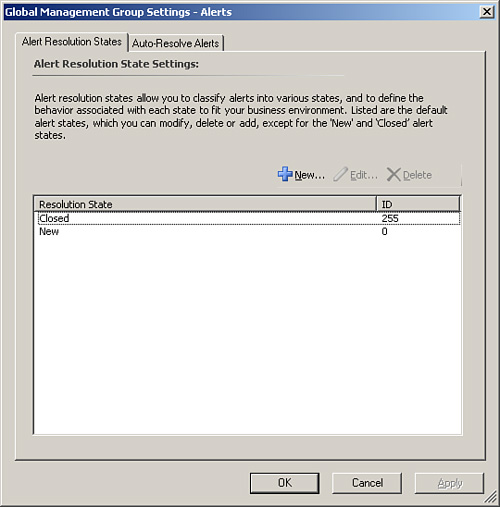
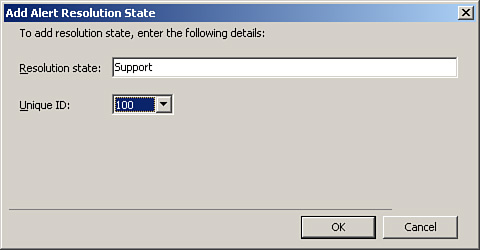
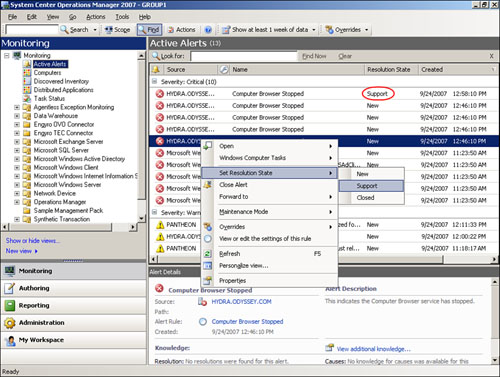
Now that we have looked at the different types of rules and monitors and have explained alerts in Operations Manager, let’s look at some recommendations for tuning your OpsMgr environment.
Note: Using Overrides to Modify Thresholds and Disable Rules
As you modify thresholds and disable rules during the tuning process, keep in mind that you cannot directly modify the rules themselves in OpsMgr. To be able to make the necessary changes, you will need to use overrides. We discussed overrides in the “Overrides” section earlier in this chapter.
The easiest way to carry out alert tuning is using the status of a managed machine to prioritize the tuning. There are three main color states in OpsMgr, which should be self-explanatory:
Using these colors, you can focus your tuning and alert analysis on the systems that are marked as critical (red) first, working down to warning (yellow). Unless any specific overrides must be created for a managed machine, machines that are showing as OK (green) can usually be left alone unless their status changes.
As we have explored in the “Rules” and “Monitors” sections of this chapter, state monitors and alerts are very different:
State monitors are updated based on the current status of the system and return to a healthy state when the failure condition is resolved.
Although monitors can generate alerts, these alerts are more often than not managed by the monitor, meaning that if the state monitor condition returns to normal, not only will the status return to Healthy but any alerts that have been raised by the monitor are automatically resolved.
Alerts raised by rules behave differently. These alerts will not resolve by themselves and require managing. In MOM 2000 and MOM 2005, these types of alerts were the only type available; this meant when large numbers of computers were being managed, the alerts in the console would require a huge amount of resources to manage. Large numbers of alerts were generated on a daily basis, and each alert had to be manually managed and resolved.
With monitor-managed alerts, the Operations console is less cluttered by alerts and therefore requires less human intervention, because the monitors resolve alerts automatically when the error condition is resolved. However, it will still require some degree of watching, and the number of alerts will continue to increase with the number of systems you are managing.
You should consider this difference in status monitors and alerts when you create custom rules and monitors, because creating a large number of alert-generating rules can affect the number of alerts that appear in the system and increase your management overhead for those alerts. Additional information on creating management pack objects is included in Chapter 23.
When you are managing issues, they might fall outside your knowledge, expertise, or responsibility. In those cases, you will want to reassign the issues to a more knowledgeable party. OpsMgr allows you to manage this escalation process using the Alerts view in the Operations console. OpsMgr (as did previous versions of MOM) supports creating custom resolution states.
Out of the box, OpsMgr 2007 has two resolution states: New and Closed. However, you may add additional alert resolution states as necessary to assign alerts to different support groups. We discussed this process in the “Creating Custom Resolution States” section of this chapter. After creating customized alert resolution states and using them, you may want to create custom views to view alerts from specific groups separately from the rest.
There are many different types of views, including Alert views, Performance views, and Event views. The process for creating each different view type is similar, so we will not cover each of them here. However, we will show you how to create a basic Alert view. To create an Alert view, follow this procedure:
Open the Operations console and navigate to the Monitoring space (or to My Workspace, depending on your access rights).
From the Navigation pane, right-click the subfolder where you will create the view. Now select New -> Alert View, as shown in Figure 14.68.
The Properties screen for the view opens, displayed in Figure 14.69. Input a name for the view. We will call ours Windows Server Alert View. Enter a description as appropriate.
You can configure the view to display information from either a specific class or a group. We will be displaying critical alerts from the Windows Server class only. First, we must select the class we want to return data for. Click the ... button next to Show data related to. The familiar Select a Target Type dialog box will open. Type Windows Server into the Look For box and select the Windows Server class in the Windows Core Library management pack, as shown in Figure 14.70. Click OK.
Back at the Properties screen, we will filter the alerts so that only alerts with a severity of Critical are displayed. From the options that appear in the middle pane of the screen, check the box for a specific severity.
The information is now transferred to the bottom pane where the word specific is a hyperlink. Click this hyperlink to input the required filter.
Selecting the hyperlink presents the dialog box shown in Figure 14.71. Check the box for Critical and click OK.
The Properties dialog box should now look similar to the one shown in Figure 14.72. Click OK to create the view.
To use this new view, select it as with any other view. The results will display in the right-side pane of the console.
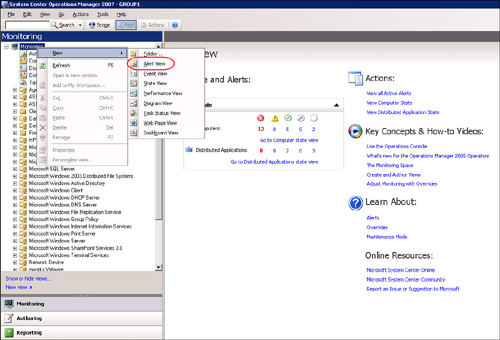
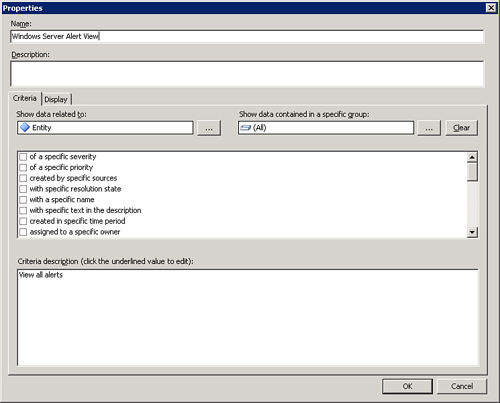
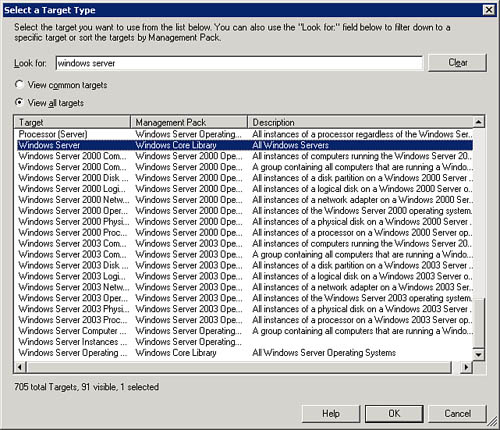


We will now discuss some of the rules and monitors that are usual candidates for tuning and/or threshold changes.
We will break down the process of alert tuning by management pack, addressing the core Operating System and Application management packs. You can also look at Appendix A, “OpsMgr by Example: Tuning and Configuring Management Packs,” for additional tuning tips.
When you’re configuring the Exchange Server 2003 management pack, it is critical to use the Exchange Management Pack Configuration Wizard. You can download the Configuration Wizard from http://go.microsoft.com/fwlink/?LinkId=35942. Be sure to rerun the wizard whenever you add another Exchange 2003 server.
Note: Exchange Management Pack Configuration Wizard
This tool only applies when configuring the Exchange 2003 management pack. It does not apply to the Exchange 2007 management pack.
The Exchange management pack is one of the biggest and most complicated Operations Manager management packs and therefore may require heavy tuning. In this section, we discuss the most common alerts that require tuning in the Exchange management pack.
The following rules and monitors generate alerts that are not required in all environments (you may disable these rules/monitors using an override if necessary):
SSL should be enabled (Monitor)—. Detects whether or not HTTP access to the Exchange server is secured in IIS. If you are not using HTTPS to secure this and do not intend to, this monitor should be disabled.
Disabled user does not have a master account SID (Rule)—. This feature is by design in Exchange. Once an account has been disabled for x days, the Exchange mailbox SID is deleted. This rule should be disabled if you intend to keep user accounts for a period of time after the accounts are no longer required.
Outlook Web Access Logon Monitor (Monitor)—. This runs the script that performs a synthetic logon to OWA and verifies that OWA is working correctly. You should only disable this monitor if there is no requirement to monitor OWA.
There is an additional monitor in the Exchange management pack requiring further configuration that does not fall under the category of threshold modification. This monitor is the Log Files Truncated monitor.
The monitor detects if Exchange backups are not truncating the Exchange Transaction logs. The number of days set as the maximum is 2 by default. Depending on your Exchange backup schedule, the number of days may need to be increased. You can configure the number of days using an override by changing the Max Allowed Days Old parameter in the override.
For the Active Directory management pack, you will first want to verify that it has been correctly configured, that the Active Directory management pack Helper Objects (oomads.msi) are installed on the DCs, and that the necessary MOMLatencyMonitors Active Directory container has been created and all required permissions applied. Instructions on carrying out this configuration are in the Active Directory Management Pack Deployment Guide, which you can download from http://technet.microsoft.com/en-us/opsmgr/bb498235.aspx.
Although the Active Directory management pack is not the largest management pack, it does require some level of alert tuning.
The following rules and monitors generate alerts that may not be required in your environment (you can disable these rules/monitors if necessary):
AD Trust Monitoring (Monitor)—. Used to launch the AD Monitor Trusts script. Unless you have a specific requirement to monitor Active Directory Trusts, this monitor should be disabled because the script is known to generate errors if no trusts are found.
The AD Machine Account Authentication Failures Report has data available (Rule)—. This rule can generally be disabled because it provides information that is not required, provided you correctly configure a subscription to the report.
In addition to the rules and monitors listed in the previous section, you may need to modify the following values for them to function correctly in your environment:
The script AD Replication Monitoring—. The AD Replication Monitoring monitor launches the AD Replication Monitoring script, which monitors Active Directory replication both within the local site and in the enterprise. These settings are presented as overrides on the monitor and therefore can be changed via an override.
Intersite Expected Max Latency (min)—. The value for replication across all DCs in the enterprise. The default value is 15 minutes.
Intrasite Expected Max Latency (min)—. The value for replication across all DCs in the local site. The default value is 5 minutes.
Additional information on configuring these values is available in the Active Directory Management Deployment Guide, downloadable from http://technet.microsoft.com/en-us/opsmgr/bb498235.aspx.
The script AD Client GC Availability Performance Collection (rule)—. Checks the number of Global Catalog servers available and responding in the local site, generating an alert if the value of MinimumAvailableGCs is less than the default of 3. You can change this value with an override if necessary.
Note: Positioning Your Global Catalog Servers
Exchange requires at least one Global Catalog (GC) server to be available at all times in the local site. Exchange will fail over to a GC in a remote site in the event of a local GC failure, but this increases network traffic and affects Exchange performance with the overhead of making regular lookups to a remote GC.
We recommend at least two Global Catalog servers for fault tolerance, and additional servers as required depending on the size of the Exchange infrastructure and the number of Active Directory and Exchange users in the local site.
The rules and monitors most likely to require threshold customization are those that monitor operating system performance.
By default, the Windows Server Operating System management pack requires very little alert tuning. Most of the changes required are threshold changes. The following rules/monitors may require threshold changes in your environment. Note that if a monitor is configured as a self-tuning threshold monitor, it may be necessary to modify the sensitivity of the baseline rather than changing a static threshold value.
Performance Threshold: Processor % DPC Time threshold exceeded (Rule)—. Monitors the Processor % DPC Time. A requirement to set a high threshold value may indicate processor performance issues on one or more of your servers.
Performance Threshold: Memory % Committed Bytes In Use threshold exceeded (Rule)—. Monitors the Memory % Committed bytes in use. A requirement to set a high threshold value here could indicate memory usage issues on one or more of your servers.
Performance Threshold: Physical Disk Average Disk Seconds per Write threshold exceeded (Rule)—. Monitors the Physical Disk Average Disk Seconds per Writes. A need to set a high threshold value here could indicate disk performance issues.
Performance Threshold: Processor % Interrupt Time threshold exceeded (Rule)—. Monitors the Processor % Interrupt Time. A requirement to set a high threshold value here could indicate performance issues on one or more of your servers.
Performance Threshold: Physical Disk Average Disk Seconds per Read threshold exceeded (Rule)—. Monitors the Physical Disk Average Disk Seconds per Reads. A requirement to set a high threshold value here could indicate processor performance issues on one or more of your servers.
Performance Threshold: Processor % Processor Time Total threshold exceeded (Rule)—. Monitors the Processor % Processor Time. A requirement to set a high threshold value here could indicate processor performance issues on one or more of your servers. It may also indicate that an application or process is utilizing a large amount of processor time.
Performance Threshold: Memory Available Megabytes threshold exceeded (Rule)—. Monitors the Memory Available Mbytes. A requirement to set a high threshold value here could indicate a requirement to upgrade memory on one or more of your servers.
The SQL Server management pack is the final management pack we will address in this chapter. This management pack contains several rules/monitors with thresholds to customize. The following rules/monitors have thresholds that you can configure as required:
Number of deadlocks (Monitor)—. Detects SQL deadlocks. A deadlock occurs when two users (or sessions) have locks on separate objects and each user wants a lock on the other’s object. Each user waits for the other to release his or her lock. If this threshold needs to be increased, investigate the affected SQL Server database, because deadlocks can cause a significant performance impact to the database. This monitor only applies to SQL 2000 servers and is disabled by default. If you wish to use this rule, you will need to enable it using an override.
Collect Buffer Cache Hit Ratio < 90% for 15 minutes (Rule)—. Monitors the hits on the SQL cache. A cache hit occurs when the server requests data pages that are stored in a memory buffer pool. If the threshold for this rule needs to be increased, it may indicate that the memory in the SQL Server is not sufficient and needs to be increased.
SQL User Connections Performance/User Connection Baseline (Monitor)—. These monitors are the most likely to require changes because they monitor the number of SQL users concurrently connected to the database. Because they are self-tuning threshold monitors, they require sensitivity changes rather than static threshold changes. If you have a SQL Server configured to accept a large number of connections, you may need to change the sensitivity of these monitors to prevent extraneous alerts. These monitors are also disabled by default and will need to be enabled, if required, using an override.
After tuning your alerts and configuring overrides as required, you will want to keep new false alerts to a minimum. As we know, sometimes it is necessary to shut down or reboot computers when applying patches and performing essential maintenance; when you have planned outages, alerts and health status changes in OpsMgr are not particularly welcome.
With that in mind, you can use the maintenance mode feature to stop monitoring a monitored system during scheduled maintenance periods.
Although maintenance mode existed in MOM 2005, OpsMgr 2007 lets you target maintenance mode at any object, not just a managed computer. This means, as an example, you could put a single SQL Server database into maintenance mode to take it offline, while still monitoring all other databases on the server and all other components of that server such as hard disk and CPU. This granular level of applying maintenance mode mirrors the level of granularity found throughout OpsMgr 2007.
We will provide an example of applying maintenance mode to an object by putting the C: drive of the Hydra computer in maintenance mode for 30 minutes to carry out some essential maintenance.
The easiest way to put a component into maintenance mode is to use the Diagram view of the monitored computer to locate the component. Perform the following steps:
Navigate to the Computers view in the Monitoring space and right-click the Hydra computer. From the context menu, select Open -> Diagram View.
A Diagram view similar to the one shown in Figure 14.73 appears.
From the Diagram view, right-click the C: drive object (highlighted on the left in Figure 14.73) and from the context menu, select Maintenance Mode -> Start Maintenance Mode.... This opens the Maintenance Mode Settings window.
Check the Planned box on the right and the Selected objects only radio button. Now, select a category for planned maintenance, as displayed in Figure 14.74. We will select the Hardware: Maintenance (Planned) category from the dropdown list. Click OK, and add a comment if you like. Set the number of minutes to 30 and then click OK.
If you refresh the Diagram view, you will see that the object now has a small spanner icon (circled in the screenshot) to indicate it is in maintenance mode, as shown in Figure 14.75.
You can edit maintenance mode and remove a managed machine/object from maintenance mode using the same context menu as we used in step 3.
Of course, you can put higher-level objects in maintenance mode, including an entire managed computer.
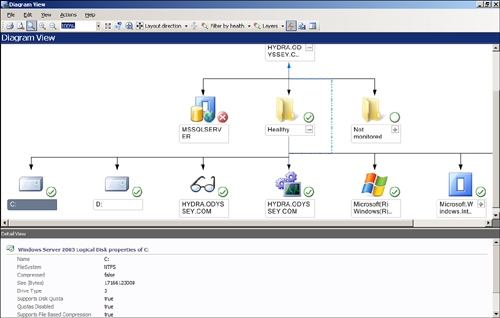
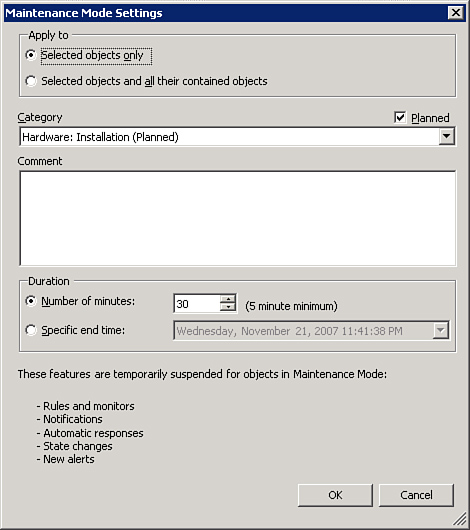

By default, maintenance mode automatically filters down to lower-level objects. As we just saw with the Maintenance Mode Settings window, you can change this by choosing Selected objects only.
You can also initiate maintenance mode using the Command Shell. This is useful when you want to script the adding of monitored objects into maintenance mode. You can find additional information on using the Command Shell to put a monitored object in maintenance mode in Chapter 8, “Configuring and Using Operations Manager 2007.”
In September 2007, Microsoft released the first wave of the Operations Manager 2007 resource kit. We discuss three of those utilities in the next sections:
AD integration sample script
Effective Configuration Viewer
Vista gadget bar
You can download the resource kit from the OpsMgr 2007 TechCenter, located at http://go.microsoft.com/fwlink/?LinkId=94593.
The AD integration sample script (SGPopulate.js) enables you to extract a list of computer names from your inventory database (System Center Configuration Manager, for example) or CMDB database and add them to an Active Directory security group.
The purpose of the tool is to assist in assigning machines to a management server when using OpsMgr Active Directory integration.
When you run the script, you must input a number of parameters to enable the script to carry out the following steps:
Connect to the SQL Instance hosting your inventory or CMDB database.
Connect to the inventory or CMDB database.
Run a SQL query to return the NetBIOS or host name of a group of computers.
The script uses the returned computer names to populate the specified AD security group. You must specify the following parameters when running this script:
serverInstance—. The SQL Server Instance hosting the inventory database
database—. Inventory database name
query—. SQL query to return the list of computer names
sgName—. Active Directory security group name
The following is an example of how the script could be used:
SGPopulate.js CMDBServer01 MyCMDB "SELECT ComputerName FROM Computers WHERE Location = US" OpsMgr-SG-01
Using this example, the AD security group OpsMgr-SG-01 is populated with the computer names returned from our SQL query. You can then use the Agent Assignment and Failover Wizard in OpsMgr to create a Lightweight Directory Access Protocol (LDAP) query to return all members of this group. Additional information on the Agent Assignment and Failover Wizard can be found in Chapter 9, “Installing and Configuring Agents.”
The Effective Configuration Viewer returns the resultant set of monitors and rules running on a monitored object after all management packs and overrides are applied. This is particularly useful because it is often difficult to see this information—particularly given that the appearance of the rules and monitors in the Operations console can be significantly different from those on the agent, because the rules and monitors in the Operations console are displayed before the overrides are applied.
Download the tool and extract the executable from the zip file. When you execute the tool, click File -> Connect. Then input the RMS server name and click OK.
To view the resultant data for an object, click File -> Pick an Object and select the object you want to view the configuration for in the Object Picker, as we have in Figure 14.76. You can select computers or distributed applications, or you can specify Other to choose another OpsMgr object.

After selecting the object, clicking OK displays rules, as shown in Figure 14.77.

The Objects Tree shows that you can view OpsMgr licensing information for that object as well (see Figure 14.78).

You can export data captured by the Viewer to XML by selecting the Export to XML option from the File menu.
In addition, you can execute this tool from the command line. Open a command prompt (select Start -> Run -> and then type CMD) and navigate to the folder where you extracted the tool. If you run it from the command line, it seems that nothing is happening because the prompt is still available, but the executable is doing its work in the background!
The following code syntax can be used to show the effective configuration of an agent. In this example, we will return the effective configuration of the Pantheon server object.
Use the following command-line example to create and save a file that lists the rules and monitors for a particular object:
effectiveconfigurationviewer Hydra.odyssey.com Pantheon.odyssey.com c:pantheonresults.xml
This sample line of code specifies three parameters:
Hydra.odyssey.com as the RMS
Pantheon.odyssey.com as the target
C:pantheonresults.xml as the output file
Note that the utility does not provide an option to enter credentials other than those with which you are currently logged on.
If your Vista computer has the Operations console installed, you can attach a Vista gadget that is similar to the Red/Yellow/Green state counter toolbar in MOM 2005. This feature complements the Operations console significantly, so much that it makes Vista almost a preferred desktop platform for OpsMgr operators. Figure 14.79 displays the gadget.
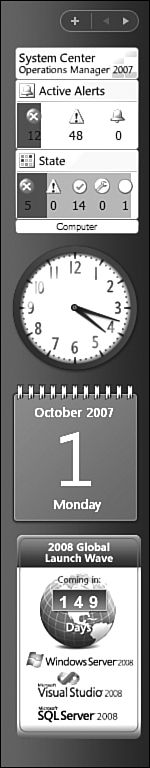
The top section of Figure 14.79 lists active alerts from that target, and you can modify the sort order. Underneath that, we see the state of the objects in the target class or group.
To use the gadget, you select the target class or group you are interested in, such as the Computer class or the All Computers group. As an example, Exchange administrators can run the gadget focused on the Exchange group, to keep a handle on Exchange server events and state.
If you hover over the gadget body and click the mini-wrench icon that appears to the upper right of the gadget in Figure 14.79, you open the OpsMgr Gadget Connection Settings dialog box (see Figure 14.80). Note at the bottom of Figure 14.80 that we selected the Computer object class for the Criteria setting.
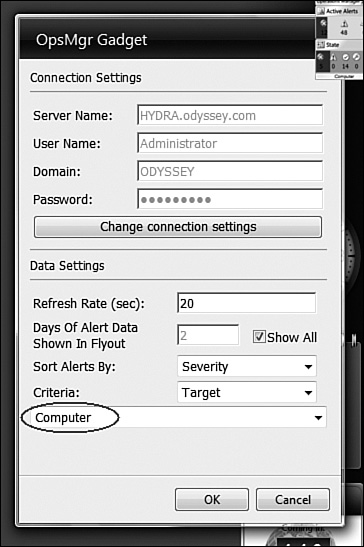
We can also drill down into the alerts and state sections of the gadget bar. Figure 14.81 shows a fly-out view you get from clicking the Alerts section of the gadget.

Figure 14.82 shows the fly-out view from clicking the State section of the Vista gadget.
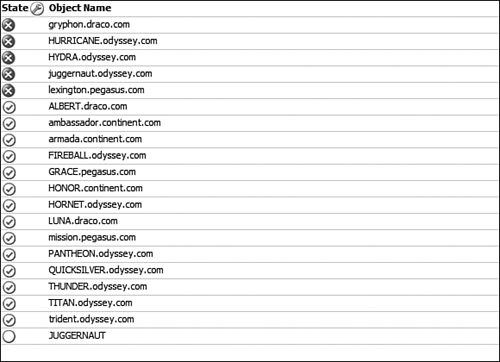
In this chapter, we explained the various rule and monitor types in OpsMgr 2007. We discussed alerts and defined the life cycle of an alert by explaining the notification workflow. We also described overrides and the process for creating and locating an override, including the process for exporting overrides using the Command Shell.
We also looked at the process for tuning alerts, supplying you with information on typical rules and monitors that may need tuning in your environment. We provided advice on using maintenance node to minimize alerts and health status changes for objects that were subject to scheduled outages. Finally, we looked at some of the Resource Kit utilities that assist in the configuration, maintenance, and management of OpsMgr 2007.
The next chapter discusses Audit Collection Services, a new capability introduced with Operations Manager 2007.