
The previous chapter discussed various methods available to extend the functionality of Operations Manager 2007 (OpsMgr) through interoperability with various technologies. In this chapter, we will discuss another way you can extend OpsMgr—by creating your own management packs and reports. As an early warning, this chapter gets pretty deep into the details of how to create management packs and reports, including several sections that dissect eXtensible Markup Language (XML). We believe that this level of depth is required to equip you with what you need to know to create management packs and reports in OpsMgr.
You can create OpsMgr 2007 management packs using a variety of methods discussed in this chapter. These methods include the following:
The Authoring pane of the Operations console
The Authoring console
Third-party products such as Silect MP Studio
XML (eXtensible Markup Language)
Additionally, we will discuss different ways you can create reports. This includes the Operations console, using linked reports, and with Visual Studio.
Operations Manager 2007 functionality is contained in its management packs. These management packs consist of a variety of objects. Management packs can contain rules, monitors, tasks, views, and product knowledge. Management packs can be imported into your management group (discussed in Chapter 8, “Configuring and Using Operations Manager 2007”) and exported (discussed in Chapter 12, “Backup and Recovery”) using the Operations console or the PowerShell Command Shell. Management pack development can occur using a variety of different interfaces, including the Operations console, the Authoring console, Silect MP Studio, and editing XML. Using the Operations console is the simplest method, but XML allows more functionality and flexibility, although it is far more intricate and complex.
Before delving into how to create management packs, it is important to make a distinction between what a management pack can be versus what it has to be:
A management pack can be a very large and complex development effort that includes the health state and provides monitors, rules, alerting, views, and tasks.
A management pack can also be a single useful rule, monitor, or task that provides benefit.
It is easy to become locked into the perspective that to create a management pack you need to include all the functionality available, but as we will show in the “Using the Operations Console” section of this chapter, a beneficial management pack can often be created with only a single component such as a monitor, rule, or a task.
You can create management packs and the objects within them using the Operations console, utilizing a variety of approaches. The next sections describe these approaches.
Before adding objects to a management pack, we must first create the management pack. Create the management pack object in the Administration space of the Operations console. To create the management pack, right-click Administration and choose Create Management Pack.
For those clients we work with, our practice is to create a management pack incorporating the company name to store that company’s overrides. In general, each organization will want to create multiple override management packs, with one for each application or service it is managing overrides for.
You will want to create other management packs based on the functionality they will be providing. In this case, we will be creating the “OpsMgr Unleashed” management pack, where we will be storing many of the various management pack objects we create as we progress through this chapter. You can also create management packs as part of the process of creating objects such as monitors, tasks, and rules, which we will discuss in the next sections of this chapter.
You can delete management packs in the Administration space, from the same location where you create them. Right-click the management pack and choose Delete. If other management packs are dependent on the management pack you are attempting to delete, the interface will not allow you to delete the management pack until you remove those that are dependent on it. As an example, if you create overrides from the Exchange management pack and store them in the Default management pack, you cannot delete the Exchange management pack until you delete the Default management pack. This is a major reason why you do not want to store customizations in the Default management pack!
As a starting point for developing a management pack, we will discuss each of the different objects (Monitors, Tasks, Rules, Views, and Knowledge) and how to create them in the Operations console. For information on each of these different objects and their usage, see Chapter 14, “Monitoring with Operations Manager.” As we discuss in that chapter, there are a variety of different monitors:
Windows Event monitors
Windows Service monitor
Windows Performance Counter monitor (static or self-tuning)
Log File monitor
SNMP monitor
Scripting (timed script two-state and three-state monitors)
WMI Event and Performance monitors
In this chapter, we will first focus on providing examples of how to create the objects, and then we will discuss how to put them all together. Because Chapter 14 discussed creating a Windows Event monitor, in this chapter we will start with creating a simple monitor. This monitor will be an example of how to create a Windows Service monitor, which we will use as part of our OpsMgr Unleashed management pack.
For this particular case, we will add our monitor to the existing Windows Server 2003 Operating System target as part of the Availability monitor. In the “Using the Operations Manager Authoring Console” section of this chapter, we will show how you can create your own self-contained management pack, including monitors.
The default configuration of Operations Manager 2007 monitors a core set of services, invoking alerts if any of these services stops running. These services include the following:
Computer Browser
DHCP Client
DNS Client
Logical Disk Manager
Messenger Service
Plug and Play
RPC
Server
TCP/IP NetBIOS
Windows Event Log
Workstation
Services not on this list are monitored by the management packs that specifically support them (such as the DNS management pack, which monitors the availability of the Microsoft DNS server service). So what can we do to notify (alert) if some other service is down that we want to know about?
Let’s say we have McAfee software deployed to provide antivirus functionality. Multiple McAfee services are running on our servers (McAfee Framework Service, McAfee McShield, and McAfee TaskManager), and we want to generate alerts if they are not running. Perform the following steps:
Open the Operations console and browse to Authoring -> Management Pack Objects -> Monitors.
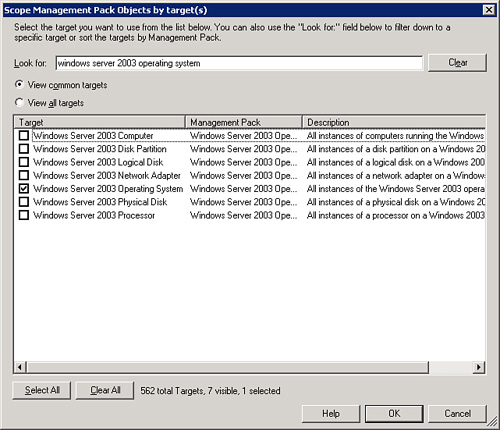
Set the scope to Windows Server 2003 Operating System (or Windows 2000 Operating System, depending on your specific requirements) and check the Windows Server 2003 Operating System check box, as shown in Figure 23.1.
Next, browse in the console to Windows Server 2003 Operating System -> Entity Health -> Availability -> Core Windows Services Rollup. Right-click and choose to create a new Unit monitor (see Figure 23.2).
Now, we must specify the type of monitor we will create. Select the Windows Services -> Basic Service Monitor type (see Figure 23.3). Choose a destination management pack (preferably something other than the default one) and click Next to continue.
Enter the service name for the name of the monitor (McAfee Anti-Virus in our example). Verify that the monitor target is correct (Windows Server 2003 Operating System) and that the parent monitor is correct (Core Windows Services Rollup). See Figure 23.4 for an example.
To find the service on the server, select the ellipsis (...) on the Service Name screen, use the wizard to browse the computer’s services, and then click the service. Click Next to continue.
Tip: Connecting to Services Not in the Forest
When browsing for a Windows service, you can connect to those computers where you have permissions to browse for the services. If you need to browse to a system you do not have permissions for (such as a computer in a workgroup), first map a drive to that computer and then browse for the services on the system.
The default configurations for Health work well for services. These configurations set the monitoring condition as Healthy if the service is running and Critical if the service is not running. Click Next to continue.
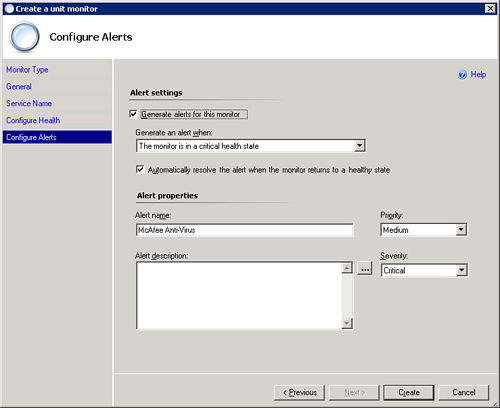
At the Configure Alerts screen, check the box to generate alerts for this monitor. Accept the defaults for Automatically resolve the alert when the monitor returns to a healthy state, Alert name, Priority, and Severity, as shown in Figure 23.5. Click the Create button to create the completed monitor.


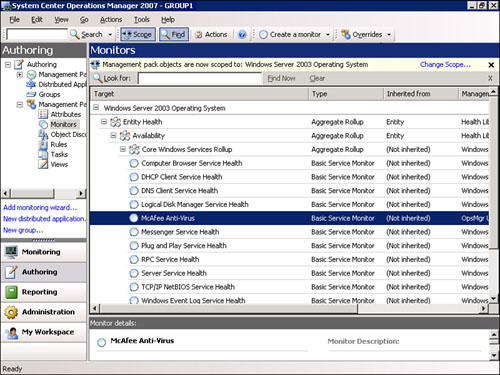
Once you have created the monitor, you can see it under the list of monitors for the Windows Server 2003 operating system, displayed in Figure 23.6.
Note: Creating Additional Monitors for Different Targets
In our example, we defined the target as Windows Server 2003 Operating System. To monitor the service on both Windows 2000 and Windows 2003 servers, you will need to create a monitor for each target.
For another example of how to use service monitoring functionality, you could create a monitor that checks the state of the services providing backup functionality. CommVault, for instance, installs services on the servers for which it provides backup functionality. You can use a monitor to watch the backup services, and you can configure that monitor to monitor whatever backup program you run in your environment (CA ARCserve, CommVault Galaxy, EMC Networker, Tivoli Storage Manager, Symantec NetBackup, and so on), as long as it runs a local service on the system you want to monitor.
You can create Console or Agent tasks, which run on the console or agent, respectively. The different types of tasks include the following:
Agent Task -> Command line
Agent Task -> Run a script
Console Task -> Alert command line
Console Task -> Command line
Console Task -> Event command line
We previously discussed the concepts behind tasks in Chapter 20, “Automatically Adapting your Environment,” where our discussion focused on using existing tasks as part of diagnostics and recoveries. In this chapter, we will focus on using tasks to simplify managing OpsMgr 2007. We will create a console task to resolve alerts that have not been incremented or updated in a specified timeframe. This is useful for cleaning out old alerts that have not recurred. Perform the following steps to create the task:
Open the Operations console. Navigate to Authoring -> Management Pack Objects -> Tasks. Right-click and choose Create a new task....
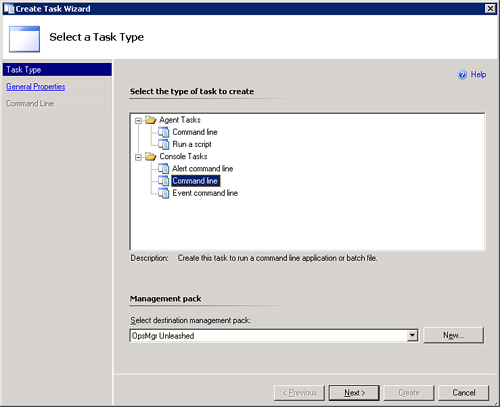
For our example, we will create a task that will run on the console through the command line (see Figure 23.7). We will store the task in the OpsMgr Unleashed management pack we previously created.
Next, we define the task’s general properties, such as Task Name (Resolve Alerts), Description, and Task Target (Management Server), as shown in the General Properties screen displayed in Figure 23.8. Click Next to continue.
On the Command Line screen, specify the Application, Parameters, and Working directory settings, as well as whether to display output when this task is run. Click Create to finish creating the task.
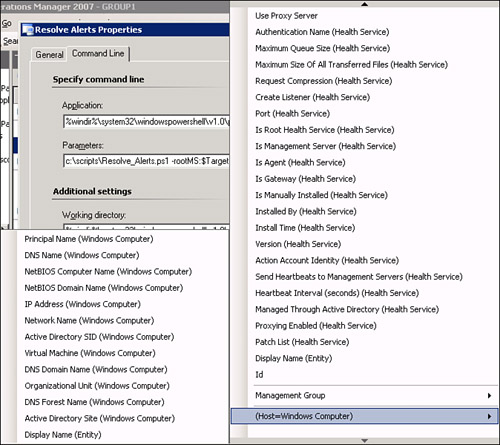
The command will run a PowerShell script (included on the CD for the book) named resolve_alerts.ps1. The script is a variation of one written in the newsgroups by Neale Brown, which we altered to run with parameters that we pass as part of the task. The following are the parameters for the Command Line screen in our example, displayed in Figure 23.9:
Application:
<LINELENGTH>90</LINELENGTH>%windir%system32windowspowershellv1.0powershell.exe
We start with specifying the location and name of the PowerShell application.
Parameters:
<LINELENGTH>90</LINELENGTH>c:scripts esolve_alerts.ps1 - rootMS:$Target/Property[Type="SystemLibrary6050000!System.Entity"] /DisplayName$ -Minutes:1440
The full parameter line is too long to display within the parameters field on the screen, so we expanded this into the text shown in the box at the bottom of Figure 23.9.
Working directory:
<LINELENGTH>90</LINELENGTH>%windir%system32windowspowershellv1.0Display output when this task is run: Not checked
To summarize, the application we are launching is PowerShell, and the parameters specify a PowerShell script (resolve_alerts.ps1) stored in the c:scripts folder.
Within the parameters section of Figure 23.9, we next need to define the parameters the PowerShell script will use.


The section following -rootMS on the parameters is defined by browsing through the available variables (the arrow circled on Figure 23.9 is the button that displays the available variables that can be added).
Figure 23.10 gives an example of the options available. The information is added as command-line variables; when the script runs, the variables are substituted with the appropriate value. In our example, we could have typed in the name of our Root Management Server (RMS) on the parameters line after where it says rootMS:, but instead we will pass a variable that uses the DisplayName of the system where the task runs.
Because we have set the task target to Management Server (shown in Figure 23.8), this substitutes correctly when the script runs.
Finally, we add the -Minutes parameter; this indicates the number of minutes an alert would have not been updated prior to its being resolved (1440 is the number of minutes in a day, or 60 times 24). You can change this parameter to the value you prefer for your environment, such as a value of 360 to resolve alerts that have not updated or had activity in 6 hours.
We are not selecting the check box to display the output. However, when you are debugging your scripts, it is a good idea to have this checked so that you can validate if the script fails to run.
The PowerShell script used by the task is stored in the c:scripts folder with a name of scriptresolve_alerts.ps1. The content of this script follows:
param ($rootMS,$Minutes)


#Initializing the Ops Mgr 2007 Powershell provider
     add-pssnapin "Microsoft.EnterpriseManagement.OperationsManager.Client" -ErrorVariable errSnapin;
     set-location "OperationsManagerMonitoring::" -ErrorVariable errSnapin;
     new-managementGroupConnection -ConnectionString:$rootMS -ErrorVariable errSnapin;
     set-location $rootMS -ErrorVariable errSnapin;


#Checks to see if it failed or succeeded in loading the provider
     if ($errSnapin.count -eq 0){
     Write-host "'nOpsMgr 2007 PSSnapin initialized!'n";
     }
     else{
            Write-host "'nOpsMgr 2007 PSSnapin failed initialize!' nPlease verify you are running this script on a Ops Mgr 2007 Management Server";
     Write-Host;
     }


$alerts = get-alert


foreach($alert in $alerts)
{
$timespan = new-timespan (get-date $alert.LastModified)
if ($timespan.totalMinutes -gt $Minutes)
{
Write-Host "id: " $alert.id
Write-Host "Total Minutes: " $timespan.TotalMinutes
Write-Host "Alert Resolved!"
$alert | resolve-alert -comment "Auto-Resolved Alert"
}
}
The first line of the script identifies the parameters we defined with the task. Our example passes two parameters, rootMS and Minutes. The names should exactly match the parameter name specified on the command-line task.
Now that we created a task to resolve alerts, we want to make it easy to find and use this task. We can do this by creating a State view in the OpsMgr Unleashed management pack. Perform the following steps:
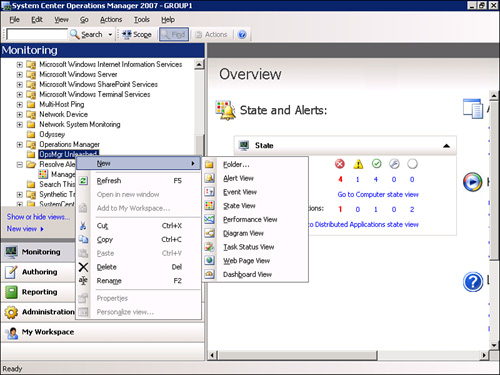
Open the Operations console and navigate to Monitoring -> OpsMgr Unleashed (this folder exists from creating the management pack in the “Creating and Deleting Management Packs” section of this chapter). Right-click and select New; you will see a variety of options available, as shown in Figure 23.11.
For our alert resolution example, we will create a State view that shows us the RMS. To do this, choose the New -> State View option.
We specify the name of the view, the description, and what this view will show data related to. In our example, we name the view Resolve Alerts and choose to show data related to the Root Management Server, as shown in Figure 23.12.
After creating this view, we open the Actions pane and click the State view at the top of the middle pane. Within the Actions pane, under Health Service Tasks, we now have a Resolve Alerts option available, circled at the bottom right in Figure 23.13.


The Resolve Alerts task provides us with a quick process to use for resolving alerts that have not been updated in a specified time period. There is also the Console task (Event command line), which performs a lookup on Eventid.net based on the event view of Operations Manager. Eventid.net is a website that provides information on events found within the various Windows Event logs. This task assists with debugging issues identified by OpsMgr. The Resolve Alerts and Console tasks are included on the CD for this book as part of the OpsMgr Unleashed management pack.
Chapter 14 introduced the different types of rules that are available. These are alert-generating rules, collection rules, and timed commands. Alert-generating and collection rules may be event based, performance based, or probe based. The different types of alert-generating rules include the following:
Event Based: Generic CSV Text Log (Alert)
Event Based: Generic Text Log (Alert)
Event Based: NT Event Log (Alert)
Event Based: Snmp Trap (Alert)
Event Based: Syslog (Alert)
Event Based: WMI Event (Alert)
Here are the different types of collection rules:
Event Based: Generic CSV Text Log (Alert)
Event Based: Generic Text Log (Alert)
Event Based: NT Event Log (Alert)
Event Based: Snmp Trap (Alert)
Event Based: Syslog (Alert)
Event Based: WMI Event (Alert)
Performance Based: SNMP Performance
Performance Based: WMI Performance
Performance Based: Windows Performance
Probe Based: Script (Event)
Probe Based: Script (Performance)
Finally, here are the different types of timed commands available:
Execute a Command
Execute a Script
As we discuss in Chapter 14, the process for creating rules is very similar to the process for creating monitors. As an example, we will create a timed command rule that executes the resolve_alerts.ps1 PowerShell script we built in the “Creating Console Tasks” section of this chapter. To create a new rule, perform the following steps:
Open the Operations console and navigate to Authoring -> Management Pack Objects -> Rules. Right-click and choose Create a new rule....
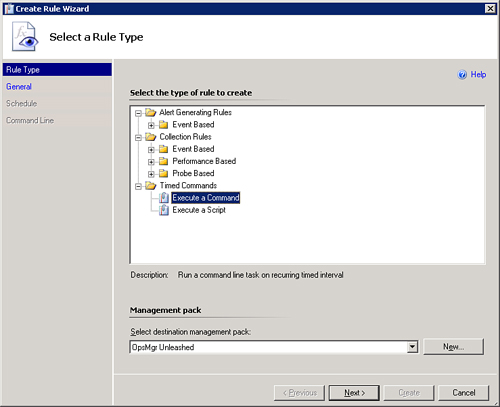
Select the Timed Commands -> Execute a Command option and OpsMgr Unleashed as the destination management pack, as shown in Figure 23.14. Click Next to continue.
Enter a rule name (Execute Resolve Alerts script, in our example) and description (optional). Then choose a rule target (the Root Management Server) and validate that the Rule is enabled check box is checked, as we show in Figure 23.15. Click Next.
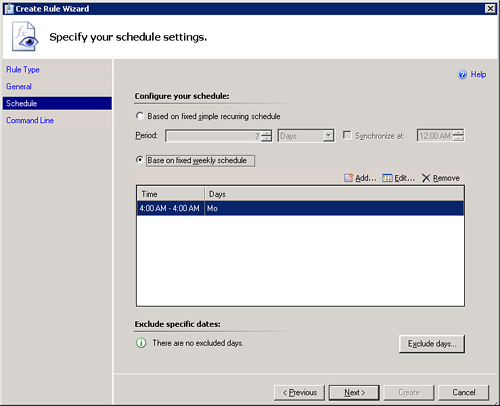
We now need to specify the schedule settings for our timed rule. Two options are available:
Based on fixed simple recurring schedule—. With this option, you can special a number of days, hours, minutes, or seconds.
Base on fixed weekly schedule—. Using this option, you can specify a specific time and day(s) of the week.
We want our task to run Monday morning at 4:00 a.m. (see Figure 23.16). We specify this configuration and click Next to continue.
To finish creating the rule, we complete the Configure Command Line Execution Settings screen, where we specify settings for Full path to file, Parameters, Working directory, and Timeout (in seconds). Figure 23.17 shows our settings, which are very similar to the configuration we used when creating the Console task command-line properties shown in Figure 23.9. (The Application specification in Figure 23.9 is the same as the Full path to file setting in Figure 23.17, and the Working directory setting is the same.)
We changed the Minutes parameter to a value of 5760 (a 4-day period) so we will only resolve alerts that have not updated in 4 days. We also set a 300-second timeframe for the script (5 minutes). This parameter determines how long alerts have to have gone without an update to their modification date. As mentioned in step 4, the script itself runs every Monday at 4:00 a.m.
We finish specifying the settings by selecting the Create button to create the rule, thus completing the process.


This example shows how you can use the Operations console to create rules that will perform a variety of actions, including the requirement of running tasks at a scheduled time.
These sections discussed the steps required and provided examples of management pack objects you can create with the Operations console. These objects included monitors, alerts (within the monitor), console tasks, views, and rules. You can create other components using the Operations console; these include diagnostic and recovery tasks, which we discussed in Chapter 20, and company knowledge, discussed in Chapter 14.
Although you can perform many of the tasks required to create management packs using the Operations console, a number of objects cannot be created with this console at this time. Table 23.1 shows the list of different management pack objects and the options currently available for their creation. The table reflects the options to create management packs that were available with the RTM version of Operations Manager.
Table 23.1. Management Pack Objects and Creation Methods
Management Pack Object | Creation Methods Available |
|---|---|
Management Pack file | Operations console, XML |
Class | XML only |
Relationship | XML only |
Object Discovery | XML only |
Monitor | Operations console, XML |
Rule | Operations console, XML |
Task | Operations console, XML |
Diagnostics | Operations console (with XML editing), XML |
Recoveries | Operations console (with XML editing), XML |
View | Operations console, XML |
Console Task | Operations console, XML |
Folders | XML only |
These options will continue to evolve as new tools become available (such as Microsoft’s Operations Manager Authoring console, which will be released with OpsMgr Service Pack 1) and new functionality is added (for example, Silect’s MP Studio). We will discuss both of these tools later in this chapter in the “Using the Operations Manager Authoring Console” and “Using Silect MP Studio” sections, respectively.
As you can see from Table 23.1, some objects must be created using XML and cannot be created with the Operations console.
There is some debate whether XML is a reasonable solution for management pack development. Some consider XML to be HTML with a bad-hair day, meaning it is one thing to write HTML, but XML looks like HTML written in an obscure dialect. The following sections of this chapter discuss XML and offer a perspective of what XML is and how it works.
In these next sections, we help you gain a general understanding of the XML document format. We will discuss how Operations Manager 2007 management packs use XML, and how to use XML editing when creating management packs.
You may have noticed that many new applications can read and write XML documents. As an example, XML documents are used in various aspects of OpsMgr 2007, such as when working with unsealed management packs or viewing event log information.
XML usage extends beyond OpsMgr with Microsoft products. For example, while Microsoft Office 2007 can read and write documents based on the Office file types we are familiar with (filename.XLS for Microsoft Excel spreadsheets, filename.DOC for Microsoft Word documents, and so on), Office 2007 can also read and write Office data files as XML documents. This may make you think that XML is a new technology, but that actually is not the case. XML was first established as a recommendation by the World Wide Web Consortium (W3C) in 1998, just one year after a relatively better-known markup language, HTML (HyperText Markup Language), became a W3C recommendation.
So, we know that XML is not new, and we know that many new applications are capable of interpreting documents that utilize the XML language. But just what is XML, and why it is so important in Operations Manager?
The XML acronym stands for eXtensible Markup Language. A markup language provides a way to combine text and extra information about it. The extra information is described using markup and is typically intermingled with the primary text. XML is a markup language, as is HTML, but there is one key difference between the two:
XML describes a set of data and identifies what the data is.
HTML displays data and specifies how the data looks.
Put another way, XML deals with defining data whereas HTML handles displaying data. This is an important distinction.
As markup languages, both XML and HTML documents combine text and additional information about the text. The additional information in the document defines the structure and presentation of the text by using the markup language, which consists of tags and elements within the document. In HTML, an element may be a paragraph of text displayed in the user’s web browser. For a simple example, consider the following HTML syntax:
<p><b>I think Operations Manager is cool.</b></p>
Remember that HTML deals with displaying information, so if you executed this HTML statement in a web browser, the result on the screen would be a bold-faced paragraph:
I think Operations Manager is cool.
This example uses the “bold” HTML tag (the <b> and </b> entries) to define that the statement should be in bold face, and the “paragraph” HTML tag (the <p> and </p> entries) to define the start and end points of the paragraph element. All HTML tags are predefined, and one can only use those tags previously defined.
Note: The HTML Connection
Because HTML is the closest thing to XML that many OpsMgr administrators may be familiar with, we use it here for comparison as we introduce the capabilities of XML.
To execute our sample statement using XML, we would revise it slightly. The XML language deals with describing the data, not with how to display the data. In the HTML example, the bold tags defined that the sample text should appear in bold face, so those commands affect what the web browser displays. In XML, that type of information is irrelevant, because XML defines what the information is, not how it looks.
This actually is why XML is so useful in OpsMgr. When we are building a new management pack, we want to define exactly what type of information to monitor and gather, and the XML programming language will provide the structure we need to define the data. Going back to our sample code, in XML the sample statement might be something like this:
<mycomment>I think Operations Manager is cool.</mycomment>
This example defines an element called “mycomment,” and the data for that element is “I think Operations Manager is cool.” Unlike the predefined tags in HTML, XML allows us to create any elements that are needed in order to define a set (or sets) of data. Here we defined the “mycomment” element, and the information contained within that element (“I think Operations Manager is cool”) is the data we are interested in gathering (rather than data we are interested in formatting).
An XML parser (like OpsMgr) can read our XML command and take whatever action was previously defined for the “mycomment” element. (The action might even include making it a bold-faced paragraph!) The element structure will become a little more obvious in the next section, “XML Management Pack Structure,” where we look at an OpsMgr management pack—which is an XML document.
As with any computer language, an XML document must follow a prescribed format in order for a parser to be able to read and execute the commands in that document. In the case of Operations Manager, the XML document must follow the OpsMgr management pack schema, which in turn complies with the standard XML document format adopted by the W3C. If you would like to review the XML document standard format, the W3C website, www.w3.org, discusses it in extensive detail.
The Operations Manager management pack schema is divided into sections or elements, with each section used to define a certain aspect of the management pack. The following list includes the available sections and a brief description:
Manifest—. The manifest defines the identity of the management pack and contains information about any other management packs referenced in the management pack. This section is mandatory, and all other sections are optional.
TypeDefinitions—. Several different type definitions are available (entity, data, schema, and so on). You can use these to define the information that is gathered.
Monitoring—. After the type definitions are defined, the monitoring section establishes the monitoring to perform. Several different monitoring types are available (rules, tasks, and so on).
Templates—. Templates provide a wizard a user can follow to define how to configure the monitoring in a management pack.
PresentationTypes—. Presentation types define the types that will appear in the Operations console. These can be views (State view, Event view, and so on) or images if the management pack provides a Diagram view.
Presentation—. Presentation defines what an administrator will see in the Operations console. This could be tasks, views, or other objects.
Reporting—. Reporting is used to define the reports included in the management pack. It also contains information on linked reports.
Language Types—. The language types section is available for creating a single management pack that would work in multiple languages.
Although the sections utilized will vary between different management packs, every management pack must have a manifest. The manifest is the only required section in an OpsMgr management pack.
Now that you have a general idea of how the management pack schema is broken down into different elements, we will dig a bit deeper into the management pack schema and take a closer look at the elements, discussing how the management pack schema relates to an XML document. Although we can accomplish this several ways, perhaps the most interesting method would be to create an unsealed management pack with the Operations console and then view the resultant XML document and discuss its sections, and how those sections relate to the management pack.
To that end, we used the Operations console to create a simple management pack that monitors the status of the print spooler service. If the print spooler service stops, it triggers an alert that appears in the Active Alerts section of the Monitoring node in the console, as displayed in Figure 23.18.
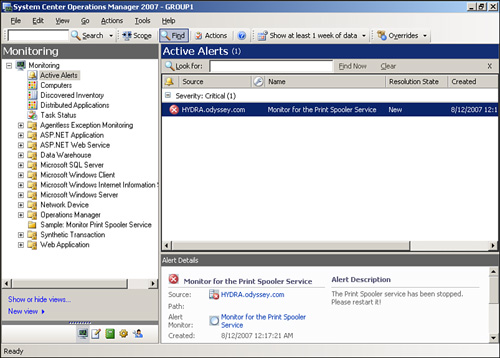
When the print spooler service starts, the alert is auto-resolved and the alert is removed from the Active Alerts view. Again, this is a very simple management pack—but we can use it to illustrate the various elements contained in a management pack XML document.
As we discuss in Chapter 13, filenames for sealed management packs have an .MP extension. Most of the management packs that you download from the System Center Pack Catalog (http://go.microsoft.com/fwlink/?LinkId=71124) are sealed. Because we created this management pack, it is currently unsealed and therefore will be an XML document. When we use the Operations console to create a management pack, OpsMgr does the work for us and automatically creates the XML document containing the structure of our management pack. We can find the XML documents on disk in the Health Service StateManagement Packs folder, under the folder used to store the OpsMgr binary files. The default location for the binary files is %ProgramFiles%System Center Operations Manager 2007. We could also use the Export Management Pack feature in the Operations console to export our management pack to a different XML file, but for this example, we will use the XML file OpsMgr has already created.
When you create or import a management pack, OpsMgr creates a unique identifier for the management pack and assigns it to the management pack. Operations Manager appends this unique identifier to the filename of the management pack. In our example, the friendly name of the management pack is Sample: Monitor Print Spooler Service but the actual .XML filename in the HealthServiceStateManagement Packs folder is Sample.Monitor.Print.Spooler.Service.{F16AD92A-81DA-4586-95DE-F0E3D37E1E11}.{843447D6-DB8D-AB9E-3FA5-5F09A09F69F2}.xml.
Now let’s look at our management pack XML document. You can use a variety of tools to view and edit XML documents. If we open our XML file in Windows Notepad, it would look something like what you see in Figure 23.19.

If we were experienced XML programmers, we might be able to view an XML document like the one in Windows Notepad and make perfect sense out of the commands and the element structure that is defined. In fact, if we were highly skilled XML programmers and if we had extensive experience with the management pack XML format, we could create the entire management pack using Windows Notepad!
However, for most of us, using Windows Notepad to view the contents of an XML document is not especially helpful—Windows Notepad is not an XML parser, and the element structure inherent in a properly formatted XML document is not particularly obvious to us as we view it in Windows Notepad. The element structure is there because this is a valid XML document, but it is hard to identify that structure using this particular tool.
Microsoft’s Internet Explorer has been able to parse XML documents since version 4.0, released in 1997. Viewing our sample XML document with Internet Explorer (see Figure 23.20) we should get a view of the management pack that is easier to understand.

Using Internet Explorer, we are able to view the data in a more structured format than we saw when we used Windows Notepad. We can see the various elements that are defined and some of the management pack schema sections we discussed previously (Manifest, Monitoring, and so on), which you may notice we circled in Figure 23.20.
Internet Explorer is useful if we want to view the structure of the elements in an XML document, but is not very helpful if we want to make changes directly to the XML document. To easily edit a XML document, we need an XML editor (or there is always Notepad). An XML editor can obviously parse XML documents, and it also provides the ability to edit directly the document as needed.
Although several different XML editors are available, we will use XML Notepad. XML Notepad 2007 provides great functionality and is available at no cost from Microsoft at http://www.microsoft.com/downloads/details.aspx?familyid=72d6aa49-787d-4118-ba5f-4f30fe913628&displaylang=en. (This location is included on the CD accompanying this book in Appendix E, “Reference URLs.”)
Using XML Notepad 2007 to open our sample XML document, we get a vastly different view of our document, as shown in Figure 23.21.

In Figure 23.21, we can clearly see the structure of the XML document, and we have the ability to expand (or collapse) specific sections if we want to view additional data in those sections. We also have the ability to edit the contents of the document if necessary.
We will now dig a bit deeper into our sample XML document and discuss some of the elements.
If we look at the top section of this XML document, we can see some standard preamble information for an XML document, including links to the XML schema and the XSL (eXtensible Stylesheet Language) transform. We also see a revision ID, which is the unique identifier that OpsMgr assigned to the management pack when it was created. We can see this same unique identifier appended to the filename of the management pack XML file at the top of Figure 23.22.

If we continue in XML Notepad, we see the manifest, which as you may recall is the only mandatory element in the management pack. In the manifest, we see a variety of information. First, we see the converted name of the management pack. The friendly name of the management pack is provided in the Name attribute, which is just below the Identity attribute. The friendly name for our management pack is Sample: Monitor Print Spooler Service. OpsMgr will always take the friendly name and convert it into a “dotted” name, which in this case is Sample.Monitor.Print.Spooler.Service. Operations Manager uses the dotted management pack name during internal processing, not the friendly name. When we created the management pack, we provided a version number (1.0.0.0), and this information is recorded in the Version element, under the Identity element. Figure 23.23 highlights the version number.
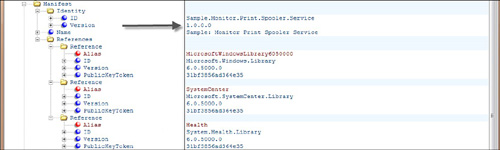
The reference element is the next section of the manifest element we will look at. The reference element in a management pack is important because it contains information about the other management packs referenced in the management pack. It is worth noting that an unsealed management pack can reference only sealed management packs, and an unsealed management pack cannot be referenced by any other management pack. Whereas most management packs will reference multiple sealed management packs or libraries, every OpsMgr management pack, regardless of the purpose of the management pack, will reference Microsoft.SystemCenter.Library. This is the core library for Operations Manager, and you will always see a reference to it in a management pack.
Our sample management pack refers to three libraries, which you can also see in Figure 23.23, under the References section:
Microsoft.Windows.Library
Microsoft.SystemCenter.Library
System.Health.Library
The logic for including these three libraries is as follows:
Microsoft.SystemCenter.Library is there by default.
Microsoft.Windows.Library is there because the management pack is monitoring a Windows service.
System.Health.Library is there because the management pack determines the health of our computer based on the status of the print spooler service.
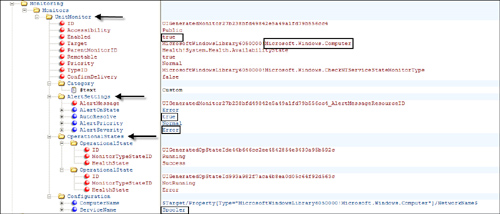
The purpose of this management pack is to monitor the print spooler service and generate an alert when the service stops. To accomplish this, we created a Unit monitor and configured it to monitor the Windows Print Server service. If we look at the Monitoring element of our XML document in Figure 23.24, we can clearly see that there is a UnitMonitor element defined and highlighted, and this element includes some additional elements related to the Unit monitor. From this information, we can determine a number of things:
We know that the target for this event is Microsoft.Windows.Computer.
We also know that the management pack is enabled and active because the Enabled element under UnitMonitor has a value of “true.”
We can look at the AlertSettings element and see that the event is configured to auto-resolve (defined as “true”). Also, the alert severity is configured to report an error.
If we look at the OperationalStates element, we can see the criteria used to determine the health state of the computer: Running is a success event, and NotRunning is an error.
The last element displayed is ServiceName, and this obviously is used to identify the Windows service that is being monitored, which is Spooler.
This very simple management pack only has a few elements defined. Larger, more complex management packs could contain hundreds of different elements.
Now that we have discussed various methods to view and dig into XML, we will now look at a simple management pack created in XML. We can use this example to provide the framework we will use to build out a management pack that extends the existing functionality provided with the SQL Server management pack provided by Microsoft. This management pack includes the object discovery information, classes, and relationships we will use within this chapter. Figure 23.25 shows this management pack within the Operations console.

The XML we used to create this management pack follows, including an explanation of the various sections:
<?xml version="1.0" encoding="utf-8"?>
<ManagementPack xmlns:xsd="http://www.w3.org/2001/XMLSchema"
                xmlns:xsl="http://www.w3.org/1999/XSL/Transform"
                ContentReadable="true">
The code above is the Schema Definition section of XML. It defines the XML schema that will be used. The management pack file uses the standard public XML schema.
<Manifest>
 <Identity>
   <ID>OpsMgr.SQL.Extension</ID>
   <Version>1.0.0.0</Version>
 </Identity>
  <Name>OpsMgr SQL Extension</Name>
  <References>
    <Reference Alias="MicrosoftSystemCenterServiceDesignerLibrary60500028">
      <ID>Microsoft.SystemCenter.ServiceDesigner.Library</ID>
      <Version>6.0.5000.0</Version>
      <PublicKeyToken>31bf3856ad364e35</PublicKeyToken>
    </Reference>
    <Reference Alias="Windows">
      <ID>Microsoft.Windows.Library</ID>
      <Version>6.0.5000.0</Version>
      <PublicKeyToken>31bf3856ad364e35</PublicKeyToken>
    </Reference>
    <Reference Alias="Performance">
      <ID>System.Performance.Library</ID>
      <Version>6.0.5000.0</Version>
      <PublicKeyToken>31bf3856ad364e35</PublicKeyToken>
    </Reference>
    <Reference Alias="Image">
      <ID>System.Image.Library</ID>
      <Version>6.0.5000.0</Version>
      <PublicKeyToken>31bf3856ad364e35</PublicKeyToken>
    </Reference>
    <Reference Alias="MicrosoftSQLServerLibrary6050000">
      <ID>Microsoft.SQLServer.Library</ID>
      <Version>6.0.5000.0</Version>
      <PublicKeyToken>31bf3856ad364e35</PublicKeyToken>
    </Reference>
    <Reference Alias="Reporting">
      <ID>Microsoft.SystemCenter.DataWarehouse.Report.Library</ID>
      <Version>6.0.5000.0</Version>
      <PublicKeyToken>31bf3856ad364e35</PublicKeyToken>
    </Reference>
    <Reference Alias="System">
      <ID>System.Library</ID>
      <Version>6.0.5000.0</Version>
      <PublicKeyToken>31bf3856ad364e35</PublicKeyToken>
    </Reference>
    <Reference Alias="SC">
      <ID>Microsoft.SystemCenter.Library</ID>
      <Version>6.0.5000.0</Version>
      <PublicKeyToken>31bf3856ad364e35</PublicKeyToken>
    </Reference>
    <Reference Alias="Health">
      <ID>System.Health.Library</ID>
      <Version>6.0.5000.0</Version>
      <PublicKeyToken>31bf3856ad364e35</PublicKeyToken>
    </Reference>
  </References>
</Manifest>
This is the Manifest section, where the management pack name is defined as well as the version (the version number should be modified when updates are made for consistency). The section also contains the references to other management packs that this management pack will use. The minimum references we recommend for all management packs are as follows:
Health
SC (System Center)
System
Performance
Windows
<TypeDefinitions>
  <EntityTypes>
    <ClassTypes>
      <ClassType ID="OpsMgr.SQL.Extension.Computer"
                 Accessibility="Public"
                 Abstract="false"
                 Base="Windows!Microsoft.Windows.ComputerRole"
                 Hosted="true"
                 Singleton="false">
      </ClassType>
    </ClassTypes>
  </EntityTypes>
</TypeDefinitions>
The TypeDefinitions section is the part of the XML code where we define and create classes. This particular example creates the OpsMgr.SQL.Extension.Computer class object, which we are basing on the Windows!Microsoft.Windows.ComputerRole role. Because we base it on that role, the class will appear under the Windows Computer role in the class list in OpsMgr.
<Monitoring>
  <Discoveries>
    <Discovery ID="OpsMgr.SQL.Extension.Discovery"
               Enabled="true"
               Target="Windows!Microsoft.Windows.Server.Computer"
               ConfirmDelivery="false"
               Remotable="true"
               Priority="Normal">
      <Category>Discovery</Category>
      <DiscoveryTypes>
        <DiscoveryClass TypeID="OpsMgr.SQL.Extension.Computer">
          <Property TypeID="System!System.Entity"
                    PropertyID="DisplayName" />
        </DiscoveryClass>
        <DiscoveryRelationship TypeID="Windows!Microsoft.Windows.ComputerHostsComputerRole" />
      </DiscoveryTypes>
      <DataSource ID="DS" TypeID="Windows!Microsoft.Windows.FilteredRegistryDiscoveryProvider">
      <ComputerName>$Target/Property[Type="Windows!Microsoft.Windows.Computer"]/NetworkName$</ComputerName>
        <RegistryAttributeDefinitions>
          <RegistryAttributeDefinition>
            <AttributeName>SQLInstalled</AttributeName>
            <Path>SOFTWAREMicrosoftMicrosoft SQL Server</Path>
            <PathType>0</PathType>
            <AttributeType>0</AttributeType>
          </RegistryAttributeDefinition>
        </RegistryAttributeDefinitions>
        <Frequency>300</Frequency>
        <ClassId>$MPElement[Name="OpsMgr.SQL.Extension.Computer"]$</ClassId>
        <InstanceSettings>
          <Settings>
            <Setting>
            <Name>$MPElement[Name="Windows!Microsoft.Windows.Computer"]/PrincipalName$</Name>
              <Value>$Target/Property[Type="Windows!Microsoft.Windows.Computer"/PrincipalName$</Value>
            </Setting>
            <Setting>
              <Name>$MPElement[Name="System!System.Entity"]/DisplayName$</Name>
              <Value>SQL Server ($Target/Property[Type="Windows!Microsoft.Windows.Computer"]/NetbiosComputerName$)</Value>
            </Setting>
          </Settings>
        </InstanceSettings>
        <Expression>
          <SimpleExpression>
            <ValueExpression>
              <XPathQuery Type="Boolean">Values/SQLInstalled</XPathQuery>
            </ValueExpression>
            <Operator>Equal</Operator>
            <ValueExpression>
              <Value Type="Boolean">true</Value>
            </ValueExpression>
          </SimpleExpression>
        </Expression>
      </DataSource>
    </Discovery>
  </Discoveries>
</Monitoring>
The Monitoring section of the management pack file contains the rules, the monitors, and all the monitoring objects in the management pack. Typically, it is a large section! In this example, we simply created a discovery rule that finds computers with SQL Server installed and adds them to our newly created class. Although the section can look rather intimidating, all we are doing here is using the XML beneath TypeID="Windows!Microsoft.Windows.FilteredRegistryDiscoveryProvider"> to locate the HKLMSOFTWAREMicrosoftMicrosoft SQL Server Registry path. If the path is found, we add the computer to the class; then we discover and populate the PrincipleName and DisplayName attributes so that the object displays correctly in the Operations console.
  <LanguagePacks>
    <LanguagePack ID="ENG"
                  IsDefault="false">
      <DisplayStrings>
        <DisplayString ElementID="OpsMgr.SQL.Extension">
          <Name>OpsMgr SQL Extension</Name>
          <Description>Provides Advanced monitoring of SQL</Description>
        </DisplayString>
        <DisplayString ElementID="OpsMgr.SQL.Extension.Computer">
          <Name>OpsMgr SQL Extension Computer</Name>
        </DisplayString>
        <DisplayString ElementID="OpsMgr.SQL.Extension.Discovery">
          <Name>OpsMgr SQL Extension Computer Discovery</Name>
        </DisplayString>
        <DisplayString ElementID="OpsMgr.SQL.Extension.Discovery"
                       SubElementID="DS">
          <Name>Registry Probe</Name>
        </DisplayString>
      </DisplayStrings>
    </LanguagePack>
  </LanguagePacks>
</ManagementPack>
The LanguagePacks section is extremely important and affects all objects created in the management pack file. When you create an object, it is given an ID within the management pack, such as our class OpsMgr.SQL.Extension.Computer. This is an appropriate ID to be called from within the management pack, but it is not very readable to the end user. The LanguagePacks section resolves this by mapping a user friendly DisplayString for every object in the management pack. Remember, whenever you create an object in the management pack, whether it be a monitor, a rule, or a class, it will need a corresponding entry in the LanguagePacks section. This section also contains all product knowledge—although we recommend you add this level of detail using the Operations console, not directly in XML, as this is easier to do in the Operations console.
Now that you have seen an example of how the internals of XML are used within Operations Manager 2007, we will discuss additional options that are either currently available or will soon be available for creating management packs in Operations Manager 2007.
Microsoft has developed a separate Authoring console, which is in release candidate (RC) status as we are finishing this book. The RC version of the Authoring console is available for download on the Microsoft Connect website (http://connect.microsoft.com). After its release, the Authoring console should be available for download at http://technet.microsoft.com/en-us/opsmgr/bb498232.aspx. The Authoring console will require Operations Manager 2007 Service Pack (SP) 1.
The Operations Manager Authoring console will provide easier-to-use functionality than XML to write management packs, and it will extend the ability to write management packs without creating them using XML. The Authoring console is a separate program from the Operations console (which is available on the Start menu -> Programs -> System Center Operations Manager 2007 folder).
The Authoring console has a similar look and feel to the Operations console, and provides visibility into areas not accessible from the Operations console. We will look at three of these:
Figure 23.26 shows the ability to add to the classes included with the Windows Server 2003 management pack.
The Authoring console also provides the ability to display and add relationship information within the management pack (see Figure 23.27).
A third area in the console, which otherwise can only be manipulated using XML, is object discoveries. Although you can review object discoveries with the Operations console, you are not able to create them. As you see in Figure 23.28, the ability to create discoveries is functionality available with the RC version of the Authoring console.


Based on the current capabilities of the Operations Manager Authoring console, it appears that the majority of the requirements for using XML to create management packs will no longer be necessary once Microsoft fully supports this utility.
We will now use the Authoring console to create a custom management pack. The management pack’s functionality includes defining a new OpsMgr class, based on discovering computers with a certain Registry key. The Authoring console includes a wizard that will help us create the basic building blocks of the management pack.
The subject of this particular management pack is Microsoft Forefront Client Security (FCS). We can discover computers running FCS by examining their Registry. Therefore, before we begin, we determine what Registry key we will use to discover the presence of the FCS anti-malware (AM) application on a computer. We have determined we will look for the following key:
HKEY_LOCAL_MACHINESOFTWAREMicrosoftMicrosoft ForefrontClient Security1.0AM
Now we launch the wizard by selecting File -> New. Here are the steps we followed to create the management pack:
At the Select a management pack template page, you can select either Empty Management Pack or Windows Application (Registry). We selected the Registry type and typed the management pack name Microsoft.Forefront.ClientSecurity. Management pack dotted names cannot contain spaces. Click Next.
At the General page, enter the (friendly) display name and description. The display name can contain spaces. We entered the name Forefront Client Security. Click Next.
On the Windows Application page, enter in the ID field of the class name that you assign to this management pack. We used the name Microsoft.Forefront.ClientSecurity.Custom for the ID and the name used in step 2 for the Display Name field. Click Next to continue.
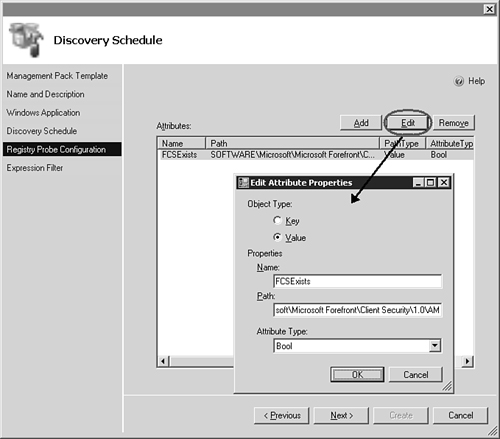
At the Registry Probe Configuration page, click the Add button. We selected the key attribute type and used FcsExists for the attribute name. (The attribute name is a label you select to represent a true or false value, which indicates whether or not the Registry key exists.)
We are looking for the presence of the key at this path: SOFTWAREMicrosoftMicrosoft ForefrontClient Security1.0AM (omit the leading HKEY_LOCAL_MACHINE part of the Registry path). This is the Boolean attribute type (the value will be true or false). Figure 23.29 shows the properties of the attribute on the Registry Probe Configuration page of the wizard. Click Next.
Build the expression to filter the Parameter name setting Values/FCSExists, the Operator setting Equals, and the Value setting true. The format of the expression will always be the string Value/ followed by the attribute name. This parameter lets OpsMgr know how to map discovered data to a class instance. Now click Create.
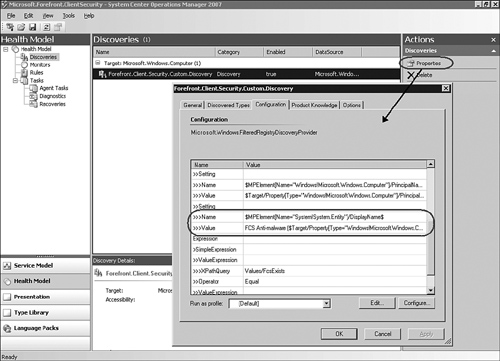
Next, populate the DiscoveryTypes section with a DiscoveryClass section to define the classes and relationships that cay be discovered by the Discovery. Open the Properties of the discovery rule in the Authoring -> Management Pack Objects -> Object Discoveries node. On the Discovery Types tab, associate the Forefront.Client.Security.Custom class with this discovery, and specify that a hosting relationship exists with the Microsoft Windows Computer HostsLocalApplication type ID. Press OK.
Save the management pack as an XML file in the Authoring console. Import the management pack into the OpsMgr management group using the Operations console; navigate to Administration -> Management Packs and run the Import Management Pack task.
Now, check to see if the management pack correctly discovered computers in the management group with FCS installed. Wait a few minutes and then navigate to the Monitoring -> Discovered Inventory view.
Click the Change target type... action in the State Actions pane. Find the new class listed in the Target and Management Pack columns. In our case, this is Forefront Client Security. Click OK.
Within a few minutes, you should see listed in the Results pane all the instances of the new class discovered in the management group. We correctly observed that all the computers with FCS installed appear in the console. They appear unmonitored because we have not yet defined any monitors. Figure 23.30 is our view of the newly discovered objects, also known as class instances, and in this case they represent computers where FCS AM is installed.

We have now created and tested a basic custom management pack. After importing the unsealed management pack into the management group, you can create views, rules, monitors, and other OpsMgr features in the Authoring space of the Operations console. A big value-add for the Authoring console is that it created valid manifest, language pack, class definition, display strings, and discovery logic. Most critically, we have also defined a new class that we can target rules and monitors against throughout the Operations console.
We performed one additional customization to the management pack (in XML) that is not yet possible in the RC version of the Authoring console. A manual XML addition appears in the Non-Key properties (optional) section of the Discovery Mapper tab in the configuration of the discovery. See this entry highlighted in Figure 23.31. We added another setting to the InstanceSettings that defines the display name to use for objects discovered in the class. Our setting is FCS Anti-malware (<NetBIOS Computer Name>).
After each time you save the XML file in the Authoring console, manually open the XML file in Notepad or your XML editor and increment the version number. This lets you quickly import (slipstream) the updated management pack into your test management group. Because the management pack is unsealed, you can also use the Authoring space of the Operations console to edit the XML directly, although this does not preserve a versioning trail for rollback purposes.
To deliver a simple but functional management pack, we used the Authoring console to create a new Unit monitor, of the Basic Service Monitor type (the same monitor type we previously created to monitor McAfee), targeting the Forefront Client Security class. This monitor will allow the management pack to display a meaningful health state in the Monitoring space. The monitor will confirm that the FCSAM service is running on customer computers with FCS client software installed. If the service is running, the state of the monitor is healthy. The monitor will generate alerts when the service is not running.
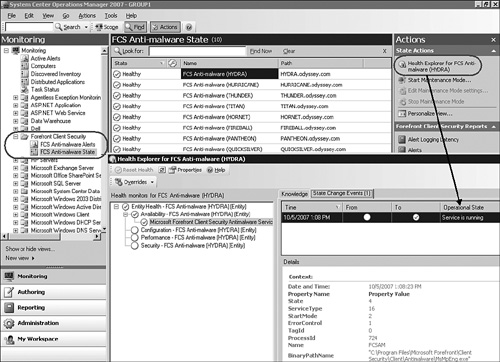
To add that functionality, we created a new view folder in the Monitoring space named Forefront Client Security and saved the folder to our new custom management pack. Then we created new State and Alert view folders targeted to the Forefront Client Security class. The State view populated with the computers as expected. Stop and start tests of the service confirmed the health monitor and alerting action were working. See the State view and Health Explorer for the monitor in Figure 23.32.
The resultant custom management pack we created in this section is on the CD accompanying this book; the filename is Microsoft.Forefront.ClientSecurity.xml. It would be instructive to open that file in Notepad, Internet Explorer, or with an XML editor, after having read this section of the chapter to observe the XML components we discussed.
Silect Software’s MP Studio product provides a third-party solution to assist with management packs in Operations Manager 2007. MP Studio provides version control (check-in, check-out), backup, and auditing capabilities. MP Studio requires a system running Windows XP, Windows Vista, or Windows Server 2003, and a backend database of either SQL Server 2000 or SQL Server 2005 (MSDE or SQL Server 2005 Express Edition will work as well).
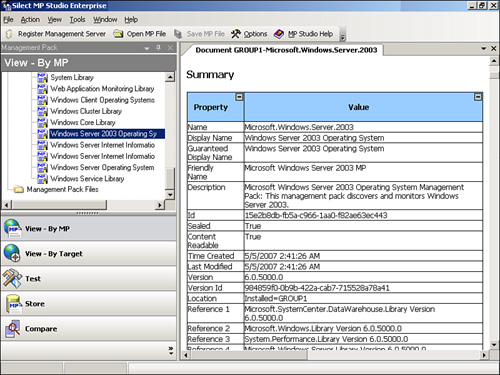
One of the features of MP Studio is a graphically driven layout for the management packs. We show this in Figure 23.33, displaying the layout for the Windows Server 2003 management pack (to see this view, right-click the management pack on the left side of this screen and choose View Reference Tree).

Some very nice features of the MP Studio include its ability to compare multiple copies of a management pack to a single standard or master copy, as well as its ability to list out the rules in a management pack, test a management pack, and to document management packs (shown in Figure 23.34). To document a management pack, right-click the management pack on the left side of the screen and choose Document Management Pack.
The screenshots shown in this chapter are from MP Studio 2007 SP 1 and Beta 1 for MP Studio 2007 R2. Silect’s MP Studio 2007 R2 adds more capabilities around testing management packs and includes a wizard-driven approach for creating simple management packs. Silect released the production version of MP Studio 2007 R2 in mid-November 2007.
Using the wizard allows you to easily gather performance and event information and generate alerts based on the information gathered. To create a management pack using the wizard, open MP Studio under the View by Management Pack section. Now perform the following steps:
Create a management pack folder (point it to the directory where Operations Manager is installed). Then right-click this folder and choose the Create New Management Pack option. This starts the wizard with a typical welcome screen, and then continues to the dialog box titled Specify the manifest information for your new MP. Here you can configure the manifest as shown in Figure 23.35.
On the Manifest screen (shown in Figure 23.35), we specify the name of the management pack, the version number, the friendly name, and the description for the management pack. Click Next to continue.
Next, we specify where we will target the management pack (see Figure 23.36).
Targets are added using the Add Target(s) button visible in Figure 23.36. For our example, we have chosen Microsoft.Windows.OperatingSystem to be the target of our management pack. After choosing the target(s), click Next to continue.
We now specify performance information that we want to gather as part of the management pack. This is added by choosing the target, object, counter, and instance of the performance counter we want to gather (shown in Figure 23.37 in the Counter column, using % Processor as our sample counter).
Then we specify the name, display name, and description for the counter. Multiple counters can be added and performance data can be found through browsing to different monitored computers. Click Next to continue.
Event information can also be gathered using the screen we show in Figure 23.38, which specifies an event from the System Event log related to system startup. Different event logs can be chosen, and events can be found by browsing to different systems. Click Next to continue.
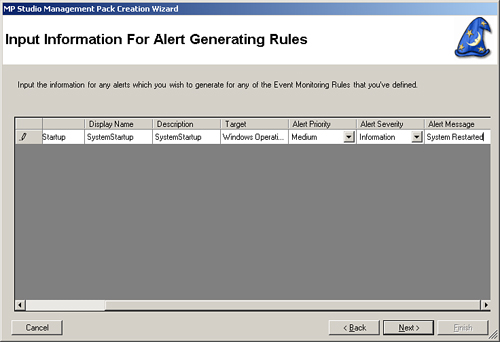
Now that we have specified the performance and event information, we can configure any alerts that need to be generated based on what we discover with this information. For our example (shown in Figure 23.39), restarting a system creates an event that is logged to the System Event log; when this event is found, the management pack will create an information alert in OpsMgr. Click Next to continue.
Once we have finished configuring the management pack, we are asked to confirm and finish the process. This creates the management pack in MP Studio.


Information on Silect and MP Studio is available on Silect’s website at http://www.silect.com. The MP Studio product is also available as a trial version, which is available for download at http://www.silect.com/products/product_info.php.
So far, this chapter has investigated the steps required to create management pack objects and bring them together into simple management packs. We have explored technologies to create management packs and their objects and have shown different options planned to be available for management pack development. A major part of a management pack is its reports. The next part of this chapter discusses report development with Operations Manager 2007.
Operations Manager 2007 includes a variety of options for creating reports. These approaches include the following:
Building reports for My Workspace in the Operations console
Publishing reports (new with SP 1)
Creating linked reports
Using Visual Studio to create reports
Before we discuss how to develop a report, we should mention that sometimes it is often quicker and easier to view results by using the Monitoring section of the Operations console! If the information you are looking for is available as a performance counter and the time in which you need to track it is less than the grooming interval of your Operations Manager environment (7 days by default), then a performance-monitoring view will work well.
Let’s take an example where we want to provide a view of the free disk space on systems over a 2-day period of time. Perform the following steps to create a simple view of the data:
Open the Operations console and navigate to Monitoring -> Microsoft Windows Server -> Performance -> Disk Capacity.
On the Actions pane under Performance Actions is the option Select time range.... Selecting a time range provides the ability to change the view to show data from a specific start and end time, or you can select a time range in minute, hours, or days.
For this example, we configured the view to show data over a 2-day period for the Hurricane and Quicksilver servers. Alternatively, we could specify how long the graph should show data by clicking the Select Time Range option, shown in Figure 23.40.
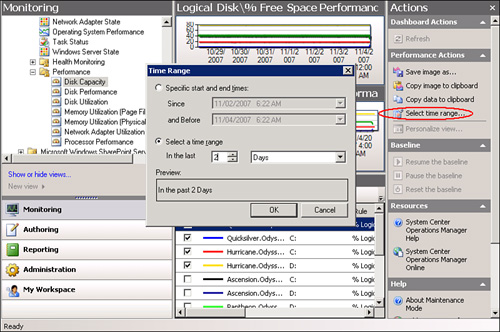
Figure 23.41 displays Logical Disk performance graphs for the two servers, using the time range of 9/23/2007 through 9/24/2007.

Note: Viewing Older Data in the Operations Console
Remember, your capability to set a date range for viewing data older than 7 days depends on the grooming thresholds set for the Operational database. We discuss database grooming in Chapter 12.
Although we can create a graph showing free space over the short term, we also want to be able to see trending of available free disk space over a longer period than available with the Monitoring space of the Operations console. Our next step is to create a report that will provide this information. The Reporting space in the Operations console draws its data from the Data Warehouse database, which by default retains the majority of its data for 400 days (13 months, so that trending can be done over a 1-year period). To create this report, we will take the following steps:
Open the Operations console. Navigate to Reports -> Microsoft Generic Report Library -> Performance. Then double-click to open the Performance report.
Set the date to Yesterday as a starting date.
Click Change to configure the report.
Click the New Chart button and add the chart title.
On the Settings screen, click the New Series button (highlighted in Figure 23.42) and then click the Add Object button.
At the Add Object screen, type C: in the field next to Object Name with the Contains dropdown box.
Select the first server on the list that you want to report on (shown in Figure 23.43) and click OK.
Back at the Settings screen, click New Series and then click Add Object....
Specify the drive to include for the object. We selected D: because we will be reporting on the D: drive’s free space on the server.
Add the next server on the list and click OK.
Repeat steps 8–10 until all servers and drives required for the report are added, as shown in Figure 23.44.
Now, click the first of the series shown in the chart and click the Browse button at the right side of Figure 23.44, to the left of the Rule selection.
At the Select rule screen, choose Search by Counter.
Choose the Performance object LogicalDisk and set Counter to % Free Space. Then click Search.
Add % Logical Disk Free Space, as shown in Figure 23.45, and click OK.
Choose the specific instance for the rule to match the drive on which you are reporting.
Perform the same action for the remaining counters. The objects should now be matched to the appropriate instances, as shown in Figure 23.46. Click OK when complete.
Now click the Run button to run the report and validate that it runs correctly. Once it runs correctly, update the start date of the report (go to View -> Parameters to change this setting).
Select File -> Save to Favorites to make the report accessible after it is configured.


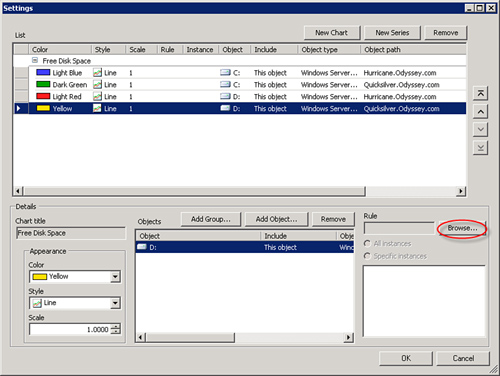


Figure 23.47 shows the output from the report.

With the release of Operations Manager 2007 SP 1, Microsoft provides new functionality allowing you to publish reports. Published reports are prerendered reports with preselected parameters. These parameters allow the reports to run without requiring input. When this type of report is created, it first appears in the Operations console -> Reporting -> Authored Reports section.
To publish a report, run the report and then choose the File -> Publish option, as shown in Figure 23.48 (if you do not see the Publish option listed, your environment most likely does not have OpsMgr 2007 SP 1 installed).

Although this report is now published, only the user who created the report can see it. To make this report available to all users, we will create a new folder for the report and add the RPDL file (also known as a RDL file) created when we published our report. Perform the following steps:
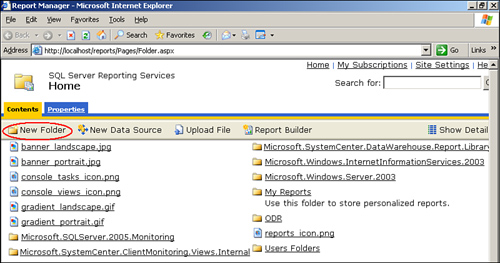
Browse to the Reporting Server (http://localhost/reports on the local system or http://<servername>/reports if it is a remote system) and create a new folder (see Figure 23.49), which we will name Published Reports.
The report that we published is initially stored under the My Reports folder (circled in Figure 23.50).
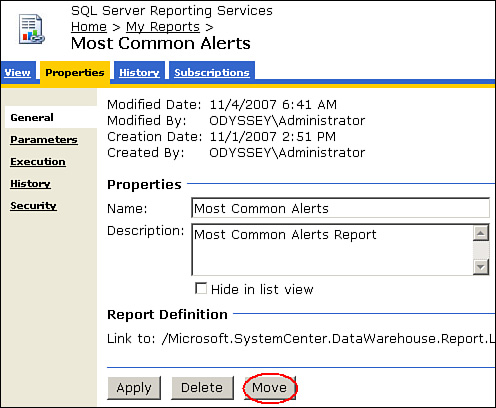
We want to move this report to the Published Reports folder. To do this, open the My Reports Folder, open the report, and select the Properties tab, as shown in Figure 23.51. Click the Move button (circled in Figure 23.51).
Now, we need to select the folder we created earlier (Published Reports), as highlighted in Figure 23.52. Click OK to continue.
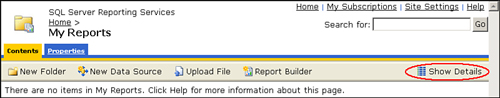
We now need to move the RPDL file to the correct location. Go back to the My Reports folder and click Show Details (see Figure 23.53).
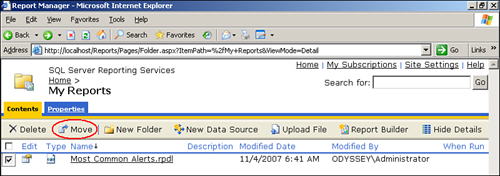
Once the details are visible, you can see the Most Common Alerts.rpdl file, which we need to move. To do this, check the box on the first column of that line and select the Move icon, as shown in Figure 23.54.
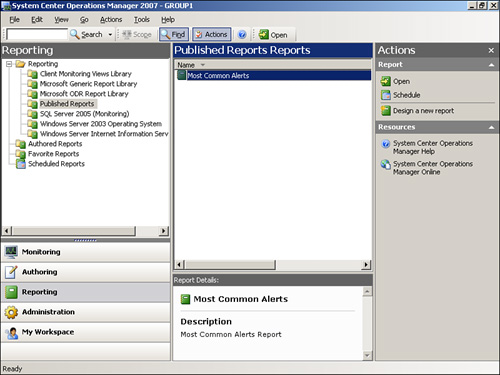
Select the Published Reports folder, as we did when we moved the report in Figure 23.52. Click OK to continue. The new folder (Published Reports) that we created is visible within the Operations console in the Reporting space under Reporting -> Published Reports (see Figure 23.55). Because our folder and report are under the Reporting structure in the console (not Authored Reports or Favorite Reports), they are now visible to other users of Operations Manager!


The linked report capability allows you to create a linked copy of a report and then customize the parameters to suit a particular function. You can use linked reports to provide a custom report for any performance counter OpsMgr collects. A linked report is only a pointer to an existing report, but it can pass different parameters and results for each user in a separate report with its own name. Linked reports are shortcuts to existing reports.
OpsMgr 2007 uses linked reports extensively. You can generate linked reports quickly (without affecting the original report) and integrate them into Operations Manager, just like other customized reports. However, there are several restrictions when using linked reports:
A linked report cannot provide reports on non-performance-counter-related information.
You cannot export and import a linked report into another OpsMgr management group; it has to be manually re-created.
Linked reports do not have the flexibility often required when building custom reports in OpsMgr.
Linked reports are created using SQL Reporting Services or XML. To best understand how linked reports work, this chapter will look at the XML. Of course, many OpsMgr administrators are not XML coders, so we include this information primarily for reference. Another reason for discussing the XML is if you include the report information in the XML, you can import the report as part of a management pack into another management group or environment!
In an XML document, you first define linked reports in the Reporting section. The XML for a linked report definition would look something like this:
<Reporting>
  <LinkedReports>
    <Linked Report ID="Custom.Linked.Report" Accessibility="Public"Visible="true"
                   <Base="Reporting!Microsoft.SystemCenter.DataWarehouse.Report.Availability">
      <ParameterBlock columns="4" xmins=http://schema.microsoft.com/mom/reporting/2007/ReportParameterSettings">
         <Controls>...
      </ParameterBlock>
    </Linked Report>
  </LinkedReports>
</Reporting>
Notice the <base> tag, which is specific to a linked report. Base tells us which report this is a shortcut to. In this case, it is a generic availability report, although you can use any publicly defined report from any management pack.
The XML also includes a reference to the management pack including the original generic report. You may recall that the “XML and Management Pack Creation” section of this chapter introduced the References section of an XML document. That particular example included the Microsoft.SystemCenter.DataWarehouse.Report.Library section. We need that library (management pack) referenced to include reports in our management pack because it contains the original report. We are referencing version 6.0.6246 of this MP, which is the version current with the RC 0 version of OpsMgr 2007 SP 1.
</Reference>
 <Reference Alias="Reporting">
  <ID>Microsoft.SystemCenter.DataWarehouse.Report.Library<ID>
  <Version>6.0.6246.0</Version>
  <PublicKeyToken>...</PublicKeyToken>
 </Reference>
</References>
We use the <LanguagePacks> section to specify the management pack and report display name.
<LanguagePacks>
  <LanguagePack ID="ENG" IsDefault="false">
    <DisplayStrings>
      <DisplayString ElementID="Custom.CustomLinkedReport">
        <Name>Custom Linked Report</Name>
        <Description>Example of a Custom Linked Report</Description>
      </DisplayString>
      <DisplayString ElementID="Custom Reporting">
        <Name>Custom Linked Reports</Name>
      </DisplayString>
    </DisplayStrings>
  </LanguagePack>
</LanguagePacks>
This XML code is just to establish the environment for the report itself. Because our linked report is based on the Availability Report, we are going to define a linked report based on the existing report.
The report will preselect data aggregation, the time range, and the required downtime values. We are defining Availability using the System.State.EntityHealth monitor, with states of Warning (2) and UnMonitored (3) as downtime. We will aggregate daily, and we will calculate based on availability during business hours.
We suggest you use an XML editor such as XML Notepad to view and edit your code, which we introduced in the “Digging Deeper into XML” section of this chapter. An editor designed for XML makes it much easier to see the sections of the document.
In the Parameters section of the XML file, you will want to add the following information (using an editor tailored for XML will make this much easier to locate and edit):
Default the
DataAggregationparameter to Daily:<LINELENGTH>90</LINELENGTH><Parameter Name="DataAggregation"><Value>1</Value></Parameter>Update the
DownTimeparameter for values of 2 or 3:<LINELENGTH>90</LINELENGTH><Parameter Name="DownTime"><Value>2</Value><Value>3</Value></Parameter>Enable reporting during business hours only by adding the
TimeTypeparameter:<LINELENGTH>90</LINELENGTH><Parameter Name="TimeType"><Value>Business</Value></Parameter>
Add the System.Health.EntityState monitor to calculate availability:
<LINELENGTH>90</LINELENGTH><Parameter Name="MonitorName"><Value>System.Health.EntityState</Value></Parameter>You will also want to define the business hours as being between 8 a.m. and 5 p.m., Monday through Friday, with a default report range from Friday of the previous week to today. The following XML code accomplishes this:
<LINELENGTH>90</LINELENGTH><Parameter Name="StartDate_BaseType"><Value>Friday</Value></Parameter> <Parameter Name="StartDate_OffsetType"><Value>Week</Value></Parameter> <Parameter Name="StartDate_OffsetValue"><Value>-1</Value></Parameter> <Parameter Name="EndDate_BaseType"><Value>Today</Value></Parameter> <Parameter Name="EndDate_OffsetType"><Value>None</Value></Parameter> <Parameter Name="EndDate_OffsetValue"><Value>0</Value></Parameter> <Parameter Name="TimeType"><Value>Business</Value></Parameter> <Parameter Name="StartDate_BaseValue"><Value>11/13/2007 08:00:00 AM</Value></Parameter> <Parameter Name="EndDate_BaseValue"><Value>11/13/2007 5:00:00 PM</Value></Parameter> <Parameter Name="TimeWeekMap"><Value>Monday</Value><Value>Tuesday</Value><Value>Wednesday</Value><Value>Thursday</Value><Value>Friday</Value></Parameter>
That’s it! It did seem like a lot of effort. You can now save the XML file and import it into OpsMgr. If you open the Reporting space of the Operations console, the imported folder and report should be visible.
Now that you are becoming an expert at navigating through the Reporting space of the Operations console, you probably have noticed the Authored Reports section, which we referred to in the “Publishing Reports” section of this chapter. This is where you can add your own custom reports, augment reports supplied out of the box, and store any management packs you may have imported.
For MOM 2005, which used SQL Server 2000 Reporting Services technology, creating new reports was a completely manual process using Visual Studio. One of the best (and certainly easiest) ways to create a report was to copy an existing report and simply modify the areas you needed to change.
With OpsMgr 2007, this is no longer the case. OpsMgr 2007 uses the newer SQL Server Reporting Services 2005. This updated version of Reporting Services allows you to use report models, which are metadata descriptions of a data source and contain all the relationships that exist within that data source. In real terms, this means that a report model contains the information you need to help you select the correct items to add to a report.
Using a report model along with the Report Builder (another SQL Reporting Services 2005 and Visual Studio feature) makes the process for creating a custom report painless, simple, and fast. To make the process even easier, OpsMgr comes packaged with a number of predefined report models. The report models already contain the most commonly used objects.
This section will discuss the process for creating a basic report using the OpsMgr report models and the Report Builder.
The first process in authoring a report is to ensure you have Visual Studio installed. For ease of use, we recommend that you create the reports from an OpsMgr management server, because the required tools are installed with the OpsMgr product. If this is not appropriate, you will need to install Visual Studio 2005 (Service Pack 1 is recommended) and the Business Intelligence components. These components install with the client components of SQL Server 2005 Reporting Services; install them by running SQL 2005 Setup (or the SQL Server Express edition with advanced services, available at http://msdn2.microsoft.com/en-us/express/aa718379.aspx) and selecting the Client Components installation.
To create a report model, perform the following steps:
Open Visual Studio by selecting Start -> Programs –> Microsoft Visual Studio 2005 –> Microsoft Visual Studio 2005.
Select File –> New –> Project to create a new Visual Studio Project file.
From the dialog box, select Report Model Project, input a name and a location for the file, and click OK. We will save the file in My Documents and we will call the project Example OpsMgr Report Model. Figure 23.56 shows the dialog box.
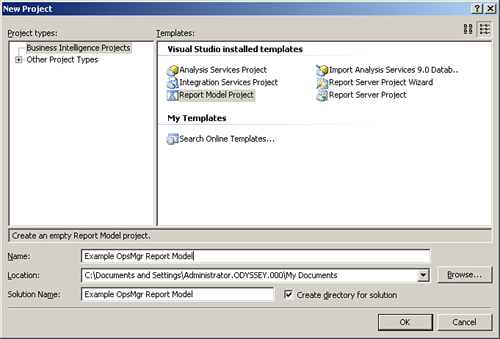
The next part of this process is to create a data source. Perform the following steps:
In the Solution Explorer pane, right-click Data Sources and select Add New Data Source. This starts the wizard. Click Next on the welcome screen.
On the next screen, click New. You will see the screen shown in Figure 23.57. Here you need to enter the connection information for SQL Server, which is the Fully Qualified Domain Name of your SQL Server and the database you will use. In our example, the server name is Quicksilver.Odyssey.com and our database is the Data Warehouse database, which is OperationsManagerDW by default.
You can click the Test Connection button at this point to verify the information you entered is correct.
Click OK and then Finish, which completes creating the data source.

Now that we have a data source, which is a connection to the database, we need to create a data source view. The data source view is where we choose what data we will view from the database. Follow these steps:
From the Visual Studio Solution Explorer pane on the left side of Figure 23.58, right-click Data Source Views and then select Add New Data Source View.
Selecting the option to create a new data source view opens the Data Source View Wizard. Start by clicking Next at the Welcome screen.
The following screen is where we select the data source to use to connect to the database. Because we have only created one data source, this selection will not be difficult. Select the data source you created earlier in the “Creating a Data Source” section of this chapter. Click Next to continue.
You will proceed to the Select Tables and Views screen shown in Figure 23.59. From here, you need to select the tables and/or views you want to include in the report model. For this example, we will choose Alert.Alert_<GUID> table, which is the table that contains all alert data.
Click Next and then click Finish to complete the wizard and create the data source view.


Now that we have created the data sources, we will create the actual model itself with the following steps:
Right-click Report Models from the Solution Explorer and then select Add New Report Model. Click Next to advance past the Welcome screen.
On the next screen, select the data source view we previously created and click Next to continue.
The subsequent screen is where you configure the report model generation rules. Leave the settings at the default and click Next to continue.
On the next screen, click Update model statistics before generating and then click Next.
Click Finish on the Completing the Wizard screen to generate the report model. This screen is shown in Figure 23.60.

Finally, we must deploy the report model to the Reporting Server. Right-click the model file we just created from the Solution Explorer and select Deploy. Check for errors and look for the status message at the bottom of the screen for verification that the deployment was successful. The status is in the bottom left corner and is circled in Figure 23.61.

After creating the report model, we can create a report to display the data. The next steps document the creation of a basic alert report:
Open the Operations console and navigate to the Reporting space.
Highlight Authored Reports on the left side of the screen, and under the Actions section, select Design a new report (circled in Figure 23.62).
If this is the first time you have selected this action, you may get a security warning, generated by the Report Builder. It is safe to click Run. The Report Builder will then download and run.
After the Report Builder loads, you will see the Report Builder model we just created displayed on the right side of the screen. We will use the radio buttons circled at the bottom right of Figure 23.63 to select the display method for the report we will be creating. For this example, we will select Table. Click OK to create the empty report.
Once you select the report model and display type and click OK, the screen shown in Figure 23.64 is displayed. This is where we actually create the report.
We will create a basic report that returns all alerts that indicated a HealthService failure. First, we will select the Click to add title box and enter HealthService Failure Alerts as the title.
Next, we need to add some data. First, we will add the Alert Name column. Locate it in the Fields section on the left side and drag it into the empty table on the right side. Your screen should now look like the one shown in Figure 23.65.
In Figure 23.65, we have also decreased the size of the column. This allows us to add some more columns without moving off the page.
Now, we will add more columns: Alert Description, and Raised Date and Time. Resize as necessary. You should see something similar to the image displayed in Figure 23.66.
Our next step is to limit the report to display the Health Service failure alerts. To do this, click the Filter button located on the toolbar at the top Figure 23.66 (and circled in Figure 23.67) to proceed to the screen shown in Figure 23.68.
From the Filter Data screen, find the Alert Name field and drag it to the main pane in the middle of the screen. This adds the filter and allows you to specify the settings for the filter.
We will select Alert Name, equals, Health Service Heartbeat Failure. Click OK to apply the filter.
We now need to verify that the report runs properly. Click the Run Report button and wait to see if the report runs correctly. In our example, we also removed the two fields at the bottom of the report displaying the totals. This makes the report appear cleaner, but it’s a matter of choice. We also added a new text box with Odyssey Example Report in it, again for cosmetic reasons.
If the report runs correctly and you have valid alert data in your system, you should see a report similar to the one shown in Figure 23.69.
Save the report so you can access it later. Click the Save button and browse to a location to save the report in the local Reporting Services report store. We recommend saving it in the My Reports folder. We named our report HealthService Failure Report.
After saving the report, you can run it from the Reporting pane in the Operations console in the Authored Reports folder! Figure 23.70 shows the report listed in that folder.
Running the report should give output such as displayed in Figure 23.71.
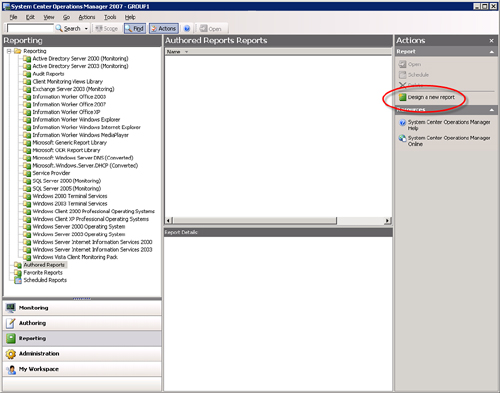


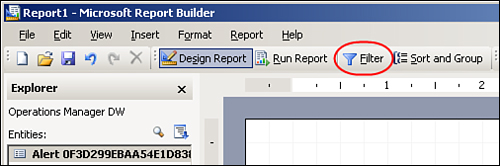

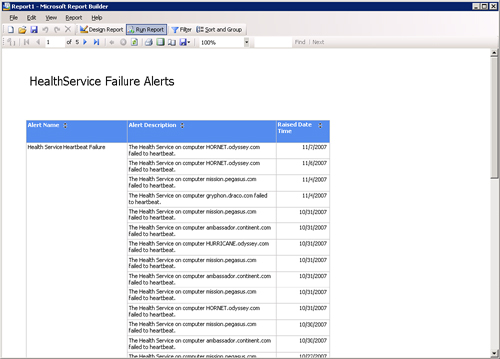

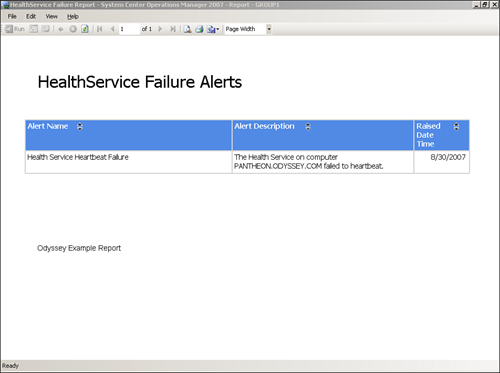
You could make this report available to other users by following the procedure we discussed in the “Publishing Reports” section of this chapter.
How do you schedule reports for delivery in OpsMgr? Let’s start with a simple built-in report—the Most Common Alerts report. This report is available under Reporting -> Microsoft ODR Report Library -> Most Common Alerts. (There is also a report with this name in the Microsoft Generic Report Library. The version in the ODR folder is preconfigured with a 7-day date range.) We will start by generating report output to a file share, and we will follow that process by sending the report via email.
Perform the following steps to deliver the report to a file share:
Before running the report, create a share (preferably on the Reporting Server) with permissions that allow the user to create files on it and other users to read the contents of the directory. For our Odyssey environment, this is \Quicksilver eports.
Right-click the report in the Reporting space and select Schedule to bring up the Subscribe to a Report dialog box.
For the description, we will give the name of the report and the parameter information that is important to the report. For this example, we will name it Most Common Alerts per Week.
Under the Delivery Method dropdown menu, there should be at least two options available:
Report Server File Share
Null Delivery Provider
Choose the Report Server File Share option.
Choosing to deliver to a share expands the Delivery Settings screen by adding a Settings section. Specify the settings for File name (including its extension), File Extension (check box), Path, Render Format, User name (DomainUsername format), Password, and Write mode (Autoincrement or Overwrite) to write to the share.
Now that we have created the schedule, what actually makes the report run? In the background, the SQL Server Agent now lists a new job (with a GUID for a name, lots of fun to track those down!) that runs the scheduled report we created. By default, notifications are written to the Application Event log if the job fails.
To determine what subscriptions we have, you can look in the Reporting space of the Operations console. Select Scheduled Reports on the Reporting pane on the left side for the list and status of scheduled reports in the middle section of the console. The Actions section allows you to open, edit, or cancel the various schedules. If any issues occurred when the subscription ran, they will appear on this page.
Once the job runs, there should be a file in the directory specified in step 1 of the preceding list (\Quicksilver eports in our example).
Now that we have delivered a report to a file share, we also want to send it using email. Perform the following steps:
Tip: Configuring the Report Server to Send Reports via Email
If you want to deliver reports by email but this is not a listed delivery method (in the Subscribe to a Report -> Delivery Settings section), the problem may be that the Sender Address and SMTP Server are not specified in the Reporting Services Configuration tool. Duncan McAllyn points this out at http://www.mcalynn.com/2007/08/email-not-an-option-in-your-opsmgr-reporting-delivery-methods-read-this/.
For this example, we will configure a daily email on the Most Common Alerts report. With the E-Mail option available on the list (Report Server E-Mail), we can now configure it with a description and an email delivery method.
The settings for the delivery method include to whom we are going to email it, how often to generate the report (once, hourly, daily, weekly, monthly), and when the subscription is effective.
You will also specify how to render the report. We recommend using the PDF format when send the report via email because this is the most readable format.
We now specify the parameters to use with our subscription. In our example, we will update the Start Date to be Yesterday, and select Finish. Let the report run and validate that it works.
The resultant email includes a link to the report, allowing direct access to the report via the Reporting Server.
The ability to schedule the delivery of reports is a definite benefit of deploying OpsMgr 2007.
We have discussed the concept of custom reports and report models. We covered the steps to create a custom report model and deploy it to the Reporting Server. We also covered the process for creating a new custom report using Visual Studio 2005 and the new Report Builder installed with OpsMgr, and we wrapped up with a discussion on how to schedule reports in OpsMgr.
We will now tie together many of the concepts discussed in this chapter to create a sample management pack.
Because MOM 2005 did not include counters to track the size of the MOM databases (and logs), there was no trending information for proactively planning the size of the databases. Operations Manager 2007 includes three of the four major counters required to do this (DB Size, DB Free Space %, Log Free Space %), but without the actual log file size the ability to trend off of this information is incomplete.
The OpsMgr GetSQL2005DBSpace.js script gathers the first three performance counters. We reviewed this script and found that as it was part of a sealed management pack, limiting our ability to alter it; therefore, we thought about this from the perspective of what we created with our Microsoft Operations Manager 2005 Unleashed book.
In that book, we developed scripts to generate database tables to store the information we wanted to gather. We next created a script that updated the data in those tables and pulled the information into performance counters in MOM 2005. The end result was a series of custom performance counters available in MOM, actually generated from values stored in a SQL database.
To provide similar functionality for Operations Manager 2007, we created a management pack called OpsMgr Database Tracking using the steps we discussed earlier in the “Creating and Deleting Management Packs” section. Within the management pack, we created four rules based on the information discussed in the “Creating Rules” section of this chapter. These four rules are part of the SQL DB Engine class, as shown in Figure 23.72.
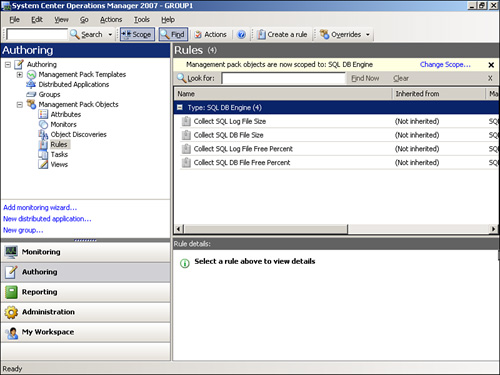
We also created four VBScripts, named scriptSQLLogSize.vbs, SQLDBSize.vbs script, SQLLogUsedPercent.vbs script, and SQLDBUsedPercent.vbs script. These scripts are used by the rules we defined. Figure 23.73 shows a portion of the SQLLogSize.vbs script in the Script tab of the Collect SQL Log File Size rule.

Each script gathers information from customized SQL tables, translating that information into performance counters defined on the Performance Mapper tab of the rule, as displayed in Figure 23.74.

The Performance Mapper tab defines the object, counters, instance, and value for the counter that will be created. To understand how this works, we need to see the code that is actually sending information back to the Performance Mapper tab. The following code is what is included within the Collect SQL Log File Size rule’s Script tab. The Performance Mapper tab defines the name of the object (SQLLogData), defines the name of the counter within the object (TotalSize), maps the instance to the DatabaseName (shown in bold), and maps the value to the LogSizeData (also displayed in bold).
' GET LOG FILE SIZE FROM MOMTracking_LogUsageInfo TABLE
Dim Connection
Dim results
Dim intLoop
Dim intData
Dim strDBName
Dim objArgs
Dim objPBag
Dim objOpsMgrAPI
Set Connection=createobject("ADODB.Connection")
Set objArgs = WScript.Arguments
Connection.Open "Provider=sqloledb;Data Source=localhost;Integrated Security=SSPI;Initial Catalog=Master"
'Get script parameter values from OpsMgr
strDBName = objArgs.Item(0)
Set results=Connection.execute("SELECT CONVERT(int, log_size) FROM master.dbo.MOMTracking_LogUsageInfo Where DB_Name = '" & strDBName & "'")
If results.BOF then
  Set objOpsMgrAPI = CreateObject("MOM.ScriptAPI")
  Set objPBag = objOpsMgrAPI.CreateTypedPropertyBag(2)
  objPBag.AddValue "DatabaseName", strDBName
  objPBag.AddValue "LogSizeData", 0
  objOpsMgrAPI.AddItem(objPBag)
  objOpsMgrAPI.ReturnItems
else
do until results.EOF
   For intLoop = 0 To results.Fields.Count -1
     intData = intData & results.fields(intLoop).value
   Next
  results.MoveNext
   loop
     Set objOpsMgrAPI = CreateObject("MOM.ScriptAPI")
     Set objPBag = objOpsMgrAPI.CreateTypedPropertyBag(2)
     objPBag.AddValue "DatabaseName", strDBName
     objPBag.AddValue "LogSizeData", intData
     objOpsMgrAPI.AddItem(objPBag)
     objOpsMgrAPI.ReturnItems
end if
' -- Reset Variables
Set Connection = Nothing
Set results = Nothing
Set intLoop = Nothing
Set intData = Nothing
Set strDBName = Nothing
Set objArgs = Nothing
Set objPBag = Nothing
Set objOpsMgrAPI = Nothing
The information on the Performance Mapper tab is returned via a property bag.
Tip: Property Bags
To send information to Operations Manager from a script in Operations Manager 2007, you will use a property bag, which is a virtual container that can store almost any type of value. For our custom script, we used property bags to provide the values required for the performance counters.
For more information on property bags, Pete Zerger and the crew at SystemCenterForum have written a great article that you can download from http://www.systemcenterforum.org/using-property-bags-with-custom-scripting-in-operations-manager-2007/.
When the rule runs the script, the information is passed back using the property bag and is available as a performance counter. We display examples of these performance counters in the Performance view shown Figure 23.75.

To install and configure our management pack, we performed the following steps:
To create the tables we would gather information from, we ran two SQL scripts (MonitorDatasize.sql and Monitor Logfile Size.sql). These scripts generated two stored procedures (DBAMOMLogStats and MonitorDataSize) used to gather sizing information and store the data in tables in the database.
After creating and populating these tables, we imported the XML file (named OpsMgr Database Tracking.xml before we sealed the management pack) within the Operations console in the Administration space, under Administration -> Management Packs -> Import Management Pack.
Next, we added an account with SQL rights to the Run As Profile. Navigate in the Operations console to Administration -> Security -> Run As Accounts, right-click, and choose Create Run As Account. Then add the account to the SQL Data File Collection Account. This action gives the required rights to the rules so that they have permission to run.
To activate the rules, we created overrides, which enabled each rule for a specific server on a specific database.
To do this, open the Operations console -> Authoring -> Management Pack Objects -> Rules. Then scope the Operations console to the SQL DB Engine and find the rules. Right-click each rule (one at a time) and create an override for a specific object of type SQL DB Engine. Set the enabled parameter to True, and the script arguments to the database you want to monitor (in Figure 23.76, we are targeting the OperationsManager database, although you can create another override for the OperationsManagerDW as well).
With the rules now activated, we need to schedule the information in the SQL tables to update periodically. To do this, we can create rules that run SQL scripts to call the stored procedures, or we can use the built-in SQL Server Agent job functionality. Figure 23.77 shows a SQL Server Agent job to update the information for this management pack on a daily basis. Jobs are created using SQL Server Management Studio. See Chapter 12 for the specific steps to create SQL Agent jobs.
Figure 23.78 is an example of how a stored procedure runs within the SQL Agent job.
The result of this configuration is a nightly job that updates the contents of the tables we query using the rules we previously defined.
Our final step is to set the configuration for the rules. Select the Configuration tab of the rule, edit the data source, and configure the job to run at a timeframe that will be in sync with when the data is updated in the database. Figure 23.79 shows a daily run of this rule that matches the timing we defined for running our SQL Agent job.

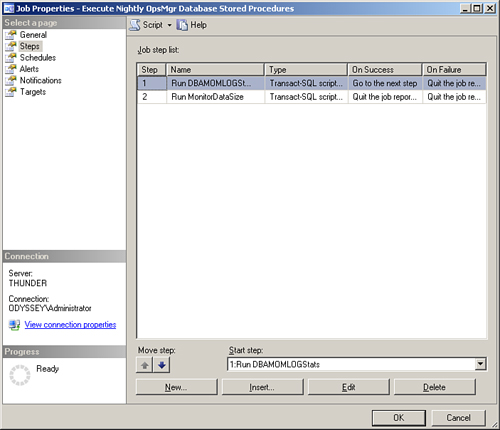
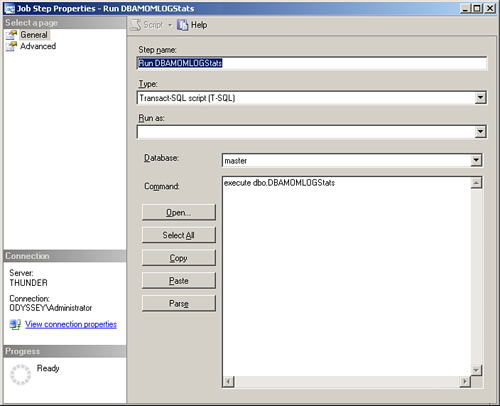

This sample management pack illustrated how we can use a variety of different techniques to develop management packs. Although this particular type of functionality is just the tip of the iceberg of what one can do using custom management packs, it shows that you can even integrate information stored in SQL Server databases with OpsMgr to provide additional functionality. In the case of the OpsMgr Database Tracking management pack, we could take the information it collects to generate regular reports showing database growth. We could also choose to generate alerts when the size, remaining free space, or rate of growth hits a specified level. Although we are now only tracking statistics for the Operational database, we can create another override to target the data warehouse.
This chapter has discussed a variety of different concepts, all with a central focus on how to develop management packs and reports for Operations Manager 2007. We discussed how to use the Operations console, XML editing, the Authoring console, and Silect MP Studio in the development process; for each we reviewed the options available and provided examples of how to use them. We discussed the four major options available when creating management packs: favorites, published reports, linked reports, and Visual Studio. Having discussed these concepts has hopefully helped you understand the capabilities of each option and sparked ideas for how to use them.
The question may remain, Which method should you use when you are writing a management pack? Like many questions in IT (Information Technology), the answer is, It depends, based on what you want to accomplish and the technique(s) you are most proficient with. Here are some examples:
You may want to create a simple management pack, in which case you could use the Operations console, the Authoring console, or the MP Studio Wizard.
You may be an ace with XML and decide to write your MP in XML and create your reports with Visual Studio.
Perhaps your requirements are best met using a variety of the different methods discussed in this chapter.
Your approach will vary based on what you are most comfortable working with and what you need to accomplish.
This chapter has shown you the available options so you can decide what makes the most sense for your own particular skill set and the requirements you are attempting to meet.
This chapter discussed the approaches you can use to create management packs and management pack objects. We discussed different methods for creating management packs. We have discussed options available for the development of reports, and we provided an example using what you have learned in the chapter to create a management pack using many of the objects and technologies discussed in this chapter. As we discussed in Chapter 20, the capabilities of Operations Manager 2007 are extremely diverse and extensive. By creating custom management packs, we can further extend the capabilities of Operations Manager and provide capabilities that may have not even been considered yet!
The remainder of this book provides supplemental material to assist in using Operations Manager 2007. Appendixes include information on implementing and tuning management packs, Registry settings, performance counters, database views, and reference URLs.