
With its newest version of Operations Manager (OpsMgr), Microsoft broadens its monitoring scope to include user workstation management, and adds new client monitoring features not present in previous versions. Although in Microsoft Operations Manager (MOM) 2000 and MOM 2005 you could add user workstations to the management group just like servers, Microsoft did not design those products for workstation management:
The monitoring features available for workstations were identical to those of servers. In other words, you could only manage a workstation as if it were a server.
You had to purchase an Operations Management License (OML) for workstations at the same price as for servers. That was a relatively costly solution—overkill even—and explains MOM’s low implementation rate for monitoring client workstations such as desktop and notebook computers.
The three new client monitoring features in System Center Operations Manager 2007 are as follows:
Agentless Exception Monitoring (AEM)—. Collecting and reporting application errors and system crashes without installing an OpsMgr Agent component.
Customer Experience Improvement Program (CEIP)—. Centrally compiling and forwarding information about Microsoft product usage; requires AEM to be enabled.
Client-specific Management Packs—. Comprehensive, tailored monitoring of OpsMgr agent-managed workstations, with optional enhanced monitoring of selected business critical workstations.
The first half of this chapter covers AEM and the CEIP; the second part discusses the Client Operating System and Information Worker management packs. Together, these new features represent a significant investment by Microsoft to extend the ways in which you can get value from OpsMgr.
Monitoring any computer, server or client, incurs costs of various types. These expenditures start with licensing management agent(s) and include the reoccurring cost of technical staffing resources to evaluate and act on generated alerts. Historically, the sheer quantity of clients compared to servers restricted the implementation of monitoring those clients.
The resources for monitoring a server are justified by the lost productivity of many or all users in an organization when a server-based application malfunctions; yet the loss of productivity from a client workstation malfunction, typically used by a single individual, is seldom noticeable. Historically, the economies did not justify proactively managing large numbers of client computers other than some non-conventional clients not used as personal workstations, such as Point of Sale (POS) devices and critical kiosks.
A number of factors have led to the increased importance of client computers in today’s business environment, including team collaboration and real-time presence applications that depend on peer-to-peer functionally between user workstations. In addition, no one can dispute that modern business practices have dramatically reduced the job functions a user can perform without using an operational workstation. Although simple disruptions, like the time spent waiting for an application to restart after a crash or the inability to connect to an email server, are a nuisance to a single user, when they occur frequently across many workstations, they can have a dramatic impact on productivity—similar or greater to that of a server outage.
The short answer is that he lost his title, and became known just as “Watson,” and now he is even losing his name and being replaced as Windows Error Reporting. In the process, the good doctor has become more useful to Microsoft and now to you.
Over fifteen years ago, Microsoft released a simple debugger application for the Windows NT 3.0 beta named Dr. Watson (drwatson.exe), taking its name from fictional medical doctor John Watson, sidekick of Sherlock Holmes, the detective created by the author Sir Arthur Conan Doyle. The icon for the Dr. Watson and Watson applications in Windows depicts a man carefully listening with a stethoscope. Like the icon representation, the point of Dr. Watson was to collect information, unobtrusively.
The initial drwatson.exe application created an on-command snapshot of the computer state when a user application hung (became non-responsive). The snapshot was stored in a user.dmp file on Windows NT systems, and sets of “WLG” and “TXT” files were created on Windows 95 or Windows 98/ME systems.
The drwtsn32.exe version of Dr. Watson replaced drwatson.exe in Windows 2000, creating a text file named Drwtsn32.log when it detected errors. This version, labeled by Microsoft as a “program error debugger,” included crash dump support for kernel-mode crashes (blue screens), in addition to user-mode application crashes. Over time, Microsoft dropped the “Dr.” title, and the term “Watson” came to describe the anonymous error collection process.
Early Watson versions wrote only crash state information such as stack traces to local files on the hard drive. This information was available to in-house developers or sent to Microsoft as part of a product support troubleshooting investigation. Later, with the release of Office XP, Microsoft added the Watson debugger, which with user permission, anonymously forwards crash information to Microsoft itself.
Something to remember about Watson data is that because the automatically forwarded information is anonymous, it has always been necessary to provide Microsoft with Watson information manually for a specific crash investigation. In other words, even when you are working with Microsoft product support personnel on a case, they do not have access to the Watson data forwarded automatically to Microsoft by your computer(s). Since 2001, Microsoft has collected, aggregated, and analyzed vast numbers of application error reports to identify problems that users experience with their Windows computers and applications. This information helps to prioritize development resources for bug fixes and service packs.
In 2002, Microsoft started making Watson crash information available to network administrators, as well as to Microsoft, with the release of Corporate Error Reporting (CER) 1.0 as part of the Office XP Resource Kit. Naturally, once administrators learned that Microsoft was receiving this information, some wanted to see just what that information was, and possibly make use of it in-house. At that time, Office XP was the only application that was Watson-aware.
CER 1.1 included support for the Windows XP operating system, and required the Office XP Resource Kit as a prerequisite. CER 1.5, the first version of Corporate Error Reporting to include a stand-alone download, existed side-by-side with version 1.1. In late 2003, Microsoft made CER 2.0 available to Software Assurance customers through the Volume Licensing program. This newer version uninstalled and replaced the earlier versions.
Installing CER creates a shared folder structure to contain error report data on the server hosting the service. The error-reporting client (Watson) accesses the root of the CER shared folder through a Universal Naming Convention (UNC) path, specified in the local computer’s policy for error reporting. CER 2.0 also provides a group policy template to help administrators deploy the CER settings to workstations.
CER 2.0 provides administrators with a console to view application error data collected in the shared folder and synchronize that data with Microsoft as appropriate. Using CER 2.0, the administrator can collect explicit data on problems with those products capable of reporting crash and error information to Microsoft, and evaluate the solutions reported back by Microsoft (returned in the form of a URL) before they reached the error reporting clients. CER 2.0 also gives administrators a reference of quantified data collected about crashes. Operations Manager 2007’s Agentless Exception Monitoring feature retains and extends CER 2.0’s functionality.
AEM is the successor and replacement for CER. Although CER was a free benefit for Microsoft customers with Software Assurance (SA), the AEM feature set is no longer free, even for SA customers. Microsoft SA customers looking for a CER replacement can either purchase OpsMgr 2007 (to deploy AEM along with monitoring their environment), or license the Microsoft Desktop Optimization Pack (MDOP) for their client workstations.
The MDOP includes the Microsoft System Center Desktop Error Monitoring (DEM) component. DEM is a modified OpsMgr 2007 management group, with only the AEM collection and reporting features enabled. DEM (a subset of the Operations console) is essentially an updated CER console for those SA customers who do not want to deploy the entire OpsMgr 2007 product. For more information about MDOP, see this link: http://www.microsoft.com/windows/products/windowsvista/enterprise/mdopoverview.mspx.
One can consider the modern desktop or portable workstation as a platform service for a business or organization. The client is where the user experience happens. Looking at the client as a platform means you are envisioning the operating system and stack of interrelated applications on the client as a manageable service. Managing that platform as a discrete entity, rather than as many independent components, can improve the user experience as well as achieve a lower Total Cost of Ownership (TCO) for the platform.
The client monitoring features in OpsMgr 2007 actually construct this manageable platform entity. OpsMgr assembles monitoring tools for many constituent components involved in delivering the user experience and integrates them in the Operations console. We have seen this concept described with the phase “desktop as a service.” The client monitoring features in OpsMgr 2007 allow you to measure the quality of your users’ desktop experience.
An organization’s success depends on the success of its people, and making employees more productive through communication is the main reasoning behind Information Technology (IT) investments. However, it is difficult to measure an IT organization’s effectiveness in delivering the client experience to employees using traditional tools and methodologies. Compare this with server and infrastructure support teams that often have a variety of diagnostic and reporting tools to provide metrics on their performance. For example, availability of a server farm is a valid measure of the job performance of the farm’s administrator or service provider. How do you measure the quality of the user experience on your organization’s desktops?
Many IT organizations divide responsibility for server, network infrastructure, and desktop support between multiple staff teams. No one disputes the critical importance of desktop support to employee and organizational morale and business success, but the desktop support staff seldom has tools other than queues of end-user service tickets to measure their effectiveness and contribution. It is a paradox that client desktop support—where IT service delivery generally occurs—is historically in the low position on the totem pole when it comes to budgeting and staffing resources.
Fortunately, this less-glamorous side of the IT world is gaining attention. TCO savings in the arena of server and storage management has been dramatic in recent years, and we expect this trend to continue. However, a big slice of pie (the support portion of TCO for the desktop platform) remains ripe for innovation and investment, and small gains in improving the quality and usefulness of the desktop experience can have immediate and noticeable impact on bottom-line productivity.
Client monitoring tools should provide insight into the quality of the desktop experience and the availability and performance of the users’ applications. Traditionally, desktop management software such as Microsoft’s Systems Management Server (SMS) and System Center Configuration Manager (ConfigMgr) focus on initial provisioning and configuration compliance of workstations. SMS and ConfigMgr are great at getting an application out there, and keeping it configured and updated as needed. However, these tools do not provide feedback regarding the health and use of the applications.
Network-level monitoring of workstations, such as ping monitors, is problematic. Although you expect mobile devices to be unavailable some or most of the time, a workstation that does not respond to a ping does not indicate a user does not have a functioning desktop! The user may be working just fine on a different network you are not pinging, or they could be offline while working on an airplane. More importantly, a workstation that is present and alive to respond to pings tells us nothing about the health or use of the operating system and user applications.
A final consideration that has made client monitoring a difficult proposition is the numbers. A global organization might have 100,000 or more desktops. Even if you could effectively instrument all clients in an organization for monitoring, it would require a massive IT staff to evaluate every error that occurred. With the overhead of such a monitoring operation, few organizations have attempted to collect metrics on application usability.
When an application or the operating system hangs or crashes, the typical person just reboots their computer. This is a somewhat satisfying experience for users, as they remain in control of their workstation, they don’t need to bother anyone else, and 90% of the time, they can continue work after the reboot. However, there are some steep downsides to this behavior:
Employee productivity loss during the system restart, plus loss of employee confidence in using their workstation platform.
Possible data loss, with lost time to re-create the data lost coincident with the crash or hang.
No IT department awareness of the event, and no ability to correlate problems to enterprise infrastructure changes.
Root cause remains unknown and unrepaired, with no association made between the problem and possibly available solutions.
For those users who do contact the IT help desk (when there is a help desk!), there are costs incurred by the help desk staff plus the additional productivity loss by the employee while interfacing with the help desk. The help desk will escalate issues they are unable to resolve (perhaps because they have not seen the problem before) to a desktop administrator, who often cannot devote much time to solving a one-off error—particularly if that error just disrupts or slows down the user, rather than derailing him completely.
Total work stoppages tend to get attention fast—a user or his supervisor quickly telephones the help desk when one or more people cannot do their job. What we’re looking at here are those intermittent work interruptions that can actually go unnoticed, or perhaps even be accepted as a cost of doing modern business. However, think about the incremental and recurring nature of the little productivity losses that organizations suffer. All of us in the IT industry want to drive down those losses as low as they can go.
Occasional hangs and crashes of applications and desktop operating systems do occur with real-world users (although hopefully rarely). In an impossibly perfect infrastructure, crash and hang errors are randomly distributed across users, computers, applications, and data sources with no particular source of errors. Of course, real-world desktops do run imperfect applications, possibly encountering corrupt files or instructions. Users will execute unanticipated or disallowed procedures that produce crashes and hangs. Real-world analysis of crash and hang information does not indicate a random distribution of errors and crashes—leading causes of errors can be usually identified, indicating where first efforts at remediation should take place.
Yet without a way to capture the frequency and nature of the inevitable hangs and crashes, decisions regarding effectiveness of the desktop platform end up based on subjective opinion and anecdotal evidence. Meanwhile, a tremendous amount of effort goes into end user support. A 2005 Gartner Group study found that 50% of the TCO for a workstation in the enterprise went toward supporting end user operations.
Enormous sums can be at stake when making strategic decisions about the desktop. The Information Technology industry needs to provide metrics on the effectiveness of the desktop platform, enabling decision-making based on more than just employee satisfaction with the IT department. The graph shown in Figure 16.1 highlights the logarithmic distribution of the types of errors collected by Microsoft. Knowing which errors occur most often facilitates more effective targeting of resolution efforts.

Operations Manager 2007 combines existing technologies in new ways to create a very credible client monitoring package. As you will see, its client monitoring features effectively address the issues related to large-scale workstation populations.
Elevating client monitoring to the integrated enterprise view of the Operations console is a giant step for Microsoft and the industry. With independent options for a client monitoring solution, there is a lot of latitude in your deployment architecture for the “right” solution. Smaller organizations can certainly deploy an OpsMgr agent to every client workstation; however, for larger client populations (a rule of thumb might be above about 500 desktops), you will probably get better results with a mix of agentless and agent-installed monitoring types.
Microsoft believes that the most effective deployment of client monitoring involves identifying four classes of client computers, applying a specific monitoring model to each class:
Agentless Exception Monitoring-only—. This is going to be the bulk of your clients, perhaps 90% or more in very large organizations. These computers have no OpsMgr agent. AEM settings, pushed by Active Directory group policy, integrate with Windows Error Reporting (Watson). AEM provides visibility to aid resolution knowledge for client crashes.
Using this model, all client computers in the enterprise, including those with OpsMgr agents, have group policies enabled to use AEM.
Aggregated Client Monitoring—. These computers are representative of the supported client populations. Some small percentage of distributed clients has an installed OpsMgr agent, leveraging the concept that a randomly selected subset of a larger population has statistical relevance to the entire population. The purpose of Aggregated Monitoring is to collect metrics, viewed in the Reporting space of the Operations console, that detect trends and top issues; Aggregated Client Monitoring does not raise individual alerts on clients. Alerts occur when a large number of client systems have the same problem; this is known as aggregated alerting.
Business Critical Monitoring—. This deepest level of monitoring includes individual computer alerting for key events. These will be your most important client computers—typical candidates are VIP computers, Point of Sale, kiosk, and network administration workstations. You can optionally enable alerting on loss of heartbeat for these computers.
Synthetic Transaction Monitoring—. These selected client computers, known as watcher nodes, play a key role in managing larger enterprise applications. Any client with an OpsMgr agent can host instances of synthetic transaction monitors that will perform certain client functions, measuring the success of the operation from the user perspective. Use synthetic transactions to guarantee end-to-end service delivery.
Basically, your tasks are to deploy AEM for the enterprise, and then identify which client computers will have OpsMgr agents installed for either Aggregated, Business Critical, or Synthetic Transaction Monitoring. After installing those agents, designate selected agent-managed clients for Business Critical Monitoring and/or Synthetic Transaction Monitoring. The remainder of this chapter discusses and demonstrates the use of each of these client monitoring capabilities.
Agentless Exception Monitoring does not use the OpsMgr agent. Implementing AEM involves just two steps: activating the AEM feature on an OpsMgr management server, and deploying a group policy object (GPO) with Active Directory (AD). We previously activated the AEM feature on a management server in Chapter 6 of this book, “Installing Operations Manager 2007;” now we will deploy the GPO and begin collecting crash and hang information from computers in our domain. Before starting to monitor agentless systems, we will introduce the architecture of AEM so you can understand what is happening under the hood.
To explain the architecture of AEM, we will look at the default behavior of the Watson and Windows Error Reporting (WER) clients without AEM deployed, and compare this with how things work after AEM is in the picture. Remember that Windows 2000 and Windows XP computers have the legacy Watson clients included with the operating system; Windows Vista computers have the new WER built-in.
These error reporting clients, by default, request user permission after a crash or hang to transmit the information to Microsoft’s back-end error reporting services. Here are the events that take place after invoking Watson or WER, illustrated in Figure 16.2:
If the user gives permission, the Watson or WER client makes direct Internet connection using Hyper Text Transfer Protocol (HTTP) to the Microsoft back-end servers. These back-end servers have the Uniform Resource Locators (URLs) of watson.microsoft.com and sqm.microsoft.com. The Watson back-end service receives error information, and the SQM (Software Quality Metrics component of the Microsoft Customer Experience Program) back-end receives CEIP information.
During the initial HTTP connection, a check takes place to see if Microsoft is aware of this type of error. If Microsoft has not seen the type of error before, the interface asks the user for permission to upload additional information about the error.
The connection is changed to secure mode (HTTPS), and the crash or hang error information is uploaded, along with the additional data if it was requested and permission was granted.
The error reporting client checks a Microsoft database of possible solutions to known errors during the connection. If there is a known patch, update, or workaround for the reported error, the user gets a dialog box with a link marked More Information. If the user clicks on that link, a web page at microsoft.com will open on their desktop, hopefully providing helpful information. (Optionally, AEM returns a generic web link to the user when no possible solutions link is available.)

When you deploy AEM polices via a GPO, it configures registry keys on the client computer with values that change the behavior of Watson or WER. The error reporting clients look for these registry keys prior to sending any reports to Microsoft. If you have configured Watson or WER for AEM, it redirects the error reports to the organization’s AEM server. Computers configured as AEM clients no longer attempt to connect directly to Microsoft over the Internet.
Activating AEM on an OpsMgr management server creates two avenues for collecting error data. One is for legacy Watson clients (Windows 2000 and Windows XP) and the other is for WER clients (Windows Vista). The Watson collection component is a shared folder on the AEM server accessible by all domain users and computers (but not anonymously). The WER collection component is an HTTPS listener endpoint, by default on port 51906.
When an error or crash occurs on a computer configured to use AEM, the report goes to the designated management server:
The Watson client on Windows 2000 and Windows XP computers uses the Remote Procedure Call (RPC) protocol to create a folder structure, based on the error parameters, inside the expected shared folder on the management server.
If the error or crash occurs on a Windows Vista computer, the WER client connects to the HTTPS listener to upload the information.
Advances in the WER client over Watson include extracting relevant information from the error report such as where the crash happened, what machine crashed, and which user experienced the crash. In addition, the WER client only requires access to the AEM management server (the management server enabled for AEM) on port 51906, making operation through firewalls much simpler than the RPC and file share method used by Watson.
Figure 16.3 ties it all together, showing how AEM sits between the error reporting clients and the Microsoft back-end error reporting services.

After enabling AEM on a selected management server, the next step for the OpsMgr administrator is deploying the AEM Group Policy Object (GPO) with Active Directory. Running the Configure Client Monitoring wizard (launched in the Operations console from the Administration -> Device Management -> Management Servers node) creates an administrative template file, saved in the root of %ProgramFiles%System Center Operations Manager folder. The file name is the Fully Qualified Domain Name (FQDN) of the server and has the .ADM file extension. In our Odyssey management group, the file name is hydra.odyssey.com.adm.
We recommend installing the Group Policy Management Console (GPMC) on the AEM management server, as you will need to import, link, and edit the GPO in the domain’s Active Directory. Here are the recommended steps required to deploy the AEM policy to your domain(s) using the GMPC:
Open the GPMC and navigate to the Group Policy Objects node in the domain (Group Policy Management -> Forest: forest -> Domains -> domain -> Group Policy Objects). Select the node, right-click, and choose New.
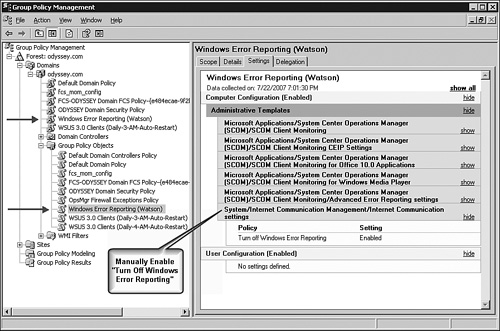
Name the policy as desired. We used Windows Error Reporting (Watson) to distinguish this GPO.
Locate the new policy in the tree below the Group Policy Objects node, select the policy, right-click, and choose Edit.
The Group Policy Object Editor opens. Navigate to the Computer Configuration -> Administrative Templates node, right-click, and select Add/Remove Templates.
The Add/Remove Templates dialog opens; push the Add button. Browse to the location of the template file saved by the Configure Client Monitoring wizard. In our case, the path was D:Program FilesSystem Center Operations Manager 2007hydra.odyssey.com.adm. Select the file and press the Open button.
Observe that the Current Policy Templates list now includes the imported template, and press the Close button.
Returning to the Group Policy Object Editor, notice there is now a Microsoft Applications node under the Computer Configuration -> Administrative Templates node.
Expand the Microsoft Applications -> System Center Operations Manager (SCOM) node to reveal the four subordinate nodes that begin with the words SCOM Client Monitoring.
Beginning with the first node, SCOM Client Monitoring CEIP Settings, select the node in the left side of the GPMC and then double-click to open each Settings item in the right side of the GPMC. With the individual Settings item open, push the Enabled radio button. This exposes the values for that setting that you selected when running the Configure Client Monitoring wizard.
Walk the tree of subordinate nodes in the System Center Operations Manager (SCOM) node, selecting and enabling each feature as desired. In all there are 11 Settings items that correspond to the questions and responses utilized by the Configure Client Monitoring wizard.
IMPORTANT: Now navigate to the Computer Configuration -> Administrative Templates -> System -> Internet Communications Management -> Internet Communications settings node. Double-click on the Turn Off Windows Error Reporting setting, select Enabled, and press OK. This step inhibits the Watson or WER client from attempting the default behavior of sending error information directly to Microsoft.
Optionally, disable the User Configuration portion of the GPO. In environments with many GPOs, user logon processing is faster when you disable the user portion of GPOs that contain no user settings.
To disable the User Configuration portion of the GPO, right-click on the root of the policy in the Group Policy Object Editor, and select Properties. Tick the Disable User Configuration Settings item and press OK.
Select File -> Exit (or push the X button) to close the Group Policy Object Editor and return to the GPMC. Now select where to link the new GPO. Because there is only one AEM server per management group, and since you want to include all computers in the domain, we recommend linking the GPO at the root of the domain.
To enable AEM on all computers in the domain, right-click on the domain object and choose Link an Existing GPO. Select the GPO—in our case, Windows Error Reporting (Watson)—and push OK.
Observe that the new GPO appears under the domain root with a shortcut (link) icon. Figure 16.4 illustrates the GPO linked at the domain root in the GPMC. If you have other domains in your Active Directory forest, you can expose them in the GPMC by right-clicking the Domains node and selecting Show Domains. Repeat the linking procedure from step 13 in this checklist for each domain as desired. Close the GPMC.
You have now enabled centralized collection and forwarding of AEM and CEIP information in your organization. No other setup or maintenance of the AEM feature in OpsMgr is required to achieve full use of this capability. Regardless of how many client and server computers there are in your organization, as soon as they refresh their group policy (which can take up to a few hours in a larger domain with multiple sites), they will begin reporting crash and hang information to the management group. Likewise, domain computers will no longer attempt to send Watson/WER or CEIP information directly to Microsoft once they apply the GPO.
Tip: Utilities to Generate Crashes and Hangs
We used a pair of excellent crash test programs to exercise the error collection features of AEM—Accvio.exe (Access Violation) and NotMyFault.exe. You can download these utilities, written by the Microsoft SysInternals team, at http://www.microsoft.com/technet/sysinternals/information/windowsinternals.mspx. The Not My Fault driver crash test utility prompts the user to “Pick your poison” and offers such cyber-toxins as Buffer Overflow, Stack trash, and Deadlock.
As the OpsMgr administrator, you may want to verify that AEM is working, and familiarize yourself with the console and reporting options available to view crash and hang information. If you have a known misbehaving application or invalid procedure that invokes Watson or WER, you can cause a crash or hang and observe the error reporting client in action, and then see the error in the Operations console appear shortly. If you don’t deliberately initiate some crashes, in time, actual crash and hang information should appear in the Operations console.
Before we step through some crashes and demonstrate the resulting AEM behaviors, let’s look at the shared folder structure created on the OpsMgr server hosting AEM. The AEM views in the Monitoring space of the Operations console are essentially windows into these folders. Under the root of the AEM file share, created when you ran the Configure Client Monitoring wizard, are four folders:
Cabs—. Contains subfolders based on the signature of the error report, where the last folder contains reporting data stored in a compressed archive .CAB file.
Counts—. Contains subfolders based on the error report where the last folders contain counts of .CAB files collected and total reports for the error signature.
Status—. Holds responses from Microsoft, to be relayed to the error reporting client on the next instance of a report with an existing signature.
PersistedCabs—. Contains .CAB files, previously sent to Microsoft, for historical reference. The AEM forwarding component on the management server clears the Cabs and Counts folders when the report to Microsoft is complete. Links in the Operations console to .CAB files in the PersistedCabs folder let the administrator browse details of past crashes.
Tip: File and Share Security on the AEM Server
The file shares created when enabling AEM on a management server have share permissions of EveryoneFull Control. Security is enforced at both the file and folder level. AEM setup creates two local computer security groups on the AEM server: AEMAgent and AEMUsers. The AEMAgent group membership consists of the local Administrators group with Full Control file and folder permissions. The AEMUsers group membership consists of all Authenticated Users, effectively all computer and user accounts in the domain, with special file and folder permissions.
These permissions allow error reports to be uploaded by client computers and processed by the management server. It should not be necessary to modify these permissions.
Figure 16.5 illustrates the AEM shared folder structure on the OpsMgr management server. We expanded the PersistedCabs folder to expose the error report of a particular problem application (in this case, the crash generator program from SysInternals). You can see that the contents of the .CAB file include some text files with information about the version of Windows the computer was running and details of the application causing the crash. There is also a file with the .MDMP extension; this is a mini-dump file and accessible to application developers using Microsoft Visual Studio to assist with debugging the error condition.

There are five pre-defined views in the Agentless Exception Monitoring view folder. When the AEM server receives crash and hang error information from client computers, it updates one or more AEM views with that information. The server processes collect reports on a timed basis—it can take up to two minutes from the moment the client transmits the error report until you see the error reflected in the console. Here is a description of each AEM view:
Application Error Events—. This is a conventional OpsMgr event view folder, containing an entry for each application error received. The other application error views list aggregated data by the application name, so if you are looking for the record of a specific instance of a computer uploading an application error report, you will see it here.
Application Error Group View—. This is a dynamic view, created by reading the application names and contents of the shared folder structure where error reports are stored. The view includes an entry for each error signature reported. A single application name may appear several times if the same application reports different error signatures. If there are more than 50 instances of the same error signature, the error group shows as a Critical state.
From this view, you can select application errors and customize the error buckets, which are the settings that guide the behavior of the Watson or WER client. We will explore the bucket customization options later in this section. Figure 16.6 shows several application error groups present in a management group, with one group over the 50-count threshold.
Application View—. Also a dynamic view, listing application errors by application name. Each application name appears only once in this view, even if the application reports a variety of error conditions. The health monitor for an application error includes counters for computers, users, and applications—if any of these elements exceeds the threshold, that application has a Critical health state.
Crash Listener View—. This is a read-only view that confirms the settings of the AEM management server. The view will show only one entry, the AEM server. When you select the server, the Details pane confirms all the selections made when running the Enable Client Monitoring wizard.
To change one or more of these settings, you must disable AEM on the management server, then re-enable AEM by running the Enable Client Monitoring wizard again with the desired new setting(s). No data is lost during the re-enable sequence, when and if you change the settings.
System Error Group View—. This view functions like the Application Error Group View, only this view is for system crashes such as blue screens. This view treats each crash report like a separate object that will always have a Critical state. A link in the Details view of each crash shows the path of the .CAB file, located in the PersistedCabs folder of the AEM server corresponding to the crash report. Figure 16.7 shows the System Error Group View, with the contents of the sysdata.xml file in the linked .CAB file.


We will demonstrate viewing an application crash in the console and customize the error bucket for that particular crash signature. Using the Accvio.exe (Access Violation) utility, we generate an application crash on our Windows Vista desktop. Figure 16.8 shows the series of dialogs the user experiences after an application crash.

Something to notice in Figure 16.8 is that the values in the lines of the Problem signature (in the upper-left dialog box detail area) correspond to the folder structure created for this error report in the shared folder on the AEM server. In this case, the folder path, called the error bucket, is APPCRASHaccvio.EXE�.0.0.0379b0f9accvio.EXE�.0.0.03793b0f9c0000005�0001032. You can also observe the names of the files that will be uploaded as information to the shared folder location listed in the lower dialog box detail area, such as the mini-dump file (WEREFA3.tmp.mdmp, in this case).
Shortly after the application error, we can see an error event appear in the Application Error Events View in the Operations console. Figure 16.9 gives us some information about the error event. We can see that the user Administrator has had two application errors. We selected an error in the top of the Results pane, and in the lower Details pane, we can see the name of the computer reporting the error (Titan). There is also a live link to the .CAB file in the AEM server’s shared folder. We opened that link, and you can see the four files in the .CAB, matching those the user gave permission to send (see Figure 16.9).

In addition to identifying the top application errors in your organization, AEM can optionally collect additional, custom information and reach back to users with a custom solution link. When the AEM server receives an application error, a unique sequence of nested folders is created that match the characteristics of the error—creating an error bucket (the last folder created).
Subsequent Watson and WER clients discover an existing bucket, created by the first error report. The bucket contains an instruction text file, status.txt. The error reporting client reads the status.txt file in the bucket before performing the error upload. The error reporting process now executes, including any additional custom actions added to the file. Microsoft automatically modifies the status.txt file with updated information from its back-end WER servers, and an administrator using the Operations console can customize it manually.
To view and modify the error bucket settings, navigate to the Application Error Group View, select the application in the Results pane, and click the Show or Edit Error Group Properties task in the State Actions pane on the right.
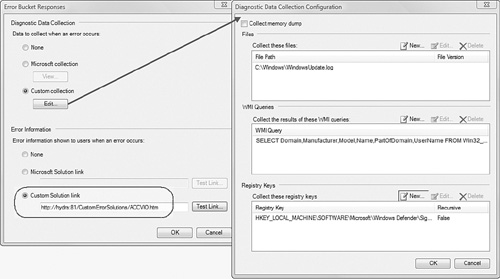
The Error Bucket Reponses dialog box will open. Here you can customize the actions to take the next time the same error occurs. The options exposed by this feature include the following:
Disable collection of diagnostic data.
View the diagnostic data collection options Microsoft requests for this error (this option is not always present).
Create a custom diagnostic data collection configuration to include a memory dump, specific files from the hard disk, Windows Management Instrumentation (WMI) queries of any type, and copies of registry keys you specify.
Select to show no error information to the user, even if Microsoft has provided a solution link for that error.
View and test a solution link if Microsoft has provided one.
Specify your own custom solution link, rather than none, or one Microsoft may provide.
Figure 16.10 applies most of the custom features. Note that we selected collecting the WindowsUpdate.log file, running a WMI query that returns the computer domain, manufacturer name, and other data, and collecting a registry key with the current anti-malware signatures used by Windows Defender. We also created a demonstration web page as a custom error solution.
After applying these customizations to the error bucket for our ACCVIO.exe application error group, we can collect the custom diagnostic data and furnish users with a custom solution link each time they encounter this error. Additional options for customizing the handling and forwarding of crash and hang error information are located at the Settings node in the Administration space of the Operations console. We will cover these options later in this chapter in the “CEIP and the Microsoft Privacy Statement” section.
Next, we will again run our ACCVIO.exe error-generating utility. When the WER client asks permission to send more information, the list of files to upload now includes the WindowsUpdate.log file, as we expected. When we review the contents of the .CAB file, we will also find a registry.txt file with the custom registry data, and a wql.txt file with the WMI query information we wanted to collect.
Additionally, when the user clicks for more information about their error, they are directed to our custom error link on the corporate intranet—rather than the Microsoft online crash analysis link on the Internet. Figure 16.11 contrasts the Microsoft online response on the left with the custom in-house response on the right. Notice that we included a pair of voting buttons and an external web hyperlink to our custom response.

Consider employing a web-based survey technique to help solve particular errors in custom applications. You can stage a short automatic interview with the end user to gather targeted information. Some sample questions that might be helpful for a survey include the following:
Tip: Public Access to Microsoft WER Back-end Database
Microsoft’s Winqual services enable software and hardware vendors to access reports to analyze and respond to problems caused by their applications. Vendors can use WER at no charge to view error reports.
You must register with Microsoft to participate in the Winqual program. You can use the Winqual website to view driver-specific, application-specific, or operating system-specific error reports associated with your organization, which are stored in error buckets in the Microsoft WER back-end. Each error report provides details related to that bucket, and you could then request a file of the associated data. For more information about Winqual, visit http://www.microsoft.com/whdc/maintain/StartWER.mspx.
Beyond the five views available in the Agentless Exception Monitoring view folder in the Monitoring space, there are also four client monitoring reports in the Client Monitoring Views Library in the Reporting space of the Operations console. These reports aggregate the information in the monitoring views and perform data analysis. They also provide a historical record of the performance of applications in use on the network.
In addition to offering further ways to gain insight from collected AEM data, the reports provide a convenient way to extend access to this valuable data across a broader audience. Because you can schedule OpsMgr reports as Adobe .PDF files to network file shares or intranet sites, people do not need have direct interaction with the Operations console or OpsMgr report server to see which applications are causing the most trouble for users. As an example, you can have weekly or monthly reports automatically generated and posted to departmental servers for viewing by application developers and desktop administrators.
The first of two application-related reports is the Top Applications report. This report displays a bar-graph chart showing the top applications reporting errors, a summary table, and a detailed table with the application name, version, crash count, and average daily crash count. Figure 16.12 shows this exported report, open in Adobe Viewer.

The Top Applications Report Summary table, in the center of the report, lists the average crash count per application and the average daily count per application. Knowing these average values helps you assess the statistical significance of the differences between the highest application(s) and the next few down the list in the detailed chart. The report defaults to including the top 25 applications. If you want to change this report setting, modify the N value in the parameters header of the report. For example, set the N value to five to report on the top five applications with errors.
The other application report is the Top Applications Growth and Resolution report. Like the Top Applications report, this report also defaults to N equals 25, where N is the number of top applications to include in the report. You can modify a second setting in the report parameters section, Interval Duration in Days, which defaults to seven. Because this report provides a measure of the percent of error increase over time, be careful not to specify a Previous Interval From value earlier than you have data for—this will result in an empty report. Figure 16.13 shows the graph portion of this report.

In the Top Applications Growth bar graph shown in Figure 16.13, the longer bars indicate a higher rate of error increase. The lower two listed applications, which show a 100% increase, increased in frequency more than the upper two applications from the first comparison period to the second. The significance of this graph, to us, is that even though we know (from the Top Applications report) that the second listed process has the highest quantity of errors, the other listed applications are getting worse at a faster rate than the top application.
This error-trending capability is a great way to detect a problem before it affects a large number of users. This may help you correlate an increase in errors with a recent configuration change, such as a patch or service pack deployment. You catch the new error because of its comparatively high rate of change, even though the raw number of reports for that particular error may be much less than the top applications.
Notice the unique construction of the Report Time field in the report header. The Report Current Interval and Report Previous Interval dates take their starting values from the Current Interval From and Previous Interval From values in the report parameters. Those are the start dates of the two comparison periods. The report construction then adds the Interval Duration in Days you specify to both dates, to arrive at the end dates of the two sampling periods. This report lends itself to comparing one week to the previous week, or to the same week in the previous month.
A second pair of AEM reports focuses on error groups, rather than applications with errors. The main difference between the application error reports and the error group reports is that the application error reports list one instance of an application, summing up the errors associated with all error signatures received from that application. Compare this to the error group reports that include an entry for each error signature, regardless of what application it came from.
The error group reports display data about individual error buckets, while the application reports aggregate data from all error buckets of the same application. You can use the application-based reports to see what applications in general are causing problems, and then use the error group-based reports to identify exactly which unique errors are responsible for the most error events.
The first of two error group reports included with OpsMgr 2007 is the Top Error Groups report. This report displays a bar-graph chart with the top reported errors, a summary table, and a detailed table with the application name, application version, error group ID, bucket type, crash count, and average daily crash count. Figure 16.14 shows the detailed table portion of this report.

In the Top Error Groups report displayed in Figure 16.14, we highlighted two error buckets associated with the same application. We also placed an arrow next to an error group that has a Microsoft response available from online crash analysis. Periodically reviewing this report is a great way to find out which errors users are experiencing that Microsoft may already have a solution for.
A unique column in the Top Error Groups report lists the bucket type that the error group is based on. There are eight bucket types defined in the Operations Manager 2007 SDK (Software Development Kit); we list them in Table 16.1. The various bucket types are made available to developers to help them code WER support into their applications.
The other error group report is the Top Error Groups Growth and Resolution report. This report shows the top error groups based on their growth and resolution rate during the specified period. Like the Top Applications Growth and Resolution report, this report compares the average daily crash count during one multi-day period (the Previous Interval), against a second multi-day period of equal length (the Current Interval). The resulting quotient, the Crash Count Percentile Increase, calls attention to error groups that are growing faster than others are.
When you ran the Configure Client Monitoring wizard to enable AEM on a management server in your management group, you could elect to participate in the Customer Experience Improvement Program (CEIP). When CEIP is active on a client or server, it gathers information about Microsoft products used on that particular computer, processes it, and sends it to Microsoft, combining it with other CEIP data for further analysis. The transmission uses outbound TCP port 51907. The collected data is used to help Microsoft solve problems and to improve the products and features that customers use most often. Examples of collected data include the following:
Configuration, such as the number of processors, the version of Windows used, and the number of network connections.
Performance and reliability, such as program responsiveness and the speed of data transmission.
Program use, such as the most frequently used features and Help and Support center usage.
Instead of having a large number of clients each reporting this data individually, you can have your clients send their CEIP data to the AEM server as a central collection point for the organization. The management server hosting AEM then forwards the data to Microsoft. This feature of OpsMgr helps minimize (or eliminate) direct access to the Internet by client workstations. In addition, some enterprise firewalls might not open port 51907 between internal networks and the Internet. Using the CEIP forwarding component of AEM means only the OpsMgr management server running AEM needs outbound port 51907 open to access the Internet.
A compelling reason to use the AEM features in OpsMgr is you can control how and when your organization forwards information to Microsoft. Let’s explore the customization options available to the OpsMgr administrator for these features.
Navigate to the Settings node in the Administration space and open the properties page of the Privacy setting. There are four tabs controlling different aspects of CEIP and AEM as they relate to exchanging information over the Internet with Microsoft. The first three tabs (CEIP, Operational Data Reports, and Error Reporting) control your organization’s level of participation in Microsoft’s CEIP and WER programs as they relate to the function of OpsMgr itself. The fourth tab is Error Transmission and deals with handling crash and hang report forwarding for all applications in the management group, including OpsMgr. We will look at the functionality of these settings tabs, as follows:
CEIP—. On this tab, you can join the CEIP or select not to join the program.
This setting has a different function than the CEIP Forwarding screen of the Configure Client Monitoring wizard. When you enabled AEM by running that wizard, if you chose to collect and forward CEIP data, you redirected client computer CEIP transmissions from the Internet to the management server. You were not turning CEIP on or off for any particular user or application—that is still determined by the user, unless Group Policy or some other mechanism is in place to force enabling of CEIP features in an application.
The setting on this particular tab turns CEIP on or off for the Operations Manager 2007 software application in your management group. Enabling this setting facilitates CEIP data collection from the management group. Microsoft receives this data along with all the other CEIP data from other applications in your organization.
Specifically, CEIP collects information about computer hardware with an installed Operations console, and how all Operations console users in the management group use the product. The setting for this tab is initially set when you install the OpsMgr database component for your management group—the setup process asks if you want to participate in CEIP as part of the management group setup.
Operational Data Reports—. This is a unique feature for Operations Manager, a sort of super-CEIP. If you elect to send Operational Data Reports (ODR) to Microsoft, CEIP generates weekly reports to upload to Microsoft. ODR gathers information about OpsMgr’s usage in the management group. Microsoft collects the configuration data to understand customer environments. In addition, these reports help Microsoft determine what extra rules, monitors, or management packs can help customers lower the total cost of monitoring their networks. CEIP for OpsMgr, enabled on the first tab of the Privacy settings, only looks at use of the Operations console. ODR looks beyond console usage patterns and assesses product usage in monitoring devices.
You must install the OpsMgr Reporting component for ODR to function. You can see the ODR reports used by this feature in the Reporting space of the Operations console. These reports are intended to be most useful to Microsoft, rather than the administrators of the management group. However, you can run the reports at any time yourself and see what data Microsoft is receiving, or would receive with ODR enabled. Here are the three reports contained in the Microsoft ODR Report Library:
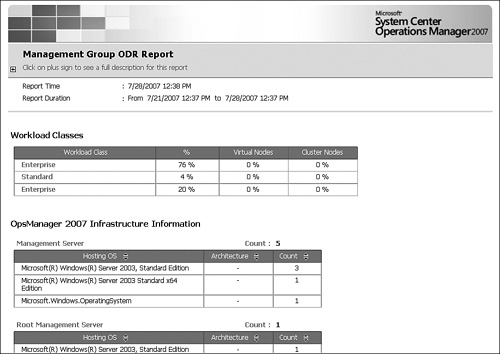
Management Group—. Displays workload classes (enterprise vs. standard) performed by management servers, their operating systems, and the percentage of virtual and cluster nodes managed. This report helps Microsoft understand the infrastructure customers use to deploy OpsMgr and the amount of load on the management group. Figure 16.15 is a screenshot of the Management Group ODR Report.
Management Packs—. This is a very long report that contains three detailed tables—the tables report on the installed management packs and their versions, the overrides applied in the management group, and the rules created through the Operations console.
Most Common Alerts—. Shows an overview of the top 24 most common alerts across all management packs. This is the same report you see in the Microsoft Generic Report Library, just preconfigured with a seven-day date range. Microsoft uses this information to improve management pack quality and to reduce alerting noise levels.
Error Reporting—. This tab allows you to control the participation of OpsMgr 2007 itself in the error reporting mechanism. You can select to not generate error reports, to prompt the user for approval before sending error reports, or to automatically send error reports without prompting the user.
If you enable error reporting on this tab, Watson and WER clients on OpsMgr component computers will initiate the error reporting process when crashes and hangs occur in the OpsMgr product. If AEM is also enabled, those error reports will be collected from the management group and forwarded to Microsoft along with all the other crash and hang reports from other applications in your organization.
The OpsMgr components using this setting are the management servers, gateway servers, and agents. Error reporting behavior for the OpsMgr database and data warehouse uses the settings specified for SQL Server 2005, rather than those specified on this tab for the OpsMgr components.
Error Transmission—. The error transmission tab is the location of some important configuration settings for the management group. Figure 16.16 displays this tab. There are three sections:
The top section with the Filter button
The center section that involves uploading errors to Microsoft
The bottom three items controlling what links users may see after an application error occurs
You can filter the errors sent to Microsoft by application name, user, computer, and other criteria. This lets you exempt your most sensitive users, computers, and applications from having their error reports forwarded to Microsoft. This filter capability lets the bulk of your organization contribute error information to Microsoft’s back-end WER servers, while reserving specific confidential information to the organization’s AEM servers only. Pressing the Filter button allows you to specify these exemption options:
Specific users (from Active Directory)
Specific computers (from Active Directory)
Specific applications
Specific modules
Specific application error types (bucket types, such as DW15 or Blue)
Specific event types (such as Appcrash or MPTelemetery)
In the central area of the Error Transmission tab shown in Figure 16.16, labeled Diagnostic Data Collection Settings, you can enable or disable uploading of data collection requests globally. Additionally, you can granularly enable or disable the type of data uploaded to Microsoft’s back-end WER services. The types of data you can control are additional files, registry information, WMI queries, and memory dumps. You can also modify the maximum number of .CAB files uploaded to Microsoft per error group (bucket). The default is ten, which is probably sufficient to notify Microsoft that an organization is experiencing multiple reports with the same error signature!
At the bottom of the Error Transmission tab is a location to optionally specify a default solution link when no Microsoft or custom solution link is available. If you populate this field, every time a user’s Watson or WER client completes the error reporting procedure, they will see an Error Reporting dialog box with a More Information link, even if neither you nor Microsoft specified a solution link for that error. If your default link points to a generic crash survey form, you can collect information from users about errors as they occur in your organization, even the first time they are reported.

We recommend that Operations Manager administrators enable some or all of the Microsoft forwarding features, particularly those that apply to OpsMgr itself. Having Microsoft receive such feedback on a large scale from the real world enables more rapid and accurate improvement of the products we all use for our livelihood. Just as Watson/WER collection shows Microsoft the top problems and allows them to target their hotfix, update, and service pack development, CEIP and ODR show Microsoft what is working in their products and what features get used the most. That data provides input into development of add-ons, feature packs, and new versions of software that build on the features most in demand.
If you enable all the CEIP, ODR, and Watson/WER collection and forwarding features in your AEM deployment, Microsoft will receive a lot of information about your organization. There is naturally some discomfort at sharing some organizational data like server names and some user data such as file names. You can opt-out your most sensitive sources of information using the Privacy settings previously described in this section.
Error information uploaded to Microsoft is indexed by the nature of the error—i.e., the target error bucket—not the identity or location of the contributing organization. The only uniquely identifiable information associated with uploading error reports to Microsoft is the source IP address. Microsoft uses the IP address to generate aggregate statistics; it is not used to identify or contact you.
As for the safety and security of the Watson/WER back-end services themselves, Microsoft assures us they use a variety of security technologies and procedures to help protect personal information from unauthorized access, use, or disclosure. For example, Microsoft stores the information on computer servers with limited access, located in controlled facilities. We are not aware of any instances where Microsoft has been accused or suspected of misuse of error reporting data. Conversely, we are aware of numerous occasions where error and CEIP information have resulted in improvements in Microsoft software that directly benefitted us and other customers.
Microsoft publishes a simple and clear two-page Privacy Statement for the Microsoft Error Reporting Service, available at http://oca.microsoft.com/en/dcp20.asp. There is also a specific Microsoft System Center Operations Manager 2007 Privacy Statement at http://www.microsoft.com/systemcenter/privacy/opsmgr.mspx. The specific OpsMgr privacy statement includes sections that address the privacy issues of each component described in this chapter, including CEIP, ODR, and WER.
Although many or most client computers in your organization may participate in Agentless Exception Monitoring (AEM), some client computers should also have an OpsMgr agent installed on them. In this section, we will explore the three scenarios where it is a good idea to consider deploying agents on some client computers, as follows:
Smaller organizations, perhaps those with 50 or fewer computers, may find it simplest to deploy an agent on every client computer, particularly if their client computer hardware can leverage hardware vendor management packs imported into the management group. This also lets all the computers participate in other OpsMgr features like Audit Collection Services (ACS).
Mid-size organizations, between 50 and 500 client computers, can make the decision on whether to have all computers with agents—or implement a mix of AEM-only and agents on clients—based on economics of the licensing, and the hardware capacity of the computer(s) running the OpsMgr server and database components. A single-server OpsMgr management group can easily handle 50 client computers; however, somewhere on the road toward and above 500 computers, a single management server is going to start to slow down.
Larger organizations—for example, those with above 500 client computers—will almost certainly employ a mix of AEM-only clients and clients with agents. This is because the large client populations let you leverage statistical techniques like the significance of random sampling and looking for rate of change.
The math and the economics make deploying a full monitoring agent to every client unnecessary and expensive. In addition, deploying an agent to any computer incurs acquisition costs for the agent license, an incremental cost of resources consumed in the Operations Manager management group, and an ongoing cost to support the agent in terms of licensing, maintaining, and upgrading.
Organizations of any size should consider deploying OpsMgr agents on client computers in these categories and scenarios:
Aggregated (Collective) Client Monitoring—. Scenario: Random, proportional sampling of client computers within each client population. The more homogeneous the client population, the smaller the sample can be and remain statistically significant. If you have a set of various desktop images for certain models of computers, try to monitor equally across each desktop model. You generally don’t care if the individual computers are always on the network; computers can be powered off, or mobile.
Business Critical Monitoring—. Scenarios: VIP and high-impact workstations and application boxes such as IP Telephony, kiosk, POS, Supervisory Control And Data Acquisition (SCADA) instrumentation, and network administration workstations. We recommend you select at least one client computer at each branch or remote office for Business Critical Monitoring. You generally want to know if these computers go offline—you monitor them like servers for high availability.
Synthetic Transaction Monitoring—. Scenarios: Endpoint watcher nodes defined in the health model of a distributed application, remote/proxy agent to monitor another device, or third-party/external service from a local point of presence. We recommend you seek ways to exploit this feature in OpsMgr. You can easily deploy multiple, smart sets of watcher nodes to measure the end-to-end service delivery of distributed enterprise applications. Watcher nodes for Synthetic Transaction Monitoring are subject to Business Critical Monitoring as well.
Tip: Comparing Aggregated to Business Critical Monitoring
Aggregated (or Collective) Client Monitoring is the default client monitoring mode for all discovered client computers after you import the client monitoring management packs. Some Aggregated Client Monitoring client computers are also selected to be subject to Business Critical Monitoring. Business Critical Monitoring and Aggregated Client Monitoring both use the OpsMgr 2007 agent for collecting Aggregated Client Monitoring data; the management packs are just tuned differently. Specifically, the Business Critical management pack allows for individual alerting.
If you have decided to include client monitoring as a mission of your management group (in addition to monitoring servers, network devices, and distributed applications), then you begin by importing the client monitoring management packs. The management packs for monitoring the Windows XP and Windows 2000 Professional client operating systems—as well as the Information Worker management packs covering Office XP, 2003, and 2007 and Internet Explorer 5, 6, and 7—are included with the initial Operations Manager 2007 software distribution, although you will want to check the System Center pack catalog for updates. You will download the Windows Vista Client Monitoring management pack from the Operations Manager 2007 online catalog.
Five operating system management packs need to be imported in order to use all the client operating system monitoring features, as follows:
Microsoft.Windows.Client.Library.mp—. Required for monitoring both Windows 2000 and XP client operating systems.
Microsoft.Windows.Client.2000.mp—. Enables collective monitoring of Windows 2000 Professional client computers.
Microsoft.Windows.Client.XP.mp—. Enables collective monitoring of Windows XP client computers.
Microsoft.Windows.Client.Vista.mp—. Enables collective monitoring of Windows Vista client computers. Only aggregated alerting is available on Vista clients; you cannot add Vista client computers to Business Critical Monitoring.
Microsoft.Windows.Client.BusinessCritical.xml—. Enables selected collective monitoring clients to also be Business Critical Monitoring clients. This management pack has a dependency on both the Windows 2000 and Windows XP operating system management packs, so even if you have no Windows 2000 clients to manage, you still need to import the Windows 2000 client management pack in order to import and use the Business Critical Monitoring management pack with Windows XP client computers.
Nine management packs are part of the Information Worker monitoring feature of OpsMgr. In addition to a Common Library management pack, there are management packs for the following products:
Each version of Microsoft Office (XP, 2003, and 2007)
Windows Explorer
Internet Explorer
Windows Media Player
Outlook Express and Mail
MSN Messenger
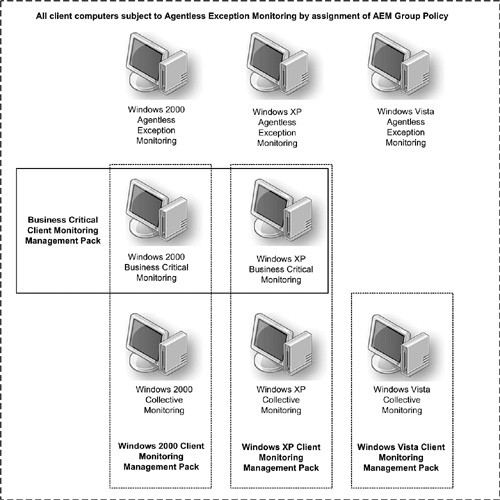
Figure 16.17 illustrates the matrix of client monitoring options available with OpsMgr 2007. Importing the client monitoring management packs enables the Collective (Aggregated) and Business Critical Monitoring features.
Import the client monitoring management packs in the conventional manner using the Operations console’s Administration space. After the management packs are imported, you will notice a single top-level view folder—Microsoft Windows Client—listed in the Monitoring space. That folder contains all the views installed by the client operating system and Information Worker management packs. Now we will look at the new views, reports, and functionality you can expect after importing the client monitoring management packs.
Collective (or Aggregated) Client Monitoring is Microsoft’s solution to effectively measure the quality of users’ desktop experiences without overloading the management group and IT support staff. Microsoft’s design goal with the client monitoring management packs was that they should require zero configuration to function in a useful way and that they would not be noisy—that is, not create a management burden to evaluate a lot of non-critical alerts.
Collective Client Monitoring gathers and stores information about client computers, but does not monitor individual computers or generate alerts about specific computers.
Collective Client Monitoring is the default configuration for the Windows Client and Information Worker management packs. In other words, when you discover and install OpsMgr agents on client computers after importing the client monitoring management packs, those client computers are automatically and immediately subject to Collective Client Monitoring. Usage scenarios for Collective Client Monitoring center around identifying when large numbers of client computers are experiencing the same problem (using the Monitoring views in the Operations console), and performing historical and trending analysis on collected data (using the Reporting views).
We will first look at the Enterprise Health Monitoring views in the Microsoft Windows Client view folder of the Monitoring space. Figure 16.18 highlights the three Enterprise Health Monitoring views and exposes the health model for the Outlook Client Mail Access State view.

The Outlook Client Mail Access collective monitoring feature enables the Information Worker management pack to flag when large volumes of Outlook clients are unable to send and receive mail. Specifically, the client mail access monitor changes state and generates an alert when 10% or more of the Outlook application instances managed by OpsMgr are unable to contact their respective Exchange server.
Other views you can see in the Enterprise Health Monitoring folder in Figure 16.18 are the Internet Explorer Services State and Windows Explorer Data Source Services State. Although the Outlook Client Mail Access view is enabled automatically, the other two Enterprise Health Monitoring views require configuration before any data will appear in the console:
Internet Explorer Services State—. Identifies the inability of client computers to access a specified web application, such as the order-taking process at an e-commerce website. To enable this feature, run the Add Monitoring wizard, creating a Web Application to detect a failure to connect to the specified website. Next use the Windows Internet Explorer Service template in the Distributed Application Designer to create a Distributed Application based on the Web Application. This populates the folder with an Internet Explorer Service whose health represents a client’s ability to access the specific website.
Windows Explorer Data Source Services State—. Identifies the inability of client computers to access a specified OLE DB data source, such as an Excel spreadsheet that connects to a database. To use this view, run the Add Monitoring wizard to create an OLE DB Data Source that detects a failure to connect to the specified database. Next use the Windows Explorer Data Source Service template in the Distributed Application Designer to create a Distributed Application based on the OLEDB Data Source; that populates the folder with a Windows Explorer Data Source service whose health represents a client’s ability to access the specific database.
The report views added to the management group by the client monitoring management packs are probably more useful on an ongoing basis, as the Collective Monitoring views in the Monitoring space are most relevant when you have a major problem in progress. You can see the extensive list of Information Worker report folders and views in Figure 16.19.

You can access the Information Worker reports from the Reporting space, as shown in Figure 16.19, and from the Information Worker Application Health Monitoring folder in the Monitoring space. In that folder are the Office Application Health and Windows Application Health dashboard views. For example, if you select an instance of an Office application on one or more client computers in the Office Application Health view folder, the appropriate Resource Utilization report becomes available in the Actions pane. Clicking the report link opens a report view with the selected computer(s) pre-defined as objects in the report parameters. Likewise, selecting a computer in the Windows Application Health view makes a pre-defined report link available for the version of Internet Explorer and/or Media Player installed on the selected computer.
Tip: CD Content—Client Monitoring Alert Thresholds
The Client and Information Worker Collective Monitoring management packs, as well as the Business Critical Monitoring management pack, utilize pre-defined thresholds that are not exposed in the Operations console. For example, Office application thresholds are greater than 90% CPU utilization or 500 MB memory utilization for any single Office application. Client OS thresholds are greater than 95% CPU utilization, less than 10 MB available memory, or greater than 80% committed memory. To see all the thresholds in your management group, run the PowerShell script get_thresholds.ps1 by Microsoft’s Boris Yanushpolsky, included with the CD that accompanies this book.
The output from the script includes the type of objects the monitor is targeted to, the display name and threshold used by the monitor, whether the monitor generates an alert when its state changes, if the alert is autoresolved, and the severity of the alert.
Figure 16.20 shows the Internet Explorer 6.0 Resource Usage report for a specific Windows XP computer during a 24-hour period. Because this report focuses on just one computer, the sample count of 96 reflects exactly a 15-minute sample rate for this performance counter. We can also note that with an average processor time of .1%, Internet Explorer is not causing any problems on this computer. You can see how the reporting features let you zero in on the performance of particular Collective Monitoring client computers.

Collective monitoring of Windows 2000 and Windows XP computers provides almost identical functionality for both operating systems. Collective monitoring of Windows Vista computers, in contrast, has a lot more features that result from the richer diagnostics infrastructure built into Vista. Look at the type of information that you can get from Collective Monitoring of Vista client computers in the boot performance report shown in Figure 16.21.

If you had multiple models of desktop computers in your organization, this report lets you compare how long each model took to reboot. That would quantify the speed improvement of newer, faster computers compared to older, slower ones—as well as allow you to spot an increasing boot time within the same model family, which would merit further investigation. There is similar analysis for Resume, Shutdown, and Standby performance of Windows Vista computers. There reports are tools that really help the IT department understand issues users may be facing in more detail than “my computer is slow!”
Using the data collected by the client monitoring management packs, administrators can objectively compare the performance of the same application on different client operating systems, or different versions of the same application on the same operating system. Figure 16.22 displays the Windows Application Performance view in the Information Worker Application Performance view folder.

Figure 16.22 compares the performance of Internet Explorer 7.0 on two different Vista client computers over a 24-hour period. The Vista Client Monitoring management pack integrates with the Windows 2000 and XP management packs to allow you to compare application performance across platforms. For example, you could compare the experience of Internet Explorer (IE) 7.0 on both Windows XP and Windows Vista computers to see what advantage users would experience by upgrading the operating system to Windows Vista. Alternatively, you could assess IE 6 versus IE 7 performance on your Windows XP computers to help make a decision about upgrading in-place to IE 7.
We think that once OpsMgr administrators become familiar with the significantly improved manageability of Windows Vista compared to Windows 2000 and XP, they will lean even more toward migration to the new client operating system. Take a look at the reports available for the Windows Vista operating system in Figure 16.23. There are 17 sophisticated, client-focused reports available to view that promise to improve the client experience for organizations running Windows Vista. (There are six generic reports available for Windows 2000 and XP clients: Logical Disk, Memory, Network Adapter, NTFS Quota, Physical Disk, and Processor.)

Tip: Give the Vista Reports Some Time
Initially, Windows Vista Client Monitoring reports may contain no information. This is normal, since reports built on aggregated data require at least 24 hours of collection. Many of the Vista reports are designed to trend data over large timeframes, such as three to six months, so there may not be much useful data for several weeks after installing the Vista Client Monitoring management pack. Also, consider that a lack of data for reports based on failures, such as disk failure, might mean none of those failures has occurred in your organization.
Business Critical Monitoring least one client computer at each is the most comprehensive client monitoring solution with OpsMgr. This is the only level of monitoring that can watch client computers individually and generate alerts. Adding client computers to Business Critical Monitoring requires more overhead than other types of client monitoring. You can only bring client computers into Business Critical Monitoring after discovery takes place and the clients have an agent installed on them. This means that client computers must first be made Collective Monitoring clients; then they can be promoted to Business Critical Monitoring status.
Here are the steps to perform to add client computers to Business Critical Monitoring:
Navigate to the Authoring space and select the Groups node.
Type Business Critical in the Look for box and press the Find Now control.
Select the appropriate group for the operating system of the client computers to add. For example, if you are adding Windows XP client computers, select the All Business Critical Windows XP Clients group. Right-click on the group and select Properties.
On the Explicit Members tab, press the Add/Remote Objects button.
In the Search for drop-down box, select Windows Client XP Computer and press the Search button. (If you are adding Windows 2000 clients, select Windows Client 2000 Computer.)
All the Windows XP computers with OpsMgr agents installed will appear in the Available items area.
Select one or more computers to be added to Business Critical Monitoring, and push the Add button. After confirming that the desired computers are in the Selected objects area, push the OK button, then OK again.
Repeat steps 3 through 7 for the other operating system—i.e., if you also have Windows 2000 client computers to be added to Business Critical Monitoring.
Figure 16.24 illustrates these steps to add Windows XP client computers to the All Business Critical Windows XP Clients group.

Populating either or both the All Business Critical Windows XP Clients and the All Business Critical Windows 2000 Clients groups will enable Business Critical Monitoring in your organization. Those groups are the target of an override that enables most of the monitors and alerts included in the client management packs, particularly those that raise individual alerts for disk health and operating system health events.
When you enable Business Critical Monitoring for one or more client computers, you can optionally enable Advanced Monitoring on selected client computer objects. A definition of Advanced Monitoring, in the context of Business Critical Monitoring clients, is a monitor setting that you must manually enable.
Advanced Monitoring is disabled out of the box with OpsMgr. The reasoning is that Microsoft wants to protect the performance and usability of the OpsMgr management group, at the expense of making you do a little extra work. Microsoft wanted to prevent hundreds or thousands of client computers from overwhelming a management group after they are discovered. Therefore, some monitors that are data-processing intensive are turned off, even for Business Critical Monitoring. It is up to you to identify any Advanced Monitoring features that you need, and then enable them on a case-by-case basis.
An example of Advanced Monitoring is the Network Adapter state and performance views. Some network adapter performance information is not collected by default, even from client computers subject to Business Critical Monitoring. Examining the Network Adapter State view in the root of the Microsoft Windows Client view folder, or the Network Adapter Health dashboard view in the Windows Client OS Health Monitoring, shows all unknown status icons for each computer’s network interface(s). Those monitors are in the Advanced Monitoring category. To enable Advanced Monitoring on an object of interest, such as the network interface of a VIP or mission-critical client computer, follow these steps:
Select the Not monitored status indicator in the results pane of the monitor that you want to enable. Right-click and select Open -> Health Explorer.
Expand the branch of the health model that contains the monitor you want to enable. Click on the monitor to select it.
Press the Override button and select Override the Monitor -> For a Specific Object of Type.
The Select Object picker should appear; select the matching object that you want to monitor and press OK.
The Override Properties page should appear; tick the Override box in the top Enabled line and change the Override Setting from False to True. Be sure and save the override to a custom management pack (not the Default management pack) and press OK.
Push OK and close the Health Explorer. Within several minutes, the state icon for the object should change from Not Monitored to Healthy.
Although some business critical monitors fall into the Advanced Monitoring category (such as some network interface monitors), most of the monitoring views in the Operations console provide data on client computers added to Business Critical Monitoring without further configuration. This is referred to by Microsoft as Standard Monitoring for business critical clients (requiring no additional configuration), compared to Advanced Monitoring.
All the views in the Windows Client OS Performance view folder feature Standard Monitoring, and are populated for business critical Windows 2000 and Windows XP client computers. Figure 16.25 shows the Disk Utilization dashboard view in the Windows Client OS Performance view folder.

In Figure 16.25, all views in the left pane except the Microsoft Windows Client view are hidden, and the navigation buttons are collapsed, exposing the entire client monitoring view folder hierarchy. The Disk Utilization dashboard view is seen in the Results pane. Notice each logical disk of each business critical client is available for charting in the Results pane.
Likewise, each of the other dashboard views in the Windows Client OS Performance folder are populated with computer names of business critical Windows 2000 and Windows XP client computers: Disk Capacity, Disk Performance, Memory Utilization (Page File and Physical), Network Adapter Performance, and Processor Performance. Windows Vista client computers cannot take part in business critical client monitoring in this release of OpsMgr; remember that the Vista management pack is only for Collective Monitoring.
Further up the view hierarchy in Figure 16.25, notice the Windows Client OS Health Monitoring view folder. This is where you perform operational monitoring of your business critical client computers. Alerts raised by business critical clients appear here. There are the Disk, Network Adapter, and Operating System Health dashboard views, as well as the Operating System Events folder with four subfolders (Failed Software Update Installations, Services or Drivers Failing to Start, Shares with Invalid Configuration, and Unexpected Service Terminations).
Remember to look at the tasks area of the Action pane when you select particular business critical client monitors. Context-sensitive tasks are provided with most views, such as Run Chkdsk when logical disks are selected in the Results pane.
In addition to the views in the Monitoring space that are populated with data from business critical client computers, you can run reports to learn more details about client computer performance. In Figure 16.26, we show the Processor Report, targeted to the Windows XP computers that we placed in Business Critical Monitoring.
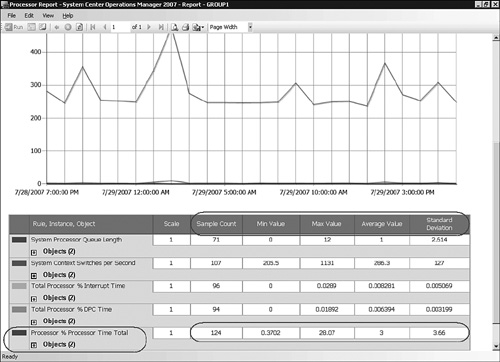
Here are the steps to follow to produce the Processor Report seen in Figure 16.26:
Navigate to the Reporting space and select the Windows Client XP Professional Operating System report folder.
Select the Processor Report and press the Open button.
Change the From time from Today to Yesterday (this creates a 24-hour report window).
Press the Add Group button, and in the Contains field, type Windows XP and press the Search button.
Select the All Business Critical Windows XP Clients group name; then press the Add button and the OK button.
Press the Run button to generate the report.
In Figure 16.26, we circled the column headers and the values in the lower row for the % Processor Time Total. Notice that there is a population size of two (2) objects (the two Windows XP computers we placed into Business Critical Monitoring), and that the various columns present statistics using the aggregated data from all computers in the report’s population.
This is a different kind of report view than you might be used to seeing, which typically is a chart of server-based performance. Most server-based reports call out the performance of individual servers, whereas the client-based reports, even for business critical clients, emphasize collective performance.
Chapters 18, “Using Synthetic Transactions,” and 19, “Managing a Distributed Environment,” of this book provide examples of employing client computers as watcher nodes for Synthetic Transaction Monitoring. However, we include this section in Chapter 16, “Client Monitoring,” to remind you to plan to import the client management packs in order to use that feature. You can’t select client computers to be watcher nodes for your distributed applications unless you have deployed an OpsMgr agent to them.
Often, strategically located client computers are the best platform to serve as watcher nodes for end-to-end monitoring of enterprise applications. You need a monitor “at the end” to capture service delivery in the context that matters, which is usually at the user desktop. This technique is also known as User Perspective Monitoring.
We recommend that all client computers selected as distributed application watcher nodes also are subject to Business Critical Monitoring. You need to be alerted when a watcher node for a distributed application is down or malfunctioning; otherwise, you may not be able to correlate the root cause of a distributed application failure alert to the watcher node itself being down.
Even if your organization does not intend to employ any of the client monitoring features we have talked about in this chapter, it is still a good idea to be familiar with the client operating system management packs, and to import them into your management group. That way, your monitoring infrastructure is staged to deploy watcher nodes in support of managing end-to-end enterprise applications.
Note: AEM Resource Kit Utilities
Wave 1 of the OpsMgr 2007 Resource Kit includes two utilities pertaining to AEM: the AEM Toolkit and the AEM Test tool.
The AEM Toolkit contains an unsealed mangement pack, which is documented as identifying generic errors sent from WER clients to AEM-enabled management servers. The AEM Test tool is intended to help you determine whether AEM is running correctly by crashing itself so you can check the results produced by OpsMgr.
However, we were unable to produce any results (or crashed applications), after trying to test both utilities in multiple management groups running OpsMgr 2007 RTM as well as the SP1 Release Candidate, so we cannot discuss these tools. There also appears to be a dearth of knowledge in the newsgroups and elsewhere.
We started this chapter with an introduction to the roots of Microsoft’s client monitoring initiatives, Dr. Watson and the Corporate Error Reporting program. We talked both about the historical challenges presented by client monitoring, and the enormous opportunity to improve the organizational bottom line by investing in this area. After explaining the architecture of Agentless Exception Monitoring, we gave examples of the value of collecting crash and hang information. We also described how to customize the AEM experience by collecting additional information from users and providing them with just-in-time solutions once errors occur. We introduced the concepts of Collective (or Aggregated) Client Monitoring and Business Critical Monitoring of client computers, and closed with a reminder of how client computers can play an important role in the end-to-end monitoring of distributed enterprise applications. In our next chapter, “Monitoring Network Devices,” we help you connect the dots to other divices in your network.