
Integrating OpsMgr 2007 with Other System Center Applications
</objective> </feature>This book has discussed a variety of ways that Operations Manager 2007 (OpsMgr) provides solutions to various business challenges. One of these challenges is effectively monitoring and managing disparate computing and network systems. Although OpsMgr is primarily designed for monitoring Windows-based computers and Microsoft applications and services, many businesses possess dissimilar systems in addition to having Windows servers and desktops. There are also network devices, which form a key part of any Information Technology (IT) infrastructure and should be monitored and maintained as well.
OpsMgr meets this challenge with a variety of methods to monitor and connect to non-Windows systems and network devices as well as to monitor non-Microsoft applications. These capabilities extend monitoring beyond the Windows environment, enabling OpsMgr to perform a much broader role in systems monitoring and management. Here are some points to keep in mind:
Operations Manager uses management packs and connectors as tools to enhance its native capabilities in managing dissimilar systems and devices. This interoperability employs a combination of vendor-created management packs enabling OpsMgr to monitor third-party applications, as well as product connectors that allow OpsMgr to connect to other software systems—including other systems’ management products and help desk applications. Additionally, Operations Manager 2007 supports connecting to other OpsMgr management groups, allowing information exchange across very large and possibly geographically remote OpsMgr implementations.
Network device monitoring in OpsMgr is available out of the box, although the monitoring capabilities are somewhat limited in this version. You can enhance the native monitoring capabilities by using Simple Network Management Protocol (SNMP) trap monitoring (discussed in Chapter 17, “Monitoring Network Devices”) or by incorporating third-party products to further augment network device monitoring.
Third-party OpsMgr-compatible agents facilitate monitoring non-Windows operating systems such as HP-UX, Linux, and UNIX, to name a few. These agents extend the capability of OpsMgr 2007, enabling effective monitoring of non-Microsoft operating systems and applications, with their status reflected in the OpsMgr Operations console. The data collected using these third-party agents is also available to write to the data warehouse, for reporting purposes.
In this chapter, we examine the processes to connect two OpsMgr management groups together using the Connected Management Group architecture, which is a new feature in OpsMgr. We will also discuss the various product connectors that allow OpsMgr to connect to other systems management applications and help desk systems, highlighting the process one should take to configure one of these product connectors.
We will examine the third-party application management packs available at the time of writing this book. We will also look at the methods to monitor non-Windows systems and network devices, using some of the available third-party solutions to enhance the monitoring available with OpsMgr.
Although Microsoft designed OpsMgr primarily for monitoring and maintaining Windows-based systems and Microsoft applications, it did not limit the product just to these systems. Microsoft intended that OpsMgr be able to communicate with disparate systems and monitor devices that do not support an OpsMgr agent.
Many businesses use a variety of operating systems to provide IT services. These systems may include Windows, Linux, UNIX, and HP-UX, among others, and the operating systems may be installed on a variety of hardware, including Intel-based systems, IBM AS400, and Sun machines. Not only are there heterogeneous systems, but network devices such as switches and routers also play a critical part in any network infrastructure. With that in mind, a robust monitoring solution should provide the ability to monitor and connect to many different types of systems, minimizing the need to maintain multiple monitoring solutions and processes for monitoring all these systems.
Although OpsMgr is able to act as the “manager of managers,” Microsoft understands that in many situations other management systems are already in place. Therefore, OpsMgr offers the ability to connect to third-party management systems such as IBM Tivoli and HP OpenView Operations (HP-OVO) using connectors written by Microsoft or third parties. These connectors use a Web service–based architecture and enable OpsMgr (or earlier versions of Microsoft Operations Manager [MOM]) to connect to third-party applications.
Using this design allows full alert forwarding and synchronization between OpsMgr and any third-party system. Therefore, alerts generated in OpsMgr can be raised in the connected system, and vice versa. Once an alert is raised, it can be updated automatically from either system and the update will synchronize with the connected system.
With previous versions of MOM, organizations implementing multiple management groups could create tiered management group infrastructures, enabling the creation of a structured monitoring and management solution in very large and complex environments.
This functionality differs in OpsMgr, and the idea of a tiered infrastructure no longer exists. Instead, we have the concept of connected management groups, which is a logical relationship defined using the Operations console. The following section looks at the changes in multiple management group structure in OpsMgr, and the methods to configure management group connections.
In large or complex environments, it may be necessary to utilize more than one OpsMgr management group to perform effective monitoring. Earlier versions of Microsoft Operations Manager implemented a tiered architecture, where alert and status data rolled up the tiers, enabling presentation of data from multiple management groups in a single MOM Operators console. We show an example of a tiered management group in Figure 22.1.

Although the tiered configuration model was very useful, it had its limitations:
One aspect of the tiered architecture is the alert data itself was copied from the source management group to the destination management group.
In addition to the network impact, copying the data meant duplicate data would appear in the console and reports. To prevent this data from appearing in the console and the reporting data warehouse, you needed to create a dedicated management group that acted as a top level for the tiered infrastructure.
Adding a top-level management group increases cost and complexity to a MOM infrastructure; this is yet another management group, which itself must then be monitored and maintained.
With OpsMgr 2007, these tiered management groups no longer exist. Microsoft has replaced tiered management groups with the concept of connected management groups. The title itself suggests its function—a method by which you can connect management groups without the need to physically copy data from one management group to another. Using connected management groups eliminates the requirement to dedicate a separate management group to act as a top-level management group; this saves time, expense, and future management overhead. We should note, however, that you still have the capability to configure a tiered structure if required in OpsMgr 2007, using the PowerShell Command Shell. However, this configuration is not common, and we will not cover it in this chapter.
You can view an example of a connected management group infrastructure in Figure 22.2.
Using connected management groups in this manner, the Operations console is configured to display alert and status data from other connected management groups. After you configure the console this way, each time it is loaded or refreshed it makes a web request to the Root Management Server (RMS) of the selected connected management group. Alert data is identified and sent back to the RMS of the requesting management group, and can be viewed in the Operations console. No alert or status data is permanently stored in the requesting management group; it is simply presented for viewing in the console.
With MOM, you configured tiered management group infrastructures using a graphical user interface (GUI), the Administrator console. In OpsMgr 2007, you establish a connected management group connection using the Operations console, and you use the Command Shell to define configurations that are more complex. After establishing a connected management group connection, you can configure the Operations console to request data from the connected management group.
Viewing the data rather than storing it not only removes the need to replicate data across management groups, but it also means that the data is much more accurate. With a tiered configuration, it is easy for alert data to become out of date. We can illustrate this by looking at a problem occurring in a low-level management group that rolls up through the tiers. By the time it reaches the top, the issue may have been resolved, yet it could take some time for that resolution to synchronize throughout the infrastructure.
With OpsMgr connected management groups, outdated information is no longer of concern. The Operations console issues a new web query each time it is loaded or refreshed, so only the most current information appears. We not only have less overhead, we have information that is up to date!
Data viewed in the Operations console is also subject to a user’s role scope in the connected management group (we discuss security and user roles in Chapter 11, “Securing Operations Manager 2007”). Having user roles means the user running the Operations console that is requesting data can only see the data for which he or she is scoped in the source management group.
We can illustrate how roles work across connected management groups with an example. We have a user connected to the GROUP1 management group (located in the ODYSSEY domain in Plano) that requests all alerts from the GROUP2 management group in the ECLIPSE domain, located in Frisco. If the user role in GROUP2 is scoped to Exchange Servers only, that user sees the Exchange Server data from GROUP2, regardless of his or her user role scope in GROUP1.
In this section, we will look at the process of creating an OpsMgr management group connection using the Operations console.
We will view the data using the Operations console in the GROUP2 management group located in the ECLIPSE Active Directory domain, and we will connect to the GROUP1 management group located in the ODYSSEY domain. Here are the steps to follow:
The first stage to connecting to a management group is to validate both the local (connecting) and the connected management groups. In this case, the GROUP2 management group is the local management group because it is initiating the connection; therefore, GROUP1 is the connected management group.
We will open the Operations console in each management group in turn and validate there are managed agents and that there are no critical alerts active before we attempt to connect. This ensures that any major issues are resolved before we connect the two management groups.
This process is not essential, but we recommend it as a best practice because it ensures no significant issues exist in either management group that may be ignored or missed.
We will start with the Operations console in the GROUP1 management group. You can see the status of this management group in Figure 22.3.
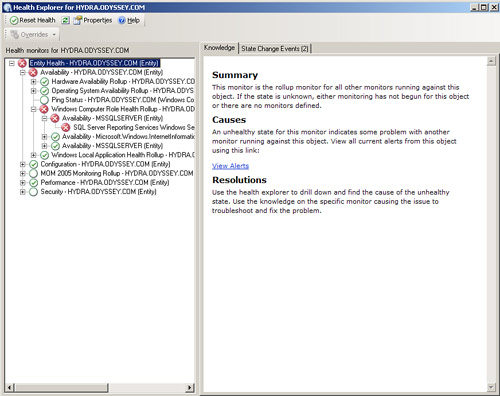
As you can see, currently Hydra (the RMS) is in a critical state. If we look at the Health Explorer, shown in Figure 22.4, we can see that the SQL Server Reporting service on Hydra is stopped.
Before we continue, we should resolve this issue. In this case, we simply start the service to resolve the issue.
Now that we have resolved the issues with the GROUP1 management group, we can look at the GROUP2 Operations console. Figure 22.5 displays the status of the GROUP2 management group.
You can see that GROUP2 is working correctly and is healthy. It therefore does not need any action.
Note: Determining Health Is More Complex with Larger Environments
The process of checking management group health becomes more difficult as you deploy more agents. In the event that not all monitored machines can be brought to a healthy state, particular attention should be paid to resolving issues on OpsMgr management servers and the RMS in particular.


After we validate the two management groups and resolve all issues, we connect the management groups. You will connect the management groups using the Operations console in the local management group. In our case, we will carry out the tasks in this example using the Minotaur server in the ECLIPSE domain, because this RMS (GROUP2) is initiating the management group connection.
Before connecting management groups, it is important to carry out several prerequisite tasks to ensure that the process of establishing the connection is successful:
Ensure that you can resolve the Fully Qualified Domain Name (FQDN) of the RMS in the connected management group (in this case, HYDRA.ODYSSEY.COM). This FQDN should be able to be resolved from the RMS in the local domain.
In our example, we need to ensure that MINOTAUR.ECLIPSE.COM can resolve this FQDN. To ensure this is successful in our environment, we will need to create a secondary DNS zone for the ODYSSEY.COM domain.
Tip: Installing and Configuring DNS
You can find information on installing and configuring Domain Name Services (DNS) at http://technet2.microsoft.com/windowsserver/en/technologies/featured/dns/default.mspx.
Once DNS resolution is working, add the SDK and Config accounts to the Operations Manager Administrators role in Operations Manager. Use the Operations console to add the accounts to this role.
We recommend you create a global security group in each domain. Add the SDK and Config accounts to this group, and then add the other domain’s security group to the local domain you are in. For our environment, we will add the ODYSSEY group to the Operations Manager Administrators user role in GROUP2, and vice versa. If you are dealing with domains that do not have a trust established, you will need to create an account in the connected management group to use to connect.
Now perform the following steps to update the user role:
Open the Operations console and navigate to the Administration space.
Click Security -> User Roles and then open the Properties window for the Operations Manager Administrators user role. Figure 22.6 shows the Properties window.
Click the Add... button and locate the domain security group containing the accounts for the SDK and Config services and then select them (you must use a domain security group because this user role does not support adding single accounts). Click OK, and then click OK again.

Because we are connecting to a management group in a separate domain, we need to identify the SDK and Config service accounts for the connected management group. In this case, the account ODYSSEYOM_SDK is running both services and is the one we need to specify.
Now that we have carried out the prerequisites, we can establish the connection.
Open the Operations console, if it is not already running, and then open the Administration space.
Click the Connected Management Groups node. The right pane currently is empty, because there are no connected management groups.
Right-click in the right-side pane and select Add Management Group. This displays the Add Management Group window.
At the Add Management Group window, we will add the name of the management group, which in this case is GROUP1. We will also add the FQDN of the RMS of this management group, HYDRA.ODYSSEY.COM.
We will select the radio button Other user account to establish the connection. Once this radio button is selected, the User name, Password, and Domain boxes will appear. Here, we will enter the SDK service account information from the ODYSSEY domain (ODYSSEYOM_SDK).
Figure 22.7 shows the completed Add Management Group window.
Once the connection is established, it will appear in the right-side pane. We show the connection in Figure 22.8.


To view alerts, you must scope the user account in the local management group to data in the connected management group. If the two management groups are in separate domains with no trust relationship, you will need to create separate accounts in the connected management group for the local management group to use. In our environment, a trust is in place, so we must simply scope the account we are running the Operations console as in the local management group (GROUP2) to data in the connected management group (GROUP1).
You will accomplish this using the User Roles node in the Administration space in the Operations console. We discussed user role scoping in Chapter 11. For our example, we will scope the account in the ECLIPSE domain (GROUP2 management group) to see all data in the GROUP1 management group, so we will simply add the account to the Operations Manager Operators user role in GROUP1. Of course, you could limit the data accessed by the account by creating a new user role scope.
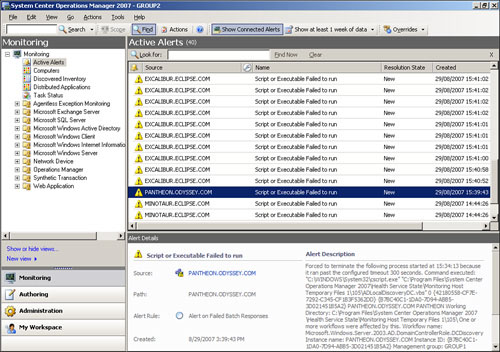
After you correctly configure the user scoping, the Show Connected Alerts button becomes visible on the toolbar at the top of the Operations console window.
When you click the Show Connected Alerts button, you are prompted to enter a user account to connect to the connected management group and retrieve alerts. Once you enter the details and click OK, relevant alerts from the connected management group are displayed.
Figure 22.9 shows the Show Connected Alerts button and an example of a connected management group alert.
Tip: The OpsMgr 2007 Deployment Guide
The Operations Manager 2007 Deployment Guide documents the process of implementing connected management groups. You can download the Deployment Guide from the System Center Operations Manager 2007 Product Documentation center at http://go.microsoft.com/fwlink/?LinkId=85414.
In addition to connecting to other OpsMgr management groups and requesting data, the capability to connect to third-party management suites and help desk systems is critical to ensuring OpsMgr can fit into an existing management infrastructure.
Product connectors pass alert data between OpsMgr and the third-party management or help desk systems, allowing the alerts that appear in the OpsMgr Operations console to display in a different management system or be used to log calls in a help desk system. Most connectors support bidirectional communication, which means that alerts and alert updates are passed both to and from OpsMgr and the third-party system.
In MOM 2000 and MOM 2005, product connectors used the MOM Connector Framework (MCF) to exchange data. The Operations Manager Connector Framework (OMCF) replaces the MCF in OpsMgr 2007.
The process for selecting which alerts are transferred has been improved in OpsMgr 2007; it now utilizes the extremely powerful Notification Workflow process (explained in detail in Chapter 14, “Monitoring with Operations Manager”). The Notification Workflow allows you to configure the subscriptions linked to the product connector, using the Product Connectors node in the Administration space in the Operations console. The Product Connectors node is where you subscribe to alerts, which marks them to be forwarded to the product connector and beyond to the third-party system.
The significance of this is that unless you specifically add an alert to the subscription, the alert is not forwarded! This functionality was far less granular in MOM 2000 and MOM 2005. Figure 22.10 shows the Product Connector Properties window. You can click the Add... button to create a subscription, configuring the subscription in a manner similar to how you create email subscriptions.

These new capabilities allow OpsMgr product connectors to be more configurable and precise than in MOM 2000 and MOM 2005; when properly configured, product connectors should reduce the number of false and unnecessary alerts passed to the connected system, thus reducing network traffic and storage requirements.
We will look at connectors for two of the most popular management appliances seen in the field: HP-OVO and IBM Tivoli. We will use the connectors developed by Engyro for the examples in this chapter, because in our opinion they offer the best balance between supportability, ease of configuration, and value for the money. We will, however, also provide information on other product connectors that are available.
Tip: Microsoft Purchase of Engyro
Microsoft acquired Engyro, a privately held company, in June 2007. As a Microsoft subsidiary, Engyro will continue to sell the Engyro product connectors. Microsoft’s acquisition furthers its commitment to its customers’ long-term need for interoperable solutions.
Although Microsoft will continue to support the existing Engyro MOM 2005 solutions, it will no longer sell MOM 2005–related connectors, agents, or management packs. Microsoft will support existing Engyro MOM 2005 Connector customers with rights to upgrade to the Operations Manager 2007 Connectors.
The Microsoft Engyro product connector for HP-OVO is very simple to configure. It supports a number of advanced features, such as deployment into a redundant configuration and automatic failover capability. The connector consists of two major components:
A product connector, which runs on a Windows system with network connectivity to the Operations Manager RMS.
A web services daemon (EXD), installed on the HP-OVO server. The daemon runs in either Windows Server/Workstation 2000/2003 or HP-UX (a version of the web services daemon is supplied for both).
In addition to the two main components, there is also the Connector Management console, which you access from within the OpsMgr Operations console, and a management pack that helps OpsMgr manage and monitor the connector. Finally, there is a set of OVO templates for the transmission and management of data between OpsMgr and OVO.
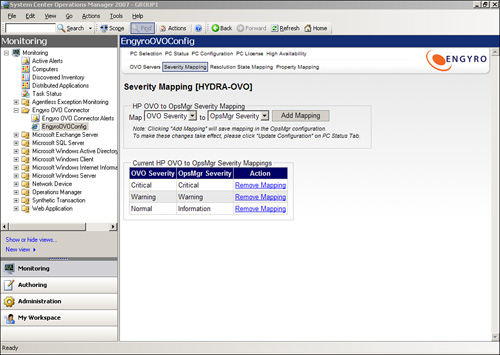
After the product connector is installed, it is managed through the OpsMgr Operations console. Figure 22.11 shows Engyro as a node in the Monitoring space of the Operations console.

The screen displayed in Figure 22.11 is the initial screen you see when opening the EngyroOVOConfig screen. This screen shows you the overall status of the connector.
Along the top of this initial screen are a number of tabs used to configure the connector. The most important tabs to consider are the Severity Mapping, Resolution State Mapping, and Property Mapping tabs. These tabs configure how the alert fields from OpsMgr map to alerts in OVO.
Selecting Severity Mapping in Figure 22.11 opens the Severity Mapping tab screen shown in Figure 22.12. You can see three preconfigured severity mappings displayed here, which help in mapping OpsMgr severities to ones recognized by OVO. Using this screen, you can create additional mappings as required by selecting the Add Mapping button. HP-OVO and OpsMgr query the mapping information directly, so if you update any information in these systems, the connector configuration screens will reflect those changes shortly.
To summarize, the Engyro HP-OVO connector provides bidirectional communication for transmission of alert data from OpsMgr to HP-OVO. This functionality facilitates integrating OpsMgr with an existing HP management infrastructure.
Connecting to Tivoli using the Engyro connector is very similar to the process of using the OVO connector. The components of the product connector are the same as those of the OVO connector, except that this connector comes packaged with Tivoli TEC classes and rules to assist in passing data between the two systems.
Again, once you install the connector, it is managed using the OpsMgr Operations console with the EngyroTECConfig screen, as shown in Figure 22.13.
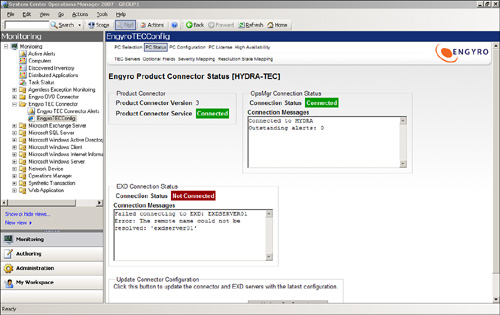
Similar to the Engyro HP-OVO connector, the Engyro Tivoli connector provides bidirectional communication and allows you to integrate OpsMgr within an existing management infrastructure using Tivoli TEC.
The product connectors we have covered here are by no means the only product connectors available; they are simply the ones we have chosen to look at in detail in this chapter. This section looks at other connectors available and specifies the versions of Operations Manager these connectors support. Table 22.1 lists the connectors currently available for MOM 2000/2005 and OpsMgr 2007. Appendix E, “Reference URLs,” includes live links to these connectors.
Table 22.1. Connector Compatibility with Versions of Operations Manager
Connector | MOM 2000/2005 | OpsMgr 2007 |
|---|---|---|
Engyro OpsMgr to BMC Remedy ARS Product Connector | X | X |
Engyro OpsMgr to HP OpenView Operations Product Connector | X | X |
Engyro OpsMgr to Tivoli TEC Product Connector | X | X |
Zenprise BlackBerry Connector for OpsMgr 2007 | X | |
Zenprise Exchange Connector for OpsMgr 2007 | X | |
message master® Enterprise Alert 2007 | X | X |
CA SPECTRUM Connector for MOM | X | |
eXc Software BMC Patrol | X | X |
eXc Software IBM Tivoli | X | X |
eXc Software CA UniCenter | X | X |
eXc Software HP Open-View Connector | X | X |
Micromuse NetCool Connector—connectors available from IBM and eXc Software | X | |
eXc Nagios Connector | X | X |
Remedy ARS Connector—connectors available from Engyro and eXc Software | X | X |
MOM-CRM Connector for Microsoft Dynamics 3.0 | X | |
AppManager Connector for MOM | X | |
NetIQ Extended Management Pack (XMP) AppManager Connector for MOM | X | |
OpalisRobot | X | |
InTrust Connector for Microsoft MOM | X | |
BMC Impact Integration for MOM | X | X |
MOM Integration for BMC Patrol | X | X |
EMC Smarts InCharge Connector | X | |
iWave Integrator OpsMgr to Amdocs Clarify Integration | X | X |
iWave Integrator MOM 2005 to CA Solve for z/OS Integration | X | |
iWave Integrator MOM 2005 to CA Unicenter Integration | X | |
iWave Integrator OpsMgr 2007 to CA NSM | X | |
iWave Integrator OpsMgr 2007 to CA UniCenter Service Desk | X | |
iWave Integrator MOM 2005 to HP OpenView Network Node Manager (NNM) Integration | X | |
iWave Integrator OpsMgr to HP OpenView Operations (OVO) Integration | X | X |
iWave Integrator OpsMgr to Peregrine Service Center Integration | X | X |
iWave Integrator OpsMgr to Remedy ARS Integration | X | X |
iWave Integrator OpsMgr to Tivoli Enterprise Console (TEC) Integration | X | X |
iWave Integrator OpsMgr to Tivoli Information/Management for z/OS Integration | X | X |
iWave Integrator MOM 2005 to Tivoli Net View Integration | X | |
iWave Integrator MOM 2005 to Tivoli Net View for OS/390 Integration | X | |
iWave Integrator MOM 2005 to Tivoli Service Desk Integration | X | |
iWave Integrator MOM 2005 to Vantive Integration | X | |
iWave Integrator OpsMgr 2007 to Microsoft Operations Manager | X |
As you can see from Table 22.1, currently there is a larger selection of connectors available for MOM 2000/2005 than there are for OpsMgr. This is not a surprise, because the product is relatively new. Because Microsoft redesigned the connector framework components in this version of Operations Manager, third-party vendors will have to alter their connectors to function correctly in OpsMgr 2007. As the OpsMgr product matures, more connectors will become available.
As we mention in the “Managing Non-Windows Systems” section later in this chapter, eXc Software already has developed a large number of management packs and virtual agents available for OpsMgr 2007. Table 22.1 shows that the company also has developed connectors for BMC, Tivoli, UniCenter, and OpenView. Additionally, all of the eXc MOM 2005 management packs and virtual agents are now available in OpsMgr 2007 versions, including a variety of different network device manufacturers such as Cisco and 3Com, non-Windows operating systems, and enterprise applications such as Oracle. eXc has redesigned its base framework (which hosts all of the virtual agents) with a goal of seamless integration with OpsMgr 2007.
The other provider of a wide variety of third-party options is iWave. iWave provides a large number of different connectors for MOM 2000 and 2005 and has recently released connectors for OpsMgr 2007. The iWave Integrator product was created in 1993, and the iWave Integrator team is well versed in enterprise management applications and is able to implement fully bidirectional, real-time integrations in as little as three to five days.
In addition to the multitude of Microsoft application and operating system management packs listed in the System Center Pack Catalog (available at http://go.microsoft.com/fwlink/?linkid=71124), third-party hardware and software vendors have created a variety of no-cost management packs for monitoring their hardware and Windows-based software. The next sections highlight some of these management packs.
Hewlett-Packard (HP) has always been on the forefront of new technology, particularly in the business server arena in recent years with the release of the HP ProLiant and Integrity server lines.
HP provides its own software for monitoring hardware (HP Systems Insight Manager or HP SIM), but the company also recognizes the value offered by OpsMgr in integrating monitoring into a single console.
With that in mind, HP has released the HP Server management packs for OpsMgr 2007. There are two distinct management packs: one to monitor HP’s ProLiant range of servers, and the other to monitor HP’s Integrity servers.
The monitoring utilizes HP’s System Management Agents, which are installed when building an HP server using their SmartStart deployment software (the HP management packs support SmartStart server agent versions 7.5 and above).
After installing the HP management packs, you can view the status of your HP servers in the Operations console. The management packs also offer a number of HP server–specific tasks to make managing HP systems easier. These tasks include the ability to access the HP Systems Management Homepage (web-based server hardware information) from the Operations console and the ability to discover information about an iLO (Integrated Lights-Out board) in a server and then connect to it—also from the Operations console.
Providing visibility of server hardware further enhances the monitoring performed by OpsMgr, extending its capabilities beyond the operating system and application layers to the physical hardware layer.
HP also offers a separate management pack for monitoring its StorageWorks line, further extending Operations Manager monitoring to SAN hardware and external storage and backup devices.
Figure 22.14 displays an example of monitoring using the State view of the HP Server Hardware management pack. Chapter 17 includes several other examples of using the HP management packs.

The HP management packs are available from the HP Global website at http://h18004.www1.hp.com/products/servers/management/mom2007/index.html.
Similar to HP, Dell has made its server hardware information available through OpsMgr to enable better visibility of your IT environment.
The Dell management pack works by using the Windows Management Instrumentation (WMI) information published by its own OpenManage systems management agents to populate OpsMgr. The management pack collects this information from monitored machines and reflects their statuses based on the information collected. To utilize this management pack, the agents must be running version 5.2 or greater of the Dell OpenManage software. Using an earlier version could result in script errors and a failure of hardware monitoring on the affected machines.
Tip: Early Versions of OpenManage Generate Errors
We have seen situations where Dell servers create a large number of “Script or Executable has failed to run...” errors on the Dell management pack when the version of OpenManage is not at least 5.2. Specifically we have had this error with versions 1.8 and 1.9.
The Dell management pack enables integrating Dell PowerEdge server hardware information into the OpsMgr Operations console. The management pack comes with a variety of Dell-specific views you can use to quickly locate server hardware problems and assist in resolving these problems.
Figure 22.15 displays an example of monitoring using the State view of the Dell management pack.

Because the Dell management pack is fully integrated into Operations Manager, other standard views are available. Figure 22.16 shows Health Explorer monitoring information captured using the Dell management pack.

The Dell management pack is available at http://support.dell.com/support/downloads/download.aspx?c=us&l=en&s=gen&releaseid=R158716&formatcnt=1&libid=0&fileid=212055.
As with both HP and Dell, IBM also provides a hardware monitoring management pack for its xSeries Windows servers.
This management pack utilizes the Director agents deployed when installing a server with IBM’s Server deployment software.
Note: Recommended Director Agent Version
We recommend that you install version 5.20 or above of the Director agent on all managed servers prior to importing the IBM Director management pack.
The IBM Director management pack (which is sometimes referred to as the IBM Upward Integration Management Pack) provides server hardware status information via the Operations console. Similar to other hardware management packs, it enables monitoring to be extended beyond the software level.
IBM also provides a management pack for monitoring its BladeCenter chassis.
More information on the two management packs is available at http://publib.boulder.ibm.com/infocenter/eserver/v1r2/index.jsp?topic=/einfo/icmain.htm.
The Unisys management pack for its ES7000 hardware enables you to monitor the Service Processors on your ES7000 systems for information about system hardware alerts and status, including partition hardware health information.
You must install the OpsMgr agent software on the Unisys system, and the Service Processor must be running either Server Sentinel 2.0 or higher, or Unisys Server Management Services 1.0 or higher. Remember that there can be a delay of up to 20 minutes after you import and configure the management pack before the Operations console will display the new components. Available views include Active Alerts, Diagram, Partition Health, and Partition State. Figure 22.17 shows alerts running on a ES7000 system.

You will need to register with Unisys to get access for the download. You can download the management pack from https://www.support.unisys.com/pcproducts/InterfaceProducts/home.htm.
Since MOM 2005, Citrix has provided management packs for its MetaFrame and Presentation Server range of products.
The new Citrix management pack for OpsMgr 2007 facilitates the monitoring of Citrix Presentation Server 4.0 and above for Windows servers. The management pack consists of a variety of rules, scripts, and monitors used to detect potential issues, configuration points, and faults with the Citrix Presentation Server platform. Similar to most of the Microsoft-provided management packs, the Citrix management pack includes best-practice and configuration information and an excellent knowledge base along with the monitoring content.
You can download the Citrix management pack from MyCitrix. You must have an account with Citrix to download the management pack.
If you are interested in integrating OpsMgr with your help desk solution to create tickets based on OpsMgr alerts, we developed a technique that may lead you in the right direction. In our particular case, we wanted to create tickets in the Altiris help desk product (Altiris Helpdesk) based on specific alerts that occurred in OpsMgr.
Doing some web searches, we found a command-line tool to create help desk tickets for the Altiris Helpdesk product at http://juice.altiris.com/download/612/create-an-incident-using-a-command-line-tool. We downloaded this tool and determined the following as the required syntax:
CreateWorkitem -u:user -p:password -d:domain -h:host -w:workerGUID -o:objectGUID -t:title -c:comment -x:URLtext -l:URLlink
We then started down a path to use OpsMgr’s notification capabilities to create a command-line notification. We created a notification and recipient for an alert as described in the following steps:
The notification calls the script passing the required information to create the ticket. We used only the required parameters, so the actual syntax was as follows:
<LINELENGTH>90</LINELENGTH>CreateWorkitem -h:<AltirisServerName> -t:<Alert Name> -c:"Created by OpsMgr and <Alert Description>" -l:<WebConsole Link>
The items in brackets (“<>”) are parameters that can be pulled via the dropdown arrow on the screen.
Next, we define a recipient using OpsMgr’s notification device, and we define a subscription that specifies what alerts the recipients receive. Be sure to install hotfix #937470 (see http://support.microsoft.com/kb/937470) prior to attempting to define subscriptions that will not include all alert criteria.
When the alert occurs, it finds the subscription and sends a notification via the command-line script to create the ticket for the alert.
As a potentially simpler approach to this situation, the Altiris product appears to be able to generate help desk tickets based on email sent to a specified email address. The subject of the email provides the ticket name; the body of the email is the body of the ticket. This type of approach would not require command-line notification. The rest of the process would be the same (create a recipient and a subscription to send to this email address).
In addition to connecting to different management systems such as HP-OVO and Tivoli, as discussed earlier in this chapter, OpsMgr can monitor non-Windows systems (such as machines running Linux, UNIX, other non-Windows operating systems, and network devices) using third-party products.
Out of the box, OpsMgr is able to carry out limited monitoring of non-Windows systems (after all, it is primarily a Windows management suite). You can collect and monitor UNIX Syslogs, and you can add network devices to monitor for them up/down status.
Similar to MOM 2000 and MOM 2005, OpsMgr 2007 supports receiving of SNMP traps, allowing you to monitor devices capable of sending SNMP messages such as network devices, firewall appliances, and so on. We discuss SNMP-level monitoring in Chapter 17. You can also monitor TCP ports in OpsMgr 2007 using the TCP Port management pack template, which we explain in the “TCP Port Monitoring with OpsMgr” section later in this chapter.
In addition to the out-of-the-box functionality mentioned so far, a number of scripts are available that enable OpsMgr to ping devices and generate alerts should the devices not respond. A good example of these scripts is on the SystemCenterForum website at http://systemcenterforum.org/wp-content/uploads/MultiHostPing.zip.
Although this basic level of monitoring is adequate for many companies, it will not be sufficient for everyone. A number of third-party software vendors have developed products augmenting the monitoring capabilities of OpsMgr. The following sections look at four of these products and highlight others that are available. In addition, we will look in more detail at the TCP Port management pack template that is available out of the box in OpsMgr. The products we will discuss are as follows:
eXc Software’s management packs and virtual agents
Jalasoft’s Xian Network Manager IO
Quest’s Management Xtensions
nworks VMware Management
The eXc software and virtual agents provide the ability to monitor non-Windows and network devices from within the OpsMgr console. eXc Software has been developing custom management packs and virtual agents since the early days of MOM 2005. The eXc products provide seamless integration with the OpsMgr console and collect all aspects of health, such as performance information, availability, and system health.
The software supports monitoring of UNIX, Linux, SNMP devices, mainframe systems, applications, and databases (this is by no means an exhaustive list). In addition, eXc is very quick to assist in writing custom management packs and virtual agents for systems it does not currently support.
The eXc Software virtual agents are independent of the OpsMgr infrastructure. They can run on any management server or server hosting an OpsMgr agent. These virtual agents connect to the systems being monitored, but do not actually require any software to be installed on those systems. This means that there is very little impact on the monitored machines, and there is no need to install software onto a critical system such as a UNIX mainframe.
Another attractive feature of the eXc Software solution is that it is written in Jscript, and the user is not restricted from viewing the code. This allows competent developers to write their own code, further customizing the product as required.
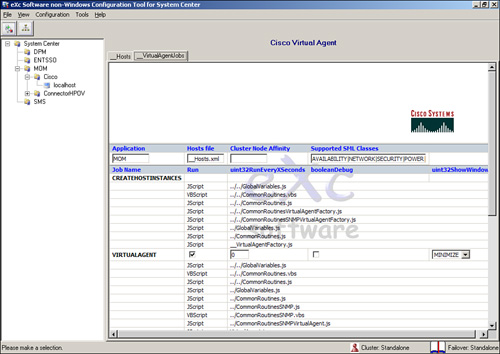
Figure 22.18 shows the eXc Software Administration console with the Cisco monitoring agents installed.
The eXc Software solution offers a cost-effective way to monitor non-Windows devices with OpsMgr and has a wide variety of virtual agents. We have found eXc to be very accommodating in developing additional virtual agents, should that be required.
An additional no-charge management pack from eXc is a dynamic map feature that works with OpsMgr. This is a topical and drilldown view of your device alerts, enabling you to see what is happening across your infrastructure throughout the globe. Each alert presents itself on the map relative to the latitude/longitude coordinates defined, and contains the device name and alert count extracted from Operations Manager as it occurs. You can use this virtual earth dynamic to drill down closer to the street, city, state, or county level to get more drawn-out or focused views. You can also create additional maps that call out individual locations and display multiple maps for various areas.
Figure 22.19 shows a dynamic map alert for our Odyssey environment.

eXc Software was recently acquired by Quest Software. Moving forward, you will see the eXc products included within the System Center offerings from Quest, although we understand support will stay within the eXc group. You may recall Quest previously bought Vintella.
Note: Another Mapping Technology
eXc is not the only one developing mapping software. Savision’s Live Maps product, launched in November 2007, allows you to create your own fully configurable maps and place OpsMgr objects in them. You can even turn an existing Visio diagram into a live monitoring map! Live Maps lets you put alerts and the state view into a single view, as well as create your own dashboard showing the state of your business process.
Live Maps comes with over 300 geographical maps and provides the ability to drop maps on each other to create nested maps. It is also integrated with the Operations console. Savision provides a Live Maps demo at http://www.savision.com/demo.
Jalasoft developed the Xian Network Manager IO product specifically for use with OpsMgr. The software is primarily designed to allow full monitoring of network devices through the OpsMgr Operations console.
Unlike product connectors, which simply run as a service and are typically administrated through the Operations console, Xian IO is actually a standalone application that runs alongside OpsMgr. Network devices are discovered and administered using the Xian IO console, and status, alerts, and performance data is passed to the Operations console for monitoring and reporting. This type of architecture is well suited to its purpose—large companies typically have many network devices, and this type of architecture does not put unnecessary strain on the OpsMgr environment.
Xian IO is designed from the ground-up to monitor and maintain network devices, but it can also monitor non-Windows operating systems such as Solaris and other flavors of UNIX.
In Figure 22.20, we display the Xian IO console. Although you will perform installation and configuration with this console, remember the OpsMgr Operations console is used for monitoring. Notice the standard views available for a number of third-party servers and devices.

The software uses policies, which define exactly what information to collect from a device and what the performance thresholds should be. You define these policies in the Xian IO console, and they are applied to devices according to device type. To configure a policy, navigate to the Policy Templates node shown in Figure 22.21 (on the left side of the screen).

You can create your own policy templates or use the default policies. Policies are applied either to devices already discovered, or to single devices or groups of devices as they are discovered. Right-click the object type (in this case we will select the Cisco switch). You can select New to display the policy options screen in Figure 22.22. There is a large number of different policy items, which you can apply to a single policy.

This is an example of just one of the devices you can monitor using Jalasoft. Currently, Jalasoft provides management packs for the following devices:
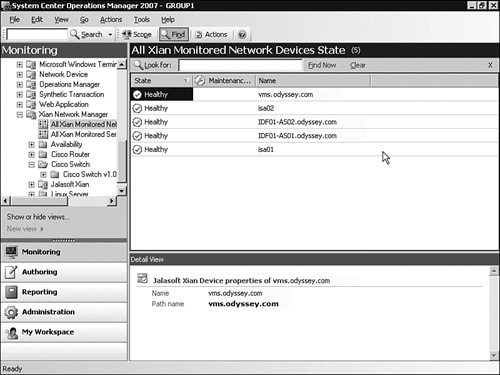
Figure 22.23 shows the Xian Monitored Network Devices State in the Operations Manager Operations console. Other views available include discovery diagrams and performance views.
Another key feature of Xian IO is the powerful Smart Management Pack Generator tool, which enables creating custom management packs for the Xian IO tool. Provided you have access to the .mib file for the device (usually obtainable from the hardware/software manufacturer), you can use the tool to create a Xian IO management pack for your device. This enables the Xian tool to be more dynamic, and it reduces the demand on the Jalasoft development team to develop management packs for uncommon devices.
In conclusion, the Jalasoft software is to be commended for its excellent user interface and ease of configuration. Its integration into OpsMgr is very impressive and appears nearly seamless. Providing the Management Pack Generator tool to create custom management packs offers increased flexibility, although you should not expect the level of monitoring you see with Jalasoft management packs in the ones you create yourself.
However, due to the product’s complexity, it has a limited selection of monitored devices and may not be adequate for all environments. This is a small complaint though, and overall the Jalasoft Xian software is excellent.
The Quest Management Xtensions software, originally designed for MOM 2005, was formerly known as Vintella Systems Monitor. Unlike eXc Software and Jalasoft, Quest Management Xtensions uses an agent that you install on the monitored system.
Quest Management Xtensions are designed to monitor UNIX and Linux systems. They accomplish monitoring by means of a specially designed agent and a set of rules and scripts managed by the product, deployed to the managed systems as required.
One of the defining features of the Quest Management Xtensions is the ability to author rules and scripts similar to how you would in OpsMgr for a Windows agent. These custom rules are distributed to the appropriate managed machines alongside the default set of rules supplied with the product.
The Quest Management Xtensions software is also designed to be secure, including mutual authentication support to ensure that the UNIX/Linux agent you are communicating with is a trusted machine. We discuss mutual authentication and how it relates to OpsMgr in Chapter 11.
The Quest software is more difficult to configure than eXc or Jalasoft, but it is unique because it has a dedicated agent that resides on the monitored machine. It allows custom rules to be created and deployed to the monitored machines as if they were Windows devices, which is an excellent feature.
Many businesses now are beginning to realize that, thanks to virtualization, server hardware in many cases is an unnecessary expense. Server virtualization is the idea of hosting multiple “logical” servers on one piece of “physical” hardware. These logical machines are each a server (or workstation) in themselves, and they are managed and segregated through virtualization software. Two main software companies offer operating system virtualization products: Microsoft and VMware.
The Microsoft offering for managing large enterprises is System Center Virtual Machine Manager (SCVMM). SCVMM extends the basic capabilities of Virtual Server management into a more scalable solution. It offers centralized virtual machine management across hundreds or even thousands of physical machines, and it can handle thousands or even hundreds of thousands of virtual machines. We discuss Virtual Machine Manager integration with OpsMgr in the “Integrating OpsMgr 2007 with Other System Center Applications” section of this chapter.
VMware has been working in this arena longer than Microsoft, and it is somewhat better established. Its software comes in a number of flavors, but the most commonly seen in the enterprise space is GSX and ESX server.
Although you can manage a virtual machine by simply deploying the OpsMgr agent as if it were a physical server, the layer that manages the virtualization is more difficult to monitor. This is particularly true when using the VMWare ESX product. This product is hosted on a modified Linux kernel and thus does not even provide an environment where an OpsMgr agent can exist.
This is where nworks comes in. The nworks management pack and collector software allows data collection and monitoring of the VMware virtualization environment. Using this management pack, you can obtain information about the VMware environment, the virtual machines, and the health of the VMware server itself.
This solution further enhances OpsMgr by allowing it to integrate with VMware GSX and ESX servers, and with the VMware VirtualCenter application that manages all VMware servers and virtual machines in your environment. The information collected by the nworks software integrates into the Operations console, giving you a holistic view of your virtualized environment in addition to your physical systems. In Figure 22.24, we see the health of two (agentless) host machines monitored by the nworks management pack. The add-on application converts VMware instrumentation into WMI for Operations Manager.

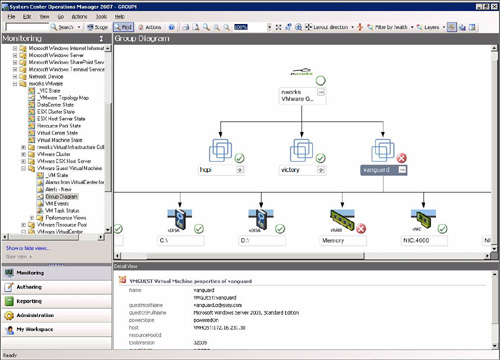
Monitoring VMware installations are becoming more important as virtualization becomes more popular. The nworks software offers an excellent level of monitoring for a VMware environment. Not only can we monitor the health of hosts, as shown in Figure 22.24, but we can monitor the virtual resources of the guest machines, as in Figure 22.25, which displays a group diagram for three monitored VMware guest machines running on the hosts shown in Figure 22.24.
The only drawback is for those organizations that are not heavily using virtualization, because the product is a little pricey when a basic level of monitoring can be achieved by using OpsMgr agents on the virtual guests. Event and service monitoring can also be carried out when using VMware GSX Server, which is hosted on a Windows Server.
Tip: Monitoring VM ESX Using SNMP and Telnet
VMware ESX 3.x/VI3 includes a variety of methods for collecting critical performance and configuration data including SNMP, Syslog, ESXTOP utility (using ssh), the SDK Web Service, and the ESX COM API, which is now deprecated.
For those of you without the budget to license nworks, Jonathan Hambrook has created a 60-page how-to guide taking users through the configuration of basic ESX monitoring using SNMP and Telnet. You can download his guide at http://www.mediamax.com/opsmgr/Hosted/Monitoring%20ESX%20on%20SCOM%202007%20v2.2.pdf (we also include this link in Appendix E as a live link).
In addition to the Microsoft-created management packs for OpsMgr 2007, Microsoft provides a number of management pack templates. These templates enable you to create all the items necessary to carry out synthetic monitoring of TCP ports, database connections, websites, and ASP.NET applications.
Creating items using these templates is very simple and wizard based, with OpsMgr automatically creating all the complex items required to carry out the actual monitoring. In this section, we will create a monitoring object to monitor a TCP port. The TCP Port template is one of the most appropriate monitoring templates to use when configuring monitoring for systems without agents, because it has no dependency on an agent.
You can use this template to monitor ports on network devices. As an example, consider an SMTP relay device, where you can test port 25 to ensure the device is responding and that the email port that services the primary function of the device is working.
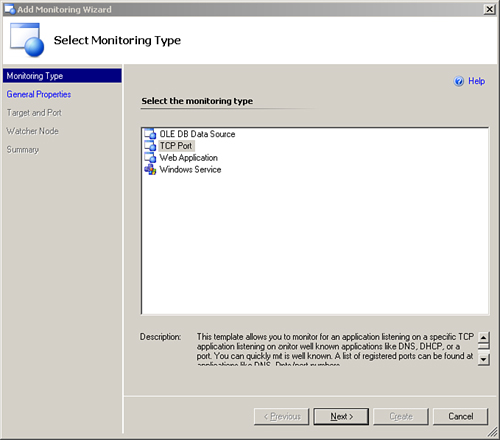
For this example, we will create a TCP port monitor that monitors port 25 on an email device that is not running Windows and therefore cannot host an agent. Perform the following steps:
In the Operations console, navigate to Authoring -> Management Pack Templates.
Right-click and select Add Monitoring Wizard. You will be presented with the screen shown in Figure 22.26.
Click Next and give the monitor a name. We will call our monitor E-mail Relay Device Port Monitor. You can enter a description if you like. We will save the new object to our Sample Management Pack, as shown in Figure 22.27. Click Next.
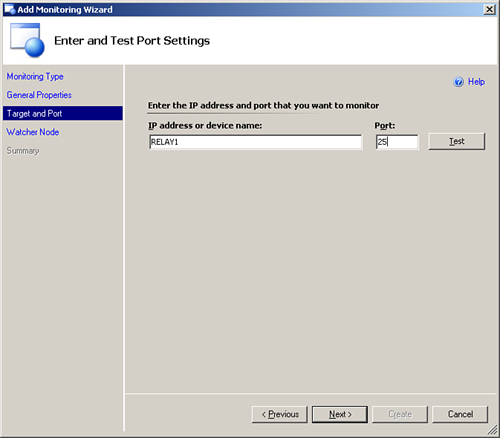
You are now prompted to enter the IP address or device name of the device to be monitored and the TCP port.
The device name is only appropriate if you have DNS configured correctly; otherwise, you should enter the IP address. We will use a device called RELAY1 and a Port setting of 25 (which is the default port for SMTP mail). You can click the Test button to verify that the port is working. Figure 22.28 displays this screen.
Click Next to proceed to the Choose Watchers Node screen of the wizard. Here, you have the option to configure the machine that should run the test. This machine is a watcher node. You will notice that the computers listed here all have the OpsMgr agent deployed because the agent is required to initiate the test. We will select the PANTHEON.ODYSSEY.COM server and leave the frequency of the test at the default setting of 2 minutes. See Figure 22.29 for the Choose Watcher Nodes screen.
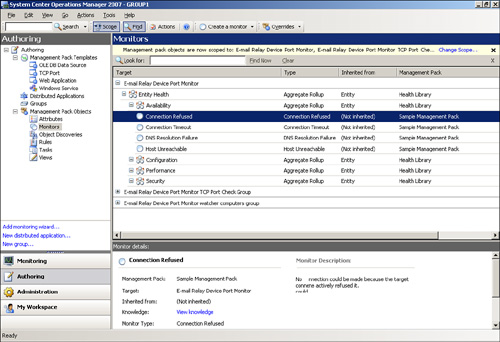
Click Next to review the summary information; then click Create to create the monitoring object. Figure 22.30 shows the object we created.
The individual objects created automatically by OpsMgr are shown in Figure 22.31.
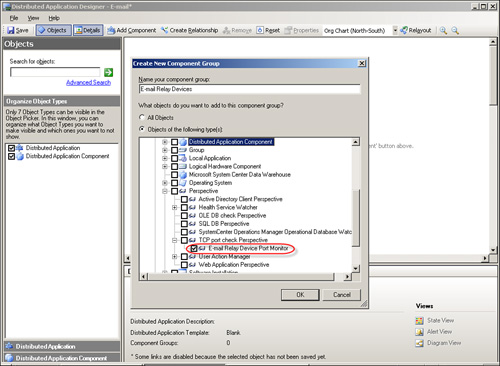
Notice in Figure 22.32 that we have a class object. This means you can add this TCP Port test to other management packs—for example, a distributed application (DA).
Creating a TCP Port enables synthetic tests to be carried out in addition to standard monitoring. State is reflected in a distributed application created to monitor the platform for which this device is a member.


You can collect Syslog messages based on certain criteria, such as a collection rule. You can also respond to a Syslog message by using an alert-generating rule to generate an alert, run a script, or run a command. To utilize either of these rule types requires the following:
Identifying OpsMgr agents that will listen for Syslog messages. These agents will be the targets (destination) for deploying collection rules or alert-generating rules.
The agents the Syslog monitoring rules are deployed to will listen on UDP port 514. This requires that your UNIX hosts are configured to forward Syslog messages to the appropriate agent. Note that OpsMgr can only use the default Syslog listening port of UDP 514.
To configure a rule, perform the following steps:
In the Operations console, select the Authoring space and then navigate to Management Packs -> Rules.
In the Actions pane, select Create a Rule. The Create Rule Wizard will appear. Click a management pack in the Select a destination management pack list (preferably not the Default management pack).
In the Select a type of rule to create box, expand Event Based and then click Syslog (Alert). Click Next.
In the Rule name box, type the name you want to use for this rule and then select a rule target such as Agent.
Click Next. Then define the criteria under which the alert response will be generated using the Filter one or move events option. To create an alert for the Cron daemon that generates a Critical severity condition, enter the following values and then click Next:
Parameter Name: Facility
Operator: Equals
Value: 9
In the Alert name box, type the name you want to use for an alert, click an alert priority in the Priority list, and then select a severity level in the Severity list. If you want to configure alert suppression, select Alert Suppression, configure how you want to handle duplicate alerts, and then click OK.
In the Alert description box, you can configure the display of the Syslog message by using an Alert string. Displaying the Syslog message would use the
$Data/EventData/DataItem/Message$Alert string.Click Create to create the rule when you are finished defining the alert information.
Table 22.2 displays a list of facility values, whereas Table 22.3 lists severity values. This information is also available at http://support.microsoft.com/kb/942863.
Table 22.2. Table of Facility Values
Facility | Description | Value |
|---|---|---|
Kernel | Kernel messages | 0 |
User | User-level messages | 1 |
Mail system | 2 | |
Daemons | System daemons | 3 |
Auth | Security and authorization | 4 |
Syslog | Syslog internal messages | 5 |
LPR | Line printer subsystem | 6 |
News | Network news | 7 |
UUCP | UNIX-to-UNIX Copy Program | 8 |
Cron | Cron daemon | 9 |
Auth2 | Security and authorization | 10 |
FTP | FTP daemon | 11 |
NNTP | Network Time subsystem | 12 |
LogAudit | 13 | |
LogAlert | 14 | |
Cron2 | Cron daemon | 15 |
Local0 | Local use 0 | 16 |
Local1 | Local use 1 | 17 |
Local2 | Local use 2 | 18 |
Local3 | Local use 3 | 19 |
Local4 | Local use 4 | 20 |
Local5 | Local use 5 | 21 |
Local6 | Local use 6 | 22 |
Local7 | Local use 7 | 23 |
The list of alert strings includes the following:
$Data/EventData/DataItem/Facility$$Data/EventData/DataItem/Severity$$Data/EventData/DataItem/Priority$$Data/EventData/DataItem/PriorityName$$Data/EventData/DataItem/TimeStamp$$Data/EventData/DataItem/HostName$$Data/EventData/DataItem/Message$
In this chapter, we have looked at approaches you can take to integrate OpsMgr into an existing management infrastructure utilizing product connectors to connect OpsMgr to other management suites. We also looked at no-cost third-party–created hardware management packs available from the hardware vendors, and we discussed monitoring non-Windows systems using additional third-party applications.
Although these capabilities are very important, it is also important for OpsMgr to integrate with existing and future products, in particular other System Center products such as System Center Service Manager and System Center Virtual Machine Manager. This section looks at what integration is currently available and the integration planned during the life cycle of OpsMgr 2007.
Microsoft is committed to systems management and therefore it has and will continue to invest heavily in the System Center suite of tools. Currently, the Systems Management area of the System Center family consists of the following tools:
Operations Manager
Configuration Manager
Data Protection Manager
Virtual Machine Manager
Essentials
Capacity Planner
Service Manager
Although this list does not document the entire suite of System Center tools, it does represent the major tools in the Systems Management area, which is where OpsMgr is firmly focused.
In terms of integration with OpsMgr, unfortunately, the majority of the integration is planned for future releases, although we see great potential as we discussed in Chapter 20, “Automatically Adapting Your Environment.” That is not to say that OpsMgr cannot monitor the aforementioned products, because it can. Some of these management packs, such as the Virtual Machine Manager (SCVVM) management pack, have been released, although not all management packs are currently available.
Management pack integration varies greatly depending on the product and management pack in question. Take, for example, the old SMS 2003 management pack (and the Configuration Manager management pack). The SMS management pack provides the ability to monitor individual packages and advertisements from within the Operations console. It includes a number of tasks that makes it easier and quicker to manage SMS, and it enables a large number of SMS tools and features to be accessible through the OpsMgr Operations console.
The Virtual Machine Manager management pack provides some impressive levels of management pack integration. The level of monitoring provided by the SCVMM management pack includes the following capabilities:
Health and availability of the Virtual Machine Manager service and database
Health and availability of Virtual Machine Manager agents
Health and availability of self-service Web servers supporting virtual machine self-service in VMM
Significant status changes for virtual machines in Virtual Machine Manager
Monitoring virtual machine health and availability through warnings, errors, and critical errors raised by Virtual Server
Reports showing virtualization candidates, virtual machine allocation, virtual machine utilization, host utilization, and host utilization growth
True integration, however, is something altogether different. The sort of integration we hope for is the type of bidirectional communication intended between OpsMgr and Service Manager, as an example. Although this level of integration does not appear to be in the first release of the SCVMM management pack, it certainly is the direction in which Microsoft is heading.
Tip: Operations Manager and Forefront Security
Microsoft Forefront provides a comprehensive security product portfolio. Even though the current version of Forefront does not integrate with OpsMgr 2007 (although it works with MOM 2005), Microsoft recently announced an upcoming version of Forefront, code-named “Stirling.” Stirling will be a single product delivering unified security management and reporting. Microsoft plans that Stirling will be tightly integrated with the existing infrastructure, including Active Directory and System Center.
This chapter discussed a variety of ways to integrate Operations Manager 2007 with diverse platforms and technologies. We looked at the OpsMgr connected management group architecture and the process for connecting two management groups together. We examined the concept of OpsMgr product connectors and looked in detail at the Engyro OpsMgr to OVO and Tivoli connectors in particular, because these connectors appear to be the most widely utilized.
We highlighted some of the no-cost third-party management packs that are available to further enhance monitoring in OpsMgr and extend monitoring to physical server and storage hardware. We also looked at the products that are available to monitor non-Windows systems and network devices using OpsMgr, including products offered by Jalasoft, eXc Software, Quest, and nworks.
Finally, we discussed integration with OpsMgr and the current role management packs play in integrating software applications with OpsMgr. We also looked at Microsoft’s recent release of System Center Virtual Machine Manager and the associated management pack for OpsMgr 2007, and we discussed some of the integration we hope to see in future versions of these products and other Microsoft products such as Service Manager.
The next chapter discusses extending OpsMgr in a different direction, by creating your own management packs and reports.