
In this chapter, we discuss deploying Operations Manager 2007 (OpsMgr) to extend your monitoring reach to those computers and devices not running a Windows operating system. If you have a computer running a Windows operating system that you want to manage, of course you will deploy an OpsMgr agent to that system, or possibly set up that computer for agentless monitoring.
However, what if there are computers not running Windows operating systems? And how do you monitor devices that are not computers—devices that users depend on to get their work done, such as printers and network switches? You cannot deploy the OpsMgr agent to these non-Windows computers and devices, nor can you employ agentless monitoring. In both cases, the answer is to use the Simple Network Management Protocol (SNMP) monitoring features built into OpsMgr. In OpsMgr 2007, network devices are non-Windows computers and other devices managed with SNMP.
We strongly suggest that OpsMgr administrators monitor network devices alongside the computers in their organization. A fundamental concept of End-to-End (E2E) service monitoring is knowing the health of the devices between the major components delivering the service. Integrating network device status into health models of service delivery can tell a story and save hours of troubleshooting.
This chapter begins with a brief primer on the SNMP protocol itself, because the OpsMgr network device monitoring features are wrapped tightly around SNMP. We will then discover several SNMP-enabled devices on our managed networks and add those devices as objects to our management group. We will also spend some time on the basic network device monitoring features included with OpsMgr, receiving SNMP traps and viewing them in the Operations console. In addition, we will build-out our SNMP management capability by importing several hardware management packs and creating some custom SNMP-based rules and monitors.
In an electronic world that seems to always have competing standards—from longstanding Windows vs. Mac rivalries, to today’s Blue-ray vs. HD-DVD media formats—there does exist a lingua franca among the intelligent machines of the world. That common language is SNMP, a protocol designed in the late 1980s to facilitate the exchange of management information between networked devices.
The Simple Network Management Protocol is popular not only because it is truly simple in its operation, but because it is easy for manufacturers and vendors to use SNMP technology to add network management functions to their products. The SNMP architecture contains three entities:
Managed device—. Any piece of equipment connected to the data network that is SNMP compliant. These devices are also referred to as network elements.
SNMP agent—. A network management software module residing in a managed device. The agent collects data from the managed device, translating that information into a format you can pass over the network using SNMP.
Network Management System (NMS)—. An application that monitors and controls managed devices. The NMS issues requests, and devices return responses.
Communication channels in the SNMP architecture are narrowly defined. A network management system will exchange three primary types of messages:
SNMP Get—. Used by the NMS to retrieve one or more values from a SNMP agent by a read-only process. The get command is often used on a scheduled (synchronous) basis to verify the status of a managed device, in a process referred to as polling.
SNMP Set—. Used by the NMS to change the values of variables stored within the managed device, controlling the device by changing its settings.
SNMP Trap—. An unsolicited (or asynchronous) message sent from the agent to the NMS, often indicating a warning or error condition. When certain types of events occur, a managed device sends this immediate notification to the NMS.
Each of the primary SNMP message types (get, set, and trap) is associated with a community name, which is just a text string used like a password to authenticate the message sender. Figure 17.1 illustrates the interaction of the three components of the SNMP architecture and the three primary types of SNMP messages.

The left side of Figure 17.1 shows a NMS, and the right side has a managed device with a SNMP agent. In the case of most network hardware, the agent comes integrated into the firmware or Internetwork Operating System (IOS) of the managed device; you merely are able to enable and configure the agent, or disable it. Computers, including Windows computers, often have a separate SNMP agent software component you must install or add to the operating system.
Notice in Figure 17.1 that the SNMP set and get messages originate with the NMS, and each message is authenticated by a unique community string. All SNMP trap messages originate with the agent and are authenticated by a community string. Several configuration steps are necessary on both the NMS and the agent to prepare the communication channels. Here are the fundamental concepts for making these SNMP communications work:
SNMP Get and Set—. The agent settings will define the NMS as an authorized SNMP manager. You can configure agents to respond to several specified managers. Read-only and Read/Write permissions are defined using two or more different community strings. The agent processes incoming SNMP get and set commands from the NMS when the source is an authorized manager and when the community string(s) match those the agent is set to allow.
SNMP Trap—. The agent is configured to send traps to one or more specified Network Management Systems, the NMS being the trap destination(s). The NMS is prepared to expect traps from a particular agent (this sometimes is referred to as creating a trap receiver on the NMS). Traps are sent by the agent using a specified community string. The traps are processed by the NMS if a trap receiver has been prepared for that device with that particular community string.
OpsMgr natively supports the SNMP get and trap mechanisms. As we proceed through this chapter, we will refer back to these SNMP architecture fundamentals as we cover the corresponding OpsMgr components.
Effectively managing network devices via SNMP with OpsMgr also involves knowledge of MIBs and OIDs:
A MIB (Management Information Base) is analogous to a mini-management pack for a network device. It is a collection of attributes and characteristics that describe the configuration and operation of a managed device. A MIB is organized in a hierarchical tree with a nameless root. MIBs are authored by equipment vendors and distributed as text files that a NMS can compile and import.
An OID (Object Identifier) is a unique label within the MIB hierarchy. OIDs at the top of the MIB tree belong to different standards organizations, whereas different associated organizations such as hardware vendors assign lower levels. This means that a higher-order OID (with a smaller and shorter OID name) is more generic and applies to all or most managed devices, whereas a lower-level OID (with a longer name) is specific to a particular vendor’s devices.
Figure 17.2 is a graphical representation of a MIB tree to help you understand how the OID for a particular object is derived. Notice the unnamed root at the top of Figure 17.2 represented by a tree symbol. Each MIB object in successively lower levels of the tree is represented by both a name and a number. To identify any particular MIB object, you describe the path through the MIB tree to arrive at the specific object. This is usually done by appending the numerical codes assigned to the objects at each preceding level in the MIB tree.
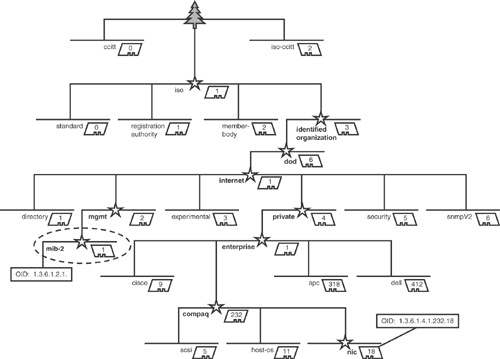
Flowing down from the MIB tree root in Figure 17.2, little stars have been added in the figure at each branch of the tree to help you trace two selected OIDs. On the lower left, notice the “mib-2” OID that is circled—the numerical OID is 1.3.6.1.2.1, which represents the path followed down the MIB tree from the root to arrive at that object. The MIB-2 OID is important because it is used by all SNMP-compliant devices, regardless of the vendor. The MIB-2 OID is like a universal passport for network devices that identifies the name and type of device, and provides some convenient location, contact, and networking information to enable basic management of any SNMP-compliant device.
The second OID we call attention to in Figure 17.2 is the compaq.nic OID, which is in the lower right of the figure. The OID of 1.3.6.1.4.1.232.18 uniquely represents the collection of variables and data associated with the network interface card (NIC) in a HP/Compaq server. In Figure 17.2, we include a few other vendors’ enterprise OIDs, such as Cisco (1.3.6.1.4.1.9), APC (1.3.6.1.4.1.318), and Dell (1.3.6.1.4.1.412). Each vendor has its own enterprise OID, and the vendors are pretty much free to create whatever subordinate levels of OIDs are appropriate for their products. You can enable OpsMgr 2007 to interact with OIDs other than MIB-2, such as the enterprise OIDs, by importing vendor-supplied hardware management packs or by creating custom SNMP rules and monitors.
OIDs are not always associated with hardware; software vendors often incorporate SNMP monitoring features with their products. This permits software applications to be monitored by any industry-standard SNMP Network Management System (NMS). Examples here include Microsoft, whose operating systems use the enterprise OID 1.3.6.1.4.1.311, and Symantec (Veritas), which is assigned enterprise OID 1.3.6.1.4.1.1302. That OID is used with the company’s popular Backup Exec software products.
The next sections discuss the basics of using OpsMgr network device management features. It is quite simple with OpsMgr 2007 to discover network devices running SNMP agents; all you need to know is a SNMP community string recognized by the devices. It is somewhat more time-consuming to prepare the devices for OpsMgr to discover them than to actually perform the discovery.
After you discover a device, administrative tasks that you can later perform include changing the proxy agent (watcher node) for the device and deleting the device from the management group.
Two activities are required to bring a network device into management with OpsMgr:
Preparing the device for discovery
Performing the discovery
You can discover devices with the Discovery Wizard in the Operations console, as well as via the command line using PowerShell.
Network devices cannot be discovered by OpsMgr until they are prepared to be managed using SNMP. Here are the steps to perform before running the Discovery Wizard or using PowerShell to bring the devices into your management group:
Enable the SNMP agent component.
For simple, common-use devices such as network printers, SNMP is often enabled by default. More complex equipment (for example, security-sensitive devices such as firewalls) usually have SNMP disabled by default. Non-Windows computers may require the installation of optional SNMP components to enable SNMP agent functionality.
Permit SNMP community names.
As we described in the “SNMP Architecture” section of this chapter, the SNMP set, get, and trap communications are authenticated with a text string known as the community name. Many devices have their SNMP agent configuration prepopulated with the string public being authorized for read-only access. Unless you have a very small network without any devices exposed to the Internet, it is a best practice to change the public read-only SNMP community name to some other string. SNMP community names are always transmitted across the network in clear text, so they are quite easy to intercept. The SNMP protocol has primitive security; anyone who knows or guesses the SNMP community name can query your devices and get quite a lot of configuration information about them.
OpsMgr 2007 natively only uses read-only SNMP functionality; however, if you will be importing third-party hardware management packs that use the SNMP set command, or plan to create custom tasks that use SNMP sets, you will also need to create write-access community names on your devices.
Tip: SNMP set Commands Are Not Secure
OpsMgr 2007 utilizes the SNMP V2(c) standard, or version 2 of the SNMP protocol based on community strings. (Service Pack 1 will include support for SNMP V1 as well.) SNMP V2(c) transmits community strings in the clear over the network; so if you send a SNMP
setcommand, that write-capable community string can be easily intercepted by unauthorized parties using network monitoring tools. Although including SNMPsetcommands in OpsMgr tasks and responses offers great convenience and extensibility, there is also a security risk. Larger and very security-conscious environments should probably shy away from using SNMPsetcommands. SNMP V3 is a new standard that includes an authentication process, but OpsMgr 2007 does not support that version at this time.Enable permitted SNMP managers.
As a security feature, many SNMP-enabled devices allow you to modify the SNMP agent configuration to respond only to SNMP
getandsetcommands from a list of particular network addresses, referred to as the permitted, or authorized, SNMP managers.This may not be necessary for very small networks. The large enterprise probably will want to lock down the addresses your network devices accept SNMP communications from, certainly in the case of your high-value and security-sensitive devices. You would include the addresses of your Root Management Server (RMS) and the OpsMgr Agent Components that will be the proxy (watcher node) for the device(s).
Populate useful MIB-2 OIDs.
When OpsMgr discovers a network device, the object name you see in the Operations console is the IP address of the device, which is not particularly useful in determining what device it is! The values of these particular MIB-2 OIDs are important in helping you manage the devices with OpsMgr:
Device Name
Device Description
Device Contact
Device Location
Although the vendor sets the Device Description, you generally can change the Device Name to something more meaningful, and you can always populate the Device Contact and Device Location OIDs with local information that is useful to support staff. Using a network printer as an example, the Device Location could be an office or room number, and the Device Contact could be the name and telephone extension of the employee whose desk is closest to the printer.
Enable the sending of traps.
If you will be creating custom event rules that alert on receipt of traps from the network device, you can optionally enable sending traps. You should not enable sending traps from a device unless you are certain that OpsMgr has an alert rule for that device (called a trap destination). Otherwise, OpsMgr will receive traps it is not expecting, thus creating unnecessary overhead for the management group. Most network devices give you the option of entering one or more SNMP trap receivers.
If you plan to use this feature in your management group, configure the device’s trap destination with the address of the proxy agent (watcher node) you are assigning to the device.
Tip: OpsMgr RTM Only Finds SNMP V2 Network Devices Using the Network Device Discovery Process
Although some network devices respond to the GET packets that SNMPUTIL sends, OpsMgr 2007 cannot discover the devices and therefore cannot manage them.
This occurs because the base or RTM version of OpsMgr 2007 only supports SNMP V2. Devices that do not support this version of SNMP ignore the GET packets sent by Operations Manager. Because SNMPUTIL supports SNMP V1 and V2, you may get a response using SNMPUTIL but not be able to discover the devices using OpsMgr.
See http://support.microsoft.com/kb/939364 for more information, as well as information regarding a hotfix. After the hotfix is applied, the Discovery Wizard will use SNMP V1 to detect those particular network devices.
Microsoft has announced support for SNMP V1 devices with Service Pack 1.
After you have prepared network devices for discovery, perform the following procedure to add them to the management group using the Operations console:
Log on to the computer with an account that is an OpsMgr Administrator and open the Operations console.
Click the Administration button, and at the bottom of the navigation pane, click the Discovery Wizard link.
On the Auto or Advanced page of the Computer and Device Management Wizard, select Advanced Discovery.
In the Computer & Device Types list, select Network Devices.
In the Management Server list, take care to specify which management server (or gateway server) will perform the discovery. If you have more than one management server or any gateway servers in this management group, they will be available for selection in the list.
Select a server that has direct network connectivity to the devices you want to discover. Figure 17.3 shows you can select from five servers in the management group to perform the discovery. We select a gateway server, gryphon.draco.com, because the network devices we want to discover are on the remote network, in the untrusted domain of draco.com.
On the Discovery Method page, enter the starting and ending addresses of the IP address range you want to scan. Note that the maximum number of IP addresses you can have in the range is 50,000, and the interface only returns a maximum of 1000 discovered devices. If you have more than 50,000 addresses to scan or more than 1000 devices to discover, you will need to subdivide the range and run the wizard several times.
In the Simple Network Management Protocol (SNMP) Community Strings box, type the read-only community string you have prepared your network devices to accept. In Figure 17.4, we show the wizard ready to scan the IP range of 172.16.231.94 to 172.16.231.99, because we know that range contains the devices we want to bring into management. We have also changed the default community string from public to umbrella, a random codeword selected to use on that network as the SNMP read-only community string.
Click the Discover button and wait several moments while the selected management server or gateway server performs the discovery task.
Discovery runs for a maximum of 60 seconds. The time it takes for discovery to complete will depend on a number of factors, including the criteria you specified and your particular Information Technology (IT) environment and topology.
After the discovery task completes on the selected server, you are given a list of discovered devices. Any devices already managed by the management group are not included in the list.
Place a check mark next to the devices you want to manage, or click the Select All button. Figure 17.5 shows the results of our scan for network devices on the draco.com network. The scan discovered four devices, listed only by their IP addresses. We selected all four devices in Figure 17.5.
If the management server or gateway server that performed the discovery will be monitoring the devices, click Next to continue through the wizard.
To specify a different computer to act as the watcher node, notice the circled Proxy Agent setting and Change button in Figure 17.5. Click Change, then select the computer you want to be the proxy agent for the selected objects. The proxy agent can be any agent-managed computer or management server in the management group. It must have SNMP (an optional component for Windows) installed, as well as direct network connectivity to the network objects it will manage.
Click Next, and you will get a final Summary page confirming the number of network devices that will be added to the management group. Click Finish.


Almost immediately, the new devices will appear in the Monitoring space of the Operations console. Because the Discovery Wizard does not provide any details other than the IP address of the devices we choose to manage, you should verify the device properties in the Monitoring space to confirm these devices are indeed the ones you intended to manage. Figure 17.6 shows the Network Devices State view in the Monitoring space. We selected one of the newly added devices (172.16.231.96) so that we could see its properties in the Detail View pane.
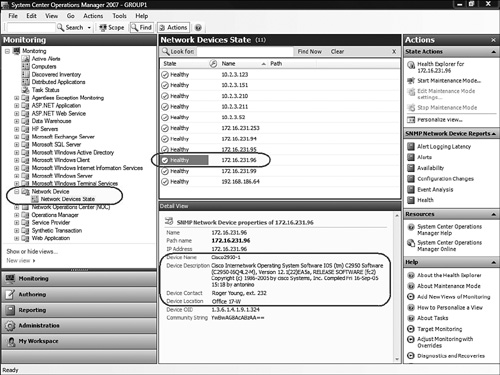
Notice in Figure 17.6 that the Device Name, Device Description, Device Contact, and Device Location settings (circled) are exposed in the view, making it easy to identify the device. This device is a Cisco switch, and it is one of the devices we expected to discover. Notice also that the Device OID begins with the Cisco enterprise OID 1.3.6.1.4.9 we included in the MIB tree in Figure 17.2. Below the Device OID, see the strange community string YwBwAG8AcABzAA==. We know we used the community string umbrella for this device! That strange community string is a security enhancement and is a mask added by the console to hide the actual community string.
As an alternative to using the Discovery Wizard in the Operations console, you can use a series of PowerShell commands to perform the same work. Here is a sequence of PowerShell cmdlets you could use to discover and add network devices to the management group from the command line. (We italicize the portions of the command lines that you would modify to fit your environment.)
Use the
get-MonitoringClasscmdlet to create a monitoring class for network devices. Here we store the monitoring class in the$networkdeviceclassvariable:<LINELENGTH>90</LINELENGTH>$networkdeviceclass = get-monitoringclass -name 'System.NetworkDevice'
Next, use the
new-DeviceDiscoveryConfigurationcmdlet to specify an IP address range with the monitoring class just created. The result is stored in the$dcvariable, and will be used withstart-Discoveryto retrieve corresponding device information.In this case, we are scanning the IP address range 172.16.10.1 to 172.16.10.10.
<LINELENGTH>90</LINELENGTH>$dc = New-DeviceDiscoveryConfiguration -monitoringclass $networkdeviceclass-fromipaddress 172.16.10.1 -toipaddress 172.16.10.10
Now, the
new-Objectcmdlet is used to set theReadOnlyCommunityproperty to the community string accepted by the devices we want to manage. On this network, the SNMP read-only community string is venti.<LINELENGTH>90</LINELENGTH>$encoding = new-object System.Text.UnicodeEncoding $encodedCommunityString = $encoding.GetBytes("venti") $dc.ReadOnlyCommunity = [System.Convert]:: ToBase64String($encodedCommunityString)The
get-ManagementServercmdlet gets an object representing the RMS and stores a reference to it in the$managementServervariable.<LINELENGTH>90</LINELENGTH>$managementServer = Get-ManagementServer -Root: $true
Next, we can perform discovery using the
start-Discoverycmdlet. We provide it with the configuration objects$managementServerand$dcbuilt using the previous commands. The results of the discovery are stored in the$discovery_resultsvariable.<LINELENGTH>90</LINELENGTH>$discovery_results = start-discovery -ManagementServer: $managementServer-DeviceDiscoveryConfiguration: $dc
This command line pipes the discovery results to the
select-Objectcmdlet, which selects and expands theCustomMonitoringObjectsproperty. Figure 17.7 shows the PowerShell window with the expected responses from steps 4 through 6 and indicates that four devices were discovered. (Steps 1 through 3 will not provide feedback at the command line if they are successful.)<LINELENGTH>90</LINELENGTH>$discovery_results | select-object -expand custommonitoringobjects
We will now use the
get-Agentcmdlet to retrieve a reference to the proxy agent that will monitor the network devices, and we store the reference in the$agentvariable. We select the computer THUNDER.odyssey.com as our proxy agent for the new devices.<LINELENGTH>90</LINELENGTH>$agent = get-agent | where-object {$_.Name -eq "THUNDER.odyssey.com"}Last, we use the
add-RemotelyManagedDevicecmdlet to add the network devices to the agent. We pass to the cmdlet the previously created variables for theproxyagentand the expanded list ofcustommonitoringobjects.<LINELENGTH>90</LINELENGTH>add-remotelymanageddevice -proxyagent $agent-device $discovery_results.custommonitoringobjects

Figure 17.8 shows the expected success output of steps 7 and 8. Details on the first two of the four newly discovered devices are visible in the PowerShell screenshot. After these PowerShell commands have been executed, the new network devices will appear in the Operations console, just as if they were discovered with the Discovery Wizard.

You can combine these command lines into a PowerShell script if desired, running them as a single procedure.
Tip: On the CD
We have consolidated these commands into the PowerShell script Discover-and-Add-Network-Devices.ps1, which is on the CD accompanying this book. You will need to customize the cmdlets for your particular environment.
You can also enter the commands individually, but only in the same PowerShell instance—because the command lines pass variables from one to the next, and the temporary variables only exist while that PowerShell instance is open.
After adding a network device to your management group, you can change the proxy agent for that device at any time. The proxy agent is the management group component that is the watcher node for the network device. You may assign the duty of a proxy agent to any existing Management Server, Gateway Server, or Agent Component in the management group. The proxy agent performs SNMP polling operations every few minutes to confirm the health of the network device. It also serves as the trap destination for unsolicited notification of events that originate from the device.
Consider changing the proxy agent for a network device in these circumstances:
Distributing and load-balancing the monitoring duties for network devices across several components of the management group.
This is analogous to changing the primary management server for an agent-managed computer, or changing the proxy agent for an agentless-managed computer.
Deliberately selecting the proxy agent as a watcher node that provides meaningful perspective.
As an example, if you are monitoring a printer in a branch office, you might select a client computer at that branch to serve as the proxy agent for the printer.
To change the proxy agent for a network device, navigate to the Administration -> Device Management -> Network Devices node in the Operations console and select one or more devices. As shown in Figure 17.9, right-click and select Change Proxy Agent. (This is the same area of the console where you can delete a managed device from the management group—see the Delete action available in the Actions pane in the upper right.)
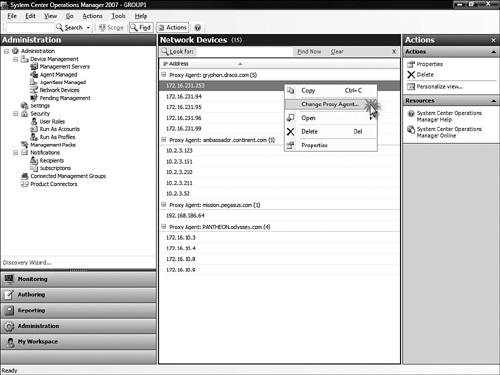
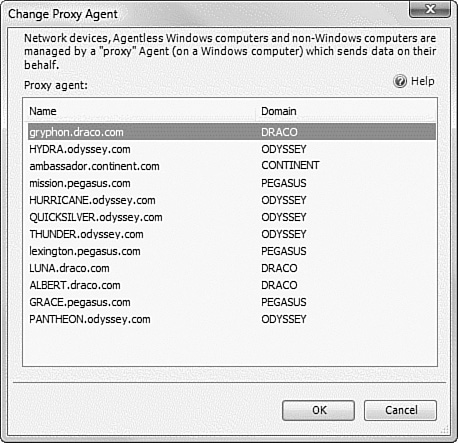
After you click Change Proxy Agent on the pop-up menu, as shown in Figure 17.9, a list appears of all candidates eligible to become the new proxy agent for the network device. Figure 17.10 shows the Change Proxy Agent selection box. All management servers, gateway servers, and agent-managed computers in the management group are available for selection. Take care to select a proxy agent (or agents) that has direct network connectivity to the network device and has aggregated uptime equal to or greater than the SLA on the SNMP device being monitored. The console process does not verify that the network the device is on has connectivity to the network where the selected proxy agent is.
If you select an agent-managed computer in the management group to be the new proxy agent for a network device, you must confirm that the computer has the Windows SNMP service installed and configured to perform the proxy agent function. The OpsMgr Agent Component alone is insufficient for a computer to serve as proxy agent for a network device; both the OpsMgr agent and the Windows SNMP service are required. Remember that SNMP is an optional Windows component, and it is manually installed or enabled on computers running any version of Windows. Here are some points to keep in mind:
For computers running Windows XP, Windows 2000, and Windows 2003, add the SNMP service to the local computer using Control Panel -> Add/Remove Windows Components -> Management and Monitoring Tools -> Details -> Simple Network Management Protocol.
The Windows Management Instrumentation (WMI) SNMP Provider, another optional tool for installation, is not part of the proxy agent functionality. The WMI SNMP Provider enables the computer running it to be a SNMP agent of another Network Management System. If you install the WMI SNMP Provider, an external NMS can manage the operating system using SNMP get commands, which will translate into WMI calls.
Computers running Windows Vista have the SNMP service installed but not enabled. Activate the SNMP feature on Vista with Control Panel -> Programs -> Programs and Features -> Turn Windows features on or off -> SNMP feature.
Figure 17.11 points out the Windows Vista feature selection page with the SNMP feature selected.

After you install and run the SNMP feature on an agent-managed computer in the management group, that computer is eligible to serve as a proxy agent for network devices. However, additional configuration is necessary on the computer that will be the proxy agent. Figure 17.12 shows the Security tab of the SNMP service running on a Windows Vista computer. The accepted community names list must include the community string you configured the device to use; in this case, the community name is venti.

Notice in Figure 17.12 that we have restricted the SNMP service from responding to SNMP communications from sources other than localhost (address 127.0.0.1) and have limited the address of the network device that the computer will be a proxy agent for (only 172.16.231.10); this is an optional but recommended step in a security-conscious environment. Alternatively, you may select the less-secure option Accept SNMP packets from any host.
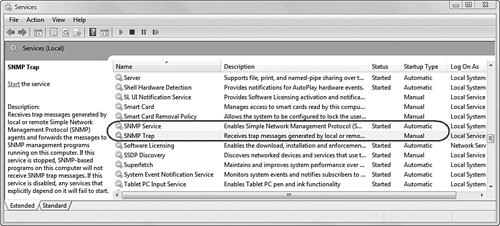
One final configuration step we will perform involves SNMP traps. If you have enabled sending SNMP traps on the network device, you need the agent proxy to be running the SNMP Trap service in addition to the SNMP service. Figure 17.13 shows the Services MMC on a Windows Vista computer after the SNMP service has been turned on. Notice that the SNMP Trap service is set to Manual startup. In order for the management group to receive unsolicited SNMP traps from the network device, change the Startup Type setting of the SNMP Trap service to Automatic.
You may be interested in the SNMP device communication strings exchanged during the conversation between a SNMP proxy agent and the SNMP device. OpsMgr 2007 does a SNMP “read/walk” of the device. It collects attributes such as Location, Device type, and Model to associate as information for the instance during discovery.
There is a single monitor, called Device status check, that is a unit monitor from the Microsoft.SystemCenter.NetworkDevice.Library, and it has the following configuration:
<UnitMonitorID=
"Microsoft.SystemCenter.NetworkDevice.CheckDeviceStatus" Accessibility="Public" Enabled="true" Target="Microsoft.SystemCenter.NetworkDevice" ParentMonitorID="Health!System.Health.AvailabilityState" Remotable="true" Priority="Normal"TypeID="Microsoft.SystemCenter.NetworkDevice.CheckDeviceState" ConfirmDelivery="false">
          <Category>PerformanceHealth</Category>
          <OperationalStates>
            <OperationalState ID="Success" MonitorTypeStateID="DeviceUp" HealthState="Success" />
            <OperationalState ID="Error" MonitorTypeStateID="DeviceDown" HealthState="Error" />
          </OperationalStates>
          <Configuration>
            <Interval>120</Interval>
            <IsWriteAction>false</IsWriteAction>
            <IP>$Target/Property[Type="Microsoft.SystemCenter.NetworkDevice"]/IPAddress$</IP>
            <CommunityString>$Target/Property[Type=" Microsoft.SystemCenter.NetworkDevice"]/CommunityString$</CommunityString>
            <SnmpVarBinds>
              <SnmpVarBind>
                <OID>.1.3.6.1.2.1.1.5.0</OID>
                <Syntax>1</Syntax>
                <Value VariantType="8" />
              </SnmpVarBind>
            </SnmpVarBinds>
          </Configuration>
        </UnitMonitor>
This XML extraction from the management pack shows that the monitor tries to read/bind to the specified OID during a SNMP read. If the action fails, the object assumes the Critical health state. The read-queries are issued to the device every 120 seconds.
The quickest way to begin getting practical output from Operations Manager 2007’s network device management capabilities is by importing hardware management packs that someone else has already created. If you look again at the default Network Devices State view in the Monitoring space in Figure 17.6, you can observe that the Network Device node is rather Spartan. There is only one view, a very simple state view, and a few generic linked reports that are mainly useful to track the uptime of the device. That is the starting point we will use.
In the following two sections, we import two management packs that will significantly expand the usefulness of OpsMgr to manage hardware. One is from Microsoft—the network device management pack distributed with the System Center Essentials 2007 product. The second is from HP. We will be importing HP Server Management Pack version 1.0 for Microsoft System Center Operations Manager 2007.
Those using the Microsoft System Center Essentials 2007 (Essentials) product will discover that Microsoft has bundled a network device monitoring management pack with Essentials; this management pack is not included with Microsoft System Center Operations Manager 2007. (We cover the System Center Essentials relationship with System Center Operations Manager in detail in Chapter 21, “Reading for the Service Provider: Remote Operations Manager.”) In this chapter, we borrow some material on network device management using Essentials to show you what OpsMgr can do with its native SNMP device management features effectively configured.
The System Center Essentials–provided Microsoft System Center Network Device Monitoring Library management pack contains definitions for monitoring discovered SNMP-enabled network devices. We copied the management pack from the Essentials installation media and imported it into our OpsMgr 2007 management group using the Administration -> Management Packs -> Import Management Packs function.
Right away, we noticed in the Monitoring space that the Network Devices State view includes additional columns that summarize the health of the different interfaces a network device might have. In addition, the Network Devices node has three new views: a performance view, an alert view named Network Devices Problems, and a diagram view labeled Network Topology. A new SNMP Network Device Task action panel has six tasks.
Figure 17.14 shows our Operations console view of Network Devices State after we imported the Microsoft System Center Network Device Monitoring Library management pack from System Center Essentials.
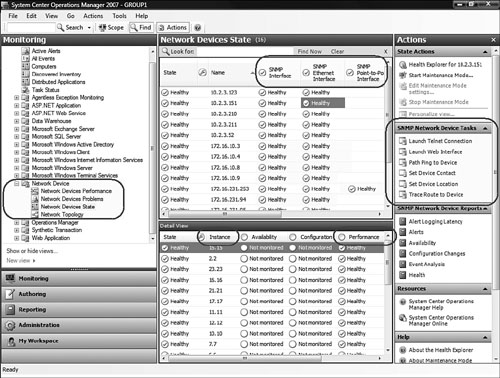
We have circled some interesting features of the Essentials Network Device Monitoring management pack (MP) Network Devices State view in Figure 17.14. At the top center of the results pane, notice the new columns such as SNMP Interface, SNMP Ethernet Interface, and SNMP Point-to-Point interface. Columns not seen in the window include SNMP DS3/E3 interface, DS1/E1, Frame Relay, and ATM interfaces. All devices with interfaces will populate the SNMP Interface column, and most devices include Ethernet interfaces to populate that column. Only routers will most likely have the other interface types, so those columns are blank unless the device is a router.
We selected the SNMP Ethernet Interface status icon for device 10.2.3.151, which is a managed network switch with 24 interfaces. The lower-portion Detail View in Figure 17.14 lists each port of the switch as an instance, and we can see some performance data collected for each port on the switch. On the right side of the console, notice the SNMP Network Device Tasks in the Actions pane. Several of these tasks are really useful. We selected a network printer (172.16.231.99) and launched the Telnet and Web Interface tasks, shown in Figure 17.15.
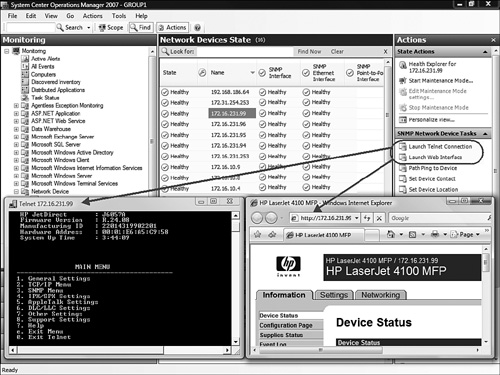
Something we liked about launching the tasks in Figure 17.15 was the one-click access to those common functions. If you work often with network devices, you can shave many seconds from your chores by not having to open separately the command prompt or web browser and then type the address of the device.
We also want to demonstrate a couple other handy tasks available in the SNMP Network Device Tasks action pane, which are the Set Device Contact and Set Device Location tasks. If you elect to enable SNMP sets (write community strings) on your network devices, you can take advantage of several features in the Essentials Network Device Monitoring MP that utilize the SNMP set feature and are demonstrated in this section.
The Network Devices State view customized by the Essentials Network Device Monitoring MP that we saw in Figure 17.14 featured columns for each SNMP interface type with health status icons. We will leave that useful view the way it is and will create a new, custom folder and state view called Network Device Information, shown in Figure 17.16.

Notice in our custom Network Device Information view in Figure 17.16 that the columns at the top of the center results pane include the device name, OID, and description, making it much easier to identify and work with network devices in the Operations console. We selected the network printer NPIA5C958 (address 172.16.231.99). Notice in the lower detail view that the Device Contact and Device Location fields are not populated. That is the default state for most SNMP-enabled devices—it is incumbent on the device owner to populate those fields and keep them updated. (In practice, it is difficult to keep that information up to date.)
Tip: Populating the Device Contact and Device Location Fields for Console Searches
Keeping these fields populated with current information can really help you locate particular objects when you are managing many network devices. The Look for search feature in the Results pane will find text in the additional device fields, such as the contact and location. So if you were able to consistently populate your device location fields with room numbers, and you created a custom view like we did that included those fields (as demonstrated in Figure 17.16), you could type the room number in the Look for box, click Find, and immediately filter the view for network devices in that room.
The Essentials Network Device Monitoring MP can make it simple to keep the Device Contact and Device Location fields on your network devices accurate and current. Launching the Set Device Contact task brings up the Run Task dialog box show in Figure 17.17. We clicked the Override button and entered the SNMP write string for this device (trenta), as well as the name and telephone extension of the employee closest to the printer. Running the task quickly updates the device’s contact field. We can repeat the procedure with the Set Device Location task to update that field as well.

You may be curious, as we were, to learn what performance parameters the Essentials Network Device Monitoring MP is watching. The quickest way to answer that question is to launch the Health Explorer against a network device. In Figure 17.18, we show the health model for a network device exposed in the Health Explorer.
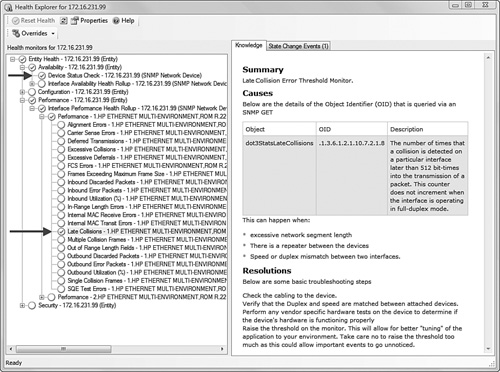
The Health Explorer for a network device, shown in Figure 17.18, has many interesting elements defined in the Interface Performance Health Rollup, although only the Late Collisions OID monitor is enabled. In fact, we discovered that late collisions and a basic Device Status Check in the Availability aggregate monitor are the only two metrics the management pack uses to assess the health of network device Ethernet interfaces. (Some additional monitors are enabled on routers.) The Causes and Resolutions sections on the Knowledge tab on the right side of Figure 17.18 provide valuable and targeted information.
The last feature of the Essentials Network Device Monitoring MP we want to share comes into play in the diagram view of a router. We need to point out that the Network Topology diagram view in the Essentials Network Device Monitoring MP does not render objects in the OpsMgr Operations console the way it was designed to do in the Essentials console. However, it is possible to select the object of interest in the Network Topology diagram view and open a dedicated diagram view (right-click and select Open -> Diagram View). Figure 17.19 shows the diagram view of a router.

The diagram view of a router, shown in Figure 17.19, is easy to understand. The default gateway of the router is clearly called out, as are the individual interfaces of the router. Selecting an interface as we have done (interface 3.ixp0) exposes information about the interface in the lower-center detail view as well as offers two context-specific tasks in the Actions pane. We circled these tasks on the right side: Set Interface Administrative Status Down and Up. These tasks allow the operator to control the router’s interfaces very conveniently. Bringing those powerful network administrative tasks into the Operations console is a welcomed achievement.
HP is heavily invested in its HP Systems Insight Manager (HP-SIM) systems management product, built on the successful Compaq Insight Manager (CIM) technology foundation. HP-SIM is an advanced and feature-rich product that is indispensible to an organization with many HP ProLiant or Integrity servers, particularly for managing firmware on HP servers and attached HP StorageWorks hardware. HP-SIM has its own alerting system based on SNMP traps and regular SNMP polling, and it facilitates a real-time, incident-based management capability for HP devices.
Dell has a similar product, OpenManage; IBM’s product is IBM Director. HP-SIM, Dell OpenManage, and IBM Director are all members of the same class of management software designed for the midrange-sized organization with up to several hundred devices. The vendor provides these management products at no cost or low-cost to equipment owners.
HP and IBM also have high-end management platforms, HP OpenView and IBM Tivoli. These expensive and highly scalable products can manage tens of thousands of devices. If your organization uses one of those high-end enterprise management products, you might seek to deploy a connector solution that integrates alert management between Operations Manager and OpenView and/or Tivoli. We discuss external connector solutions for OpenView and Tivoli in Chapter 22, “Interoperability.”
For the majority of HP, Dell, and IBM server customers, the manufacturers’ midrange/low-cost management offerings (HP-SIM, OpenManage, and Director) are a great deal. Each of these dedicated server management platforms excels at working with the respective vendor’s hardware. However, network administrators in any size of organization do not want to have to watch two consoles for alerts and status (such as OpsMgr and HP-SIM, or OpsMgr and OpenManage).
The solution is to deploy OpsMgr management packs provided by the hardware vendors that can leverage the Operations console for alerting and health status. With these hardware management packs in place, one need use the dedicated vendor product console only for particular hardware-specific tasks, such as uploading firmware to devices. The rest of the time, administrators can use the Operations console exclusively to manage their server hardware on a day-to-day basis without loss of fidelity or function, compared to using the vendors’ dedicated consoles.
HP, Dell, and IBM have all published MOM 2005 management packs for their server hardware. HP was first out of the gate with a native OpsMgr 2007 management pack, and we are going to look at this MP in action now. (Dell’s updated MP Version 3.0 and IBM’s Director MP 5.20 now also include support for OpsMgr 2007 and are discussed in Chapter 22.) The HP Server Management Pack for Operations Manager 2007 contains predefined discoveries, views, monitors, event-processing rules, and tasks for HP ProLiant and Integrity servers.
HP strongly discourages the use of converted HP MPs for MOM 2005 with OpsMgr 2007, and in particular warns against having both converted HP MOM 2005 MPs and the native HP OpsMgr 2007 MP installed in the same management group. The company advises that you start fresh using the native OpsMgr 2007 MPs only. Another caution from HP is that its MPs will not function with agentless managed computers—to use the HP Servers MP for OpsMgr 2007, HP servers must have the OpsMgr 2007 Agent Component installed as well as the HP Insight Agents application, which along with SNMP is the client portion of the HP-SIM architecture.
The HP Servers Management Pack for Operations Manager 2007 uses the following underlying elements to collect data and process hardware events and state changes:
Discovery rules—. These rules use the Insight Agents, system BIOS data, and the information from WMI to identify HP ProLiant and Integrity servers and collate individual system configuration attributes.
State monitoring rules—. These rules use data from the Insight Agents MIB to monitor the condition of server hardware and to populate the state view in the Operations console. State monitoring includes the availability of the Insight Agents, which run as services in the servers’ operating systems.
Event-processing rules—. These rules rely on the Insight Agents and data written to the server event logs to identify and process HP hardware events. When an Insight Agent generates an event, it writes a corresponding entry to the System Event log. If this HP event has an associated event-processing rule defining the HP Server MP, OpsMgr generates an alert.
HP distributes its hardware MPs as four installation kits, one each for HP ProLiant and HP Integrity servers, with both types available for x86 and x64 processor–based computers. You install the appropriate kit(s) on an existing OpsMgr 2007 management server or client computer with the OpsMgr 2007 console installed. The installation program for the kits places a custom application tool on the local machine. It also automatically imports three MPs into the management group:
Hewlett-Packard Servers Core Library—. This library defines the basic HP Server Class structure to support ProLiant and Integrity server management.
Hewlett-Packard ProLiant Servers Base—. The base MP defines the HP ProLiant Server Class structure to process primary monitoring to ProLiant servers.
Hewlett-Packard ProLiant Servers SNMP Management Pack—. The SNMP management pack defines the HP Insight Agent–based management for states and events.
For full functionality of the HP Servers management packs, install the kit on each instance of the Operations console in the management group. When performing the successive installations of the kit on other console instances, select the Custom setup type and install only the Console Task Tools.
As part of importing the management packs and installing the kit, a new view folder named HP Servers appears in the Monitoring space, with eight included views, which consist of five targeted state views, and one each of an alerts, diagram, and task view. Figure 17.20 shows the OpsMgr Web Console -> HP Servers -> Server Diagram view, with the HP Servers views circled.

In our view of the OpsMgr Web console in Figure 17.20, we have navigated in the diagram view to highlight a particular HP server (Lexington). Expanding the diagram branch below the server exposes each of the hardware elements monitored by the HP Servers management pack. From this view, you could select a particular subcomponent and effect a granular management mode action. For example, if you were going to replace a power supply on a system with multiple redundant power supplies, you could put just the Power Supplies component in maintenance mode during the swap. That action would permit continued monitoring of the rest of the server’s components, without unnecessarily alerting operations staff when the power supply replacement is taking place.
In the lower details pane we can see useful hardware information, such as the server’s serial number, firmware revision, and the IP address of its Integrated Lights-Out (ILO) card. The HP ILO, like the Dell Remote Access Card (DRAC) and the Intel Out of Band Management NIC, provides administrators with a remote management capability to access and operate the server’s video, keyboard, and mouse—even when the server is powered off.
Returning to the HP Servers -> Server State view in the Operations console, we will show you why you need to install that console task tool on each console in the management group (which is necessary to get full use out of the HP Servers MP). In Figure 17.21, for clarity we have filtered the server state list to show only the server Lexington. We now invoke the HP Custom Data Manager task from the HP ProLiant Server Tasks Actions pane in the upper-right corner. This task opens the Custom Data Manager in its own window, seen in the lower-right side of the screenshot. The Custom Data Manager is the console task tool installed on each computer in the management group running the Operations console.

The Custom Data Manager is an applet that lets the operator interact with 10 custom data fields added to the Operational database by the HP Servers management pack. The data fields provide a way to track five custom attributes, each with its own custom title. If you accept the default values for the custom data titles, they include useful elements such as the service contact name, email, and phone number and the warranty expiration date for the server.
After updating the values in the Custom Data Manager tool, click the Update Custom Data to Operations Manager toolbar button to update the Operational database. Once the custom data is in the database, you can customize your state view by adding columns for the custom data and then sort by item of interest, such as the warranty expiration date (01/15/2010 in the example in Figure 17.21).
Suppose you really did have a power supply failure on one of your servers. How would you learn about that? In the case of an actual hardware event, the HP Insight Agents on the managed computer generate a SNMP trap, routed internally to the OpsMgr Agent Component on the computer. The agent transcribes the SNMP trap information into an OpsMgr alert and sends that to its assigned OpsMgr Management Server Component. Figure 17.22 displays an external notification of such an alert and a view of the Product Knowledge page from the alert.
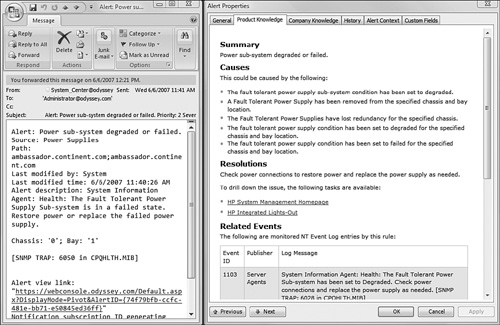
The Outlook 2007 message open on the left side of Figure 17.22 is an external notification of a failed power supply in a HP server. The alert clearly lets us know which power supply failed (Bay 1 in Chassis 0); also, we see a note about trap 6050 in CPQHLTH.MIB. You may recall from the “About MIBs and OIDs” section of this chapter that HP uses enterprise OID 232, so it should not surprise you that the full OID of this trap is 1.3.6.1.4.1.232.6050 (cpqHe4FltTolPowerSupplyFailed).
On the right side of Figure 17.22 we show the Product Knowledge tab on the Alert Properties page (in the Operations console) for the corresponding alert we received the email notification on. Notice that the Causes and Resolutions sections include relevant tips to help you evaluate or further troubleshoot the alert condition. There are also two inline tasks in the Resolutions section:
HP System Management Homepage
HP Integrated Lights-Out (ILO)
These task links provide convenient one-click access to the respective HP server tools in a web browser.
A final feature of the HP Server MP we want to demonstrate is a task that retrieves the contents of the server’s Integrated Management Log (IML). On HP servers, the IML is a hardware-based record of major server events, such as blue screens and hardware component failures. Normally you can examine the IML only using the ILO, running an IML log viewer utility on the server; or, with appropriate Windows security permissions, running the IML log viewer utility from another computer with network connectivity to the server. Figure 17.23 shows the IML contents being examined in a new way—without direct network connectivity—using OpsMgr 2007!

In Figure 17.23, we navigated in the Operations console to the HP Servers -> Health Collection State view and again filtered on just the server Lexington. We can see each of the hardware components monitored on that server, as we did in the Web console diagram view shown in Figure 17.20. When we highlight the Logs component in the Health Collection State view, two log-specific tasks appear in the Logs (ProLiant SNMP) Tasks pane: IML Clear and IML Export.
Running the HP ProLiant IML Export task, as we did, opens a Task Status window with the contents of the server’s IML in the Task Output area. We can see there was a Network Adapter Link Down event on Port 1 of the NIC in PCI slot 5 on 6/13/2007 that is now repaired. If you manage HP servers that are located on remote, unconnected networks using an OpsMgr gateway server, this new way to view server IMLs is revolutionary and promises to be a great timesaver!
After seeing how Operations Manager 2007 can shine using imported network device management packs, let’s get started creating our own custom SNMP rules and monitors. You will need to create custom SNMP rules or monitors to extend your OpsMgr capability to manage network devices that do not have precreated or vendor-supplied management packs.
Here is a list of the types of devices that may support SNMP; consider adding these kinds of network devices to your management group:
Core and edge network devices such as routers, switches, hubs, bridges, and wireless access points
Operating systems of non-Windows computers, such as UNIX, AIX, RS/6000, Macintosh, Sun, and Linux systems
Broadband network devices such as cable and DSL modems
Consumer electronic devices such as cameras and image scanners
Office equipment such as printers, copiers, and fax machines
Network security equipment such as Intrusion Detection Systems (IDS) and firewalls
Access control equipment such as standalone biometric scanners and door control systems
Manufacturing and process equipment, including Supervisory Control and Data Acquisition (SCADA) instrumentation
The first step when creating custom SNMP rules and monitors is to refer to a copy of the MIB for the device you want to manage, or at least a reference guide from the device vendor or another source including the OIDs supported by the device. All SNMP devices respond to the general MIB-2 OID of 1.3.6.1.2.1, which provides basic system name and networking information.
When creating a custom rule or monitor in OpsMgr, you will want specific information regarding the particular device you want to manage. For example, the percentage battery life remaining OID would only exist in a MIB written by an uninterruptable power supply vendor. Because custom rules and monitors in OpsMgr are created using OIDs, you need to know the OIDs in the enterprise MIB of the device you want to manage.
The device we will use to demonstrate the custom SNMP rules and monitors is a HP chassis switch, a ProCurve 4000M series with eighty (80) 10/100 Ethernet ports. This is an enterprise switch that is well supported and has lots of SNMP features built into it. Information on this device was easy to locate on the Internet. For your network devices, in your search for MIB information, use the vendor’s website and your general-purpose search engines—search on MIB and your equipment model number. You will want to check the DVD, CD, or floppy disk that your equipment came with. UNIX and Linux distributions may include their MIB files in their local file systems. With a little detective work, you can generally discover the MIBs your device supports.
With the appropriate documentation for a device’s OIDs and their meanings and values, you can proceed to create your custom SNMP rule or monitor. If you cannot locate an understandable reference on the MIBs for your device, you can alternatively interrogate the device about its OIDs. You can download or purchase a variety of tools and utilities, often called MIB walkers, to examine the MIB contents of network devices.
Microsoft provided a rudimentary tool called SNMPUTIL.exe with the Windows 2000 operating system; SNMPTUTIL can also be used with Windows Server 2003 (see http://support.microsoft.com/kb/323340 for information about this tool). Using SNMPUTIL.exe, you can interactively walk the OIDs and their values in the device’s MIBs to discover the OIDs you want to monitor the values of. SNMPUTIL.exe is easy to use (see Figure 17.24 for output of the tool). The figure shows the first value in the MIB of the HP switch.
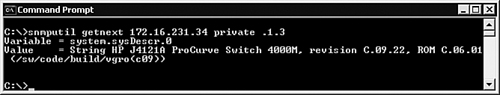
In Figure 17.24, we used the SNMP browsing command getnext to return the first value in the MIB tree after OID 1.3. The first OID that appears in the tree numerically after 1.3 is the first value in the mib2 MIB, which is the system description (OID .1.3.6.1.2.1.1.1). We would have received the same output using the SNMP browsing command get targeted directly at the system description OID .1.3.6.1.2.1.1.1, rather than the getnext command targeted high in the MIB tree at the identified organization OID 1.3. Using the getnext command is convenient for skipping forward in the MIB tree without knowing exactly what the next MIB branch might be.
A very useful SNMP browsing command is walk, which returns the OIDs and their values from the specified OID and forward, until the end of the subkey or MIB branch. In Figure 17.25, we walked (listed) the seven elements in the system branch of the MIB.
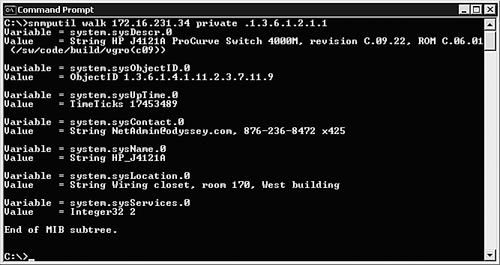
In Figure 17.25, in addition to the system description OID, we see listed the Object OID 1.3.6.1.4.1.11.2.3.7.11.9. The first portion of OID 1.3.6.1.4.1 (not underlined) leads down the MIB tree to the enterprise OID; HP is assigned enterprise OID 11. The second (underlined) portion of the OID, from enterprise OID 11 and further down the MIB tree lists all HP-unique OIDs used by HP to identify and classify its equipment. OID 1.3.6.1.4.1.11.2.3.7.11.9 corresponds in the HP enterprise OID subtree to hpEtherSwitch-hpSwitch4000. This is the Device OID listed in the OpsMgr detail pane when you select the device in the Monitoring -> Network Device -> Network Device State view.
The other OIDs in the system OID you can see in Figure 17.25 include the system uptime in seconds, the familiar system name, contact and location information, and a services value that is an integer (2 in this case). The services value is an additive sum that represents the complexity of the device relative to the seven layers of the OSI (Open System Interconnection) network model. Our HP switch’s services value of 2 indicates this device operates only at the datalink/subnetwork layer. The International Standards Organization (ISO) reference document RFC (Request for Comments) 1213 (the MIB-2 definition) lists the algorithm used to obtain the value of the system-services OID.
To list all the OIDs in all the MIB subtrees a device may support, you can use the SNMP browsing command walk and start from the top of the MIB tree, at OID 1.3. This will return every OID the device supports, and from that list, you can determine which OIDs you will configure Operations Manager to look for (in the case of custom probe action-based rules and monitors) or to expect (in the case of custom trap-based rules and monitors). Because this can result in a very long list of OIDs (in fact, too many to view at the command prompt), it is convenient to redirect the command-line output to a text file and then review the text file using Windows Notepad. Here is the command line we ran:
snmputil.exe walk 172.16.231.34 private .1.3 > 4000SNMP.TXT
The resultant text file (4000SNMP.TXT) listing every OID supported by the switch was 58,072 lines long! In addition to the universal MIB-2, the switch supports the Bridge (RFC 1493), Ethernet (RFC 1515), and Interfaces (RFC 1573) standard OID subtrees, as well as various proprietary HP enterprise subtrees. We are going to create some custom rules to monitor this device with, and we will be using our 4000SNMP.TXT file as a reference.
After you have discovered a network device and added it to your management group, basic features are operational—there is a state view that indicates whether or not the device is reachable. If the device cannot be reached, it will have a critical state. If you want more information about that network device, in lieu of importing precreated management packs, you can create custom SNMP rules and monitors. You can create four types of custom SNMP rules:
Event-based alert-generating rule—. Generates an alert in response to SNMP traps
Event-based event-generating rule—. Generates an event in response to SNMP traps
Event-based collection rule—. Collects a specified list of SNMP OIDs
Performance-based collection rule—. Collects SNMP performance data
The simplest types of custom SNMP rules you can create are event-based rules that can generate alerts or events in response to SNMP traps. The trap mechanism is a feature of the SNMP protocol that Operations Manager can easily leverage. To begin collecting traps from a network device, you would define the proxy agent computer as the trap destination in the device’s SNMP settings, and then you would create a custom SNMP trap alert rule in the management group. You can create a rule that receives all traps (all OIDs) a device may send, or you can create focused alert rules that only operate against particular OIDs.
To create a SNMP trap-based alert rule that collects all traps sent by a device, follow these steps:
Navigate to the Authoring space -> Management Pack Objects -> Rules node and select the action Create a rule.
Select the type of rule to create at Alert Generating Rules -> Event Based -> Snmp Trap (Alert). We recommend that you select your own custom management pack as the destination for the new rule (do not use the Default management pack). If you have not created a custom management pack to contain your custom rules, you can do so at this time by clicking the New button. Figure 17.26 points out the correct rule type to create, and it highlights the New button to create a new custom management pack if you do not have one yet. In this case, we named the custom management pack Network Operations Center (NOC). Click Next.
On the Rule and Description page, enter a meaningful rule name and description as desired. We used the rule name An SNMP trap was received. For the rule target, click the Select button. In the Select a Target Type box, click the View all targets radio button. Locate and select the SNMP Network Device target and click OK and Next.
Leave the Configure the trap OIDs to collect section empty and check only the All Traps box at the bottom of the wizard page.
If you are configuring the device to send traps with the same community name used by the management server during discovery of the device, click Next.
If the device is configured to send traps with a different community string than that used by the management server during discovery of the device, before clicking Next, click the Use custom community string radio button and enter the trap community string.
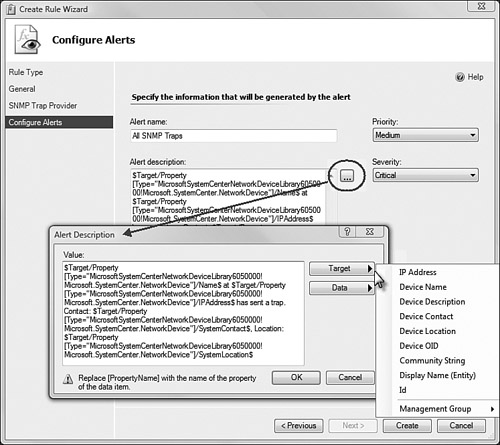
On the Configure Alerts page, you need to create some text that will appear in the alert; otherwise, any alerts you receive will only indicate the IP address of the device that sent the trap. In Figure 17.27, we have constructed an alert description that includes the device name, address, contact, and location from the MIB-2 system OID. Click the ... button (circled in the figure) to pop up the Alert Description builder. Click the Target button and select the desired variables to use in creating your custom alert description.

Because we targeted the custom rule at the SNMP Network Device class, the rule will apply to all network devices in the management group. OpsMgr will generate alerts for any managed network device configured to send traps to a designated proxy agent in the management group. You can view these alerts in the Active Alerts global view in the Monitoring space of the console.
To create a custom view that only shows open alerts from network devices, follow these steps:
Select the folder to create the view in. Then right-click and select New -> Alert View.
Give the rule a name such as Network Device Alerts.
In the Show data related to field, select SNMP Network Device from the drop-down menu.
Tick the checkbox for a specific resolution state, and in the Criteria description area, click the underlined word specific.
Select all the states except the Closed state and click OK.
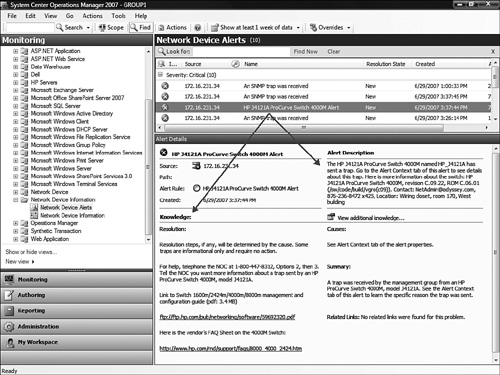
We created our Network Device Alerts view in the Network Device Information view folder we created earlier in the “System Center Essentials Network Device Monitoring Library” section of this chapter. You can see this view in Figure 17.28, already populated with some traps from the device.

Notice the customized alert description in the alert details shown in Figure 17.28—that information helps us quickly determine which device sent this trap. Looking at the list of alerts (traps) received, you notice they all have the same alert name: An SNMP trap was received. To learn details about source of the trap, you need to open the properties of an alert and examine the Context tab. In the context event data, you will see the OID and meaning of the trap.
We caused some SNMP trap-generating events to occur on our switch by removing a hot-swappable switch component and attempting a SNMP get operation with an invalid community string. Figure 17.29 shows the alert context of those traps.

The first OID value, in the event data of each alert from the device, is the device OID, seen in Figure 17.29 as 1.3.6.1.4.1.11.2.3.7.11.9. That device OID uniquely identifies alerts as coming from a HP J4121A ProCurve Switch 4000M. The most useful part of the alert context is the Octets line of the event data. On the left side of that line, we see the complete and unique OID of the alert; on the right side are the plain-language strings the MIB author selected to communicate the meaning of the trap. We can validate these OIDs and strings by examining the corresponding portions of the 4000SNMP.TXT output file of the SNMPUTIL.exe walk command that we created in the “Using SNMPUTIL.exe” section of this chapter. Figure 17.29 includes a small Notepad window with that portion of the 4000SNMP.TXT output file, visible in the bottom of each alert window.
Once you know the device OID associated with the traps you want alerts for, you are ready to create custom SNMP trap-based rules that include the trap source and other useful information in the rule name and alert. We have now demonstrated several ways to determine the device OIDs of interest so that you can create specific rules for them:
Create an all-traps rule, as we did, and collect at least one trap from the device of interest, possibly by creating a condition that will cause sending a trap.
Run the SNMPUTIL.exe walk command and locate the device OID in the output of the command. (See Figure 17.25 for an example.)
Of course, these manual methods of OID discovery are in addition to the MIB details you can learn by searching the Web and documentation provided by the device vendor. Once you have that information and know the OID that represents the device type you want to receive alerts about, you are ready to create a specific rule for that device type. To create a SNMP trap-based alert rule that collects traps sent by a specific device type, follow these steps:
Navigate to the Authoring space -> Management Pack Objects -> Rules node and select Create a rule from the Actions pane.
Select the type of rule to create at Alert Generating Rules -> Event Based -> Snmp Trap (Alert). Remember to select a custom management pack (that you previously created) as the destination management pack, rather than the Default management pack. Click Next.
Name the rule, provide a description, and select SNMP Network Device as the rule target. We are creating this alert to fire upon receipt of traps with the device OID for this particular model of switch, so we will name this rule HP J4121A ProCurve Switch 4000M Alert.
On the Configure the trap OIDs to collect page, click in the Object Identifier box and type the device OID the rule will look for. From the alert we previously received, we know in this case the device OID we are looking for is 1.3.6.1.4.1.11.2.3.7.11.9. (Remember to modify the community string if the trap community string is different from the read or write community string for the device.)
You can add more device OIDs on this page if you want the same alert to fire regardless of the OID received. If you list multiple OIDs, the alert will fire if one or more device OIDs match the device OID in the received traps(s). Click Next.
Provide a detailed alert description. Because this alert applies only to a specific device type, you should make your description as meaningful as possible for future console operators and other recipients of the alert notification. You can also select your choice of appropriate priority and severity. Click OK when done.
You can review your newly created rule in the Authoring space to confirm the details. You can also return here to modify the rule configuration, add custom knowledge, and apply overrides. Figure 17.30 shows the SNMP Security Alert rule and its configuration page in the Authoring space. For this particular view, we scoped the rule list to show only objects in the SNMP Network Device class.

Notice that Figure 17.30 has an Add button in the Responses area. After you create the rule, you can return to the Authoring space, access the Add responses button, and instruct OpsMgr to run one or more command lines or Visual Basic scripts in response to receiving the alert. For example, you could create a command-line task that runs the SNMPTRAP.exe tool and sends another SNMP trap to a third-party SNMP NMS.
Another reason to return to the Authoring space and edit the custom rule is to add knowledge to the alert. Include knowledge that will be useful to recipients of the alert, particularly those receiving external notifications of events. Using the Resolution and Summary sections of the Knowledge feature, you can greatly increase the value of the alert by providing just-in-time information to recipients of the alert.
Look at the Network Device Alerts view in Figure 17.31. Notice the alert we received from the switch is now clearly part of the alert name, making the custom alert stand out from the generic “An SNMP trap was received” alert. Notice that we also used the Knowledge feature to add contact information in the Network Operations Center (NOC), as well as hyperlinks to the vendor’s ftp and websites for the management and configuration guide and a FAQ (frequently asked questions) list.
You can also create custom SNMP trap collection rules that only generate events, rather than alerts. Follow these procedures to create an event-generating SNMP trap collection rule:
Navigate to the Authoring space -> Management Pack Objects -> Rules node and select the action Create a rule.
Select the type of rule to create at Collection Rules -> Event Based -> Snmp Trap (Event). Remember to select your own custom management pack as the destination. Click Next.
On the Rule and Description page, enter a meaningful rule name and description as desired. We used the rule name SNMP Trap (Event) Collection. For the rule target, click the Select button. In the Select a Target Type box, click the View all targets radio button. Locate and select the SNMP Network Device target and then click OK and Next.
Leave the Configure the trap OIDs to collect section empty and check only the All Traps box at the bottom of the wizard page.
If you configured the device to send traps with the same community name used by the management server during discovery of the device, click Next.
If the device is configured to send traps with a different community string than that used by the management server during discovery of the device, before clicking Next, click the Use custom community string radio button and enter the trap community string.
Click Create when you are done.
After you’ve created this rule, all traps received from all SNMP network devices will appear in the All Events global view in the Monitoring space. You can also create a custom view to observe only events from SNMP network devices. To create a custom view that only shows open alerts from network devices, follow these steps:
Select the folder to create the view in, right-click, and select New -> Event View.
Give the rule a name, such as Network Device Events.
In the Show data related to field, select SNMP Network Device and click OK.
We created our Network Device Events view in the Network Device Information view folder that we created earlier (in the “System Center Essentials Network Device Monitoring Library” section of this chapter). You can see this view in Figure 17.32, populated with a trap from a device.
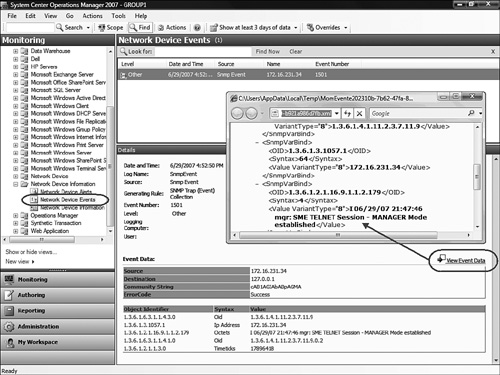
You can also add knowledge to custom event rules, as you can with alert rules. However, because events do not generate external notifications, knowledge tends to be more useful when applied to alert rules. Notice in Figure 17.32 that we circled the View Event Data link, and we show an arrow pointing to the Internet Explorer window that the link opens. The browser window exposes a raw XML view of the event data, which consists of the OIDs and values contained in the trap. This is the same set of SNMP OIDs appearing in the Event Data portion of SNMP alerts and events.
One advantage to viewing SNMP traps as events rather than as alerts is that the event data, where the Octets line and its device-specific meaning are located, is visible in the Details pane of the Monitoring console. In the case of SNMP alerts, that important information is only available on the Alert Context tab of the Alert Properties window.
The two types of custom rules we just covered—the SNMP trap alert and SNMP trap event rules—use the SNMP trap technique to receive status information from the network device. The next two types of custom rules, the event-based and performance-based collection rules, use the SNMP get technique to poll the network device for status information. Whereas the trap-based rules require configuring the OpsMgr Proxy Agent Component as the trap destination in the device’s SNMP settings, collection rules require that the OpsMgr proxy agent be an authorized SNMP manager in the device settings. In other words, the network device must respond to SNMP get commands issued by the proxy agent that it will receive on a recurring, timed basis.
Creating this type of rule brings information about device status into the OpsMgr Operations database and makes that information available to view in the event details. The Proxy Agent Component will poll the device for a particular OID value, recording an event with the value of the OID in its Details section.
The scenario we will step through involves monitoring a particular port on the switch, which we will call the VIP User port. We will poll the switch every 2 minutes and retrieve the state of the port. Here are the steps to create this custom event-based collection rule:
Navigate to the Authoring space -> Management Pack Objects -> Rules node and select the action Create a rule.
Select the type of rule to create at Collection Rules -> Event Based -> SNMP Event. Remember to select your own custom management pack as the destination. Click Next.
On the Rule and Description page, enter a meaningful rule name and description, as desired. We used the rule name VIP User Port State. For the rule target, click the Select button. In the Select a Target Type box, click the View all targets radio button. Locate and select the SNMP Network Device target and click OK.
Unlike trap-based rules, where the proxy agent waits passively for traps to arrive, collection rules create activity for the proxy agent. If we enabled this rule at the time of its creation, every proxy agent in the management group would poll every SNMP network device it was responsible for. Accordingly, it is important to uncheck the Rule is enabled box—we want the rule disabled upon creation—and then click Next.
On the Configure the object identifier settings for SNMP probe module, we left the default frequency at 2 minutes, and we entered the OID that represents the operational status of the switch port of the VIP user. Normally you will use the discovery community string for the probe action; however, on this page you can specify an alternative SNMP community string.
The OID we want to poll the switch for is 1.3.6.1.2.1.2.2.1.8.37. We learned this OID by running SNMPUTIL.exe with the
walkoption against the MIB-2 OID 1.3.6.1.2.1.2.2.1.8 (interfaces.iftable.ifentry.ifOperStatus). This returned the OIDs for each of the interfaces of the switch. The switch has 80 interfaces, and the port we are monitoring is port E5, which is interface number 37 on the device. Click Create when done.Now, we need to enable the rule for the particular switch the VIP user connects to. Locate the new rule at the Authoring -> Management Pack Objects -> Rules node of the console. Then right-click and select Overrides -> Override the rule -> For a specific object of type SNMP Network Device. A selection box will pop up listing all the network devices in the management group. Select the IP address of the network device the collection rule is applicable to and click OK.
On the Override Properties page, check the Override box, change the Override Setting to True, and click OK. Confirm that the override was successful by right-clicking again on the rule name and selecting Overrides Summary. The Overrides Summary box will pop up, as shown in Figure 17.33. Make sure the Enabled parameter is set to true.

With the SNMP event collection (probe) rule created in a disabled state and then enabled for the correct target device, events will begin to appear in the Operations console. As you can see in Figure 17.34, SNMP polling events by the VIP User Port State rule occur every 2 minutes. In the Event Data portion of the Details pane, you can see the target OID and a value of 1, which means the switch port is operational (it has a link). If the value were 2, it would mean the port was not operational (no link).

We also inset a command-line window in Figure 17.34, showing the output of the SNMPUTIL.exe get command against the same switch port. You can see that a SNMP event collection (probe) rule is just like running the SNMPUTIL.exe get command on a scheduled basis and putting the results in the Operations console where all console operators can view them.
The last type of custom rule for monitoring network devices is the SNMP performance collection rule. This rule type collects numeric data for a specific OID. Once the numeric data is in the OpsMgr database, you can display the data by creating a performance view or by running a report.
To demonstrate the use of performance-based collection rules, we will create a rule that gathers the total number (counter) of SNMP network packets sent by each network device. This is a measure of the volume of network activity generated while using the SNMP protocol. We will poll our network devices every 2 minutes and retrieve the value of this counter. Here are the steps to create a custom SNMP performance collection rule:
Navigate to the Authoring space -> Management Pack Objects -> Rules node and select the action Create a rule.
Select the type of rule to create at Collection Rules -> Performance Based -> SNMP Performance. Remember to select your own custom management pack as the destination. Click Next.
On the Rule and Description page, enter a meaningful rule name and description as desired. We used the rule name Network Device Received SNMP Packets Total. For the rule target, click the Select button. In the Select a Target Type box, click the View all targets radio button. Locate and select the SNMP Network Device target and click OK.
On the Configure the object identifier settings for SNMP probe module, we left the default frequency at 2 minutes, entered the OID that represents the number of SNMP packets received over the device’s network interface, and clicked Create. Normally you will use the discovery community string for the probe action; however, on this page you can specify an alternative SNMP community string.
The OID we want to poll our devices for is 1.3.6.1.2.11.1.0. We learned this OID by running SNMPUTIL.exe with the
walkoption against the MIB-2 OID 1.3.6.1.2.1.11 (snmp). This returned the OIDs for various counters related to the SNMP protocol—such as the number of times a bad SNMP community string was received (snmp.snmpInBadCommunityNames) and the number of SNMP traps sent (snmp.snmpOutTraps).Figure 17.35 shows the output of the SNMPUTIL.exe
getcommand for the OID we are creating our received packets rule for (snmp.snmpInPkts), as well as the corresponding sent packets OID (snmp.snmpOutPkts). Notice there are three more outbound packets than there are inbound packets. That difference is accounted for by the number of traps sent (snmp.snmpOutTraps). This means that since restarting the device, 30,272 packets associated with probe events (SNMPgetcommands) were received and replied to, and three SNMP traps were sent, for a total of 30,275 outbound SNMP packets.
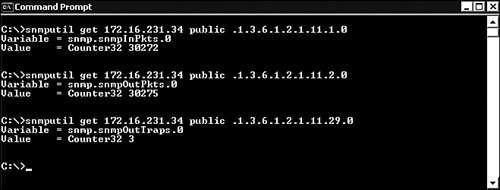
After you create a SNMP performance collection rule, the designated proxy agents for your network devices begin polling their devices and writing the OID values to the OpsMgr database. You can review collected SNMP performance data in two ways:
Using a performance view in the Monitoring space
Running a report
Running a report provides you with more detailed and configurable results, which are easier to read than using the performance views in the Monitoring space. Create a report on SNMP network device performance for a particular device using the following procedure:
Navigate to the Reporting Space -> Microsoft Generic Report Library -> Performance node and select Open in the Actions pane.
If you expect to run this report on a regular basis, select Schedule, also in the Actions pane. Scheduled reports retain their custom report parameters, whereas the custom report parameters of a report only run once and cannot be saved.
In the report interval section in the upper-left corner of the report, change the From value from Today to Yesterday. This sets up the report for the previous 24 hours.
In the Objects section in the upper-right corner of the report, click the Change button.
The Settings box will appear. Click the New Chart button in the upper right and enter a name in the Chart title box in the Details area. We used the title SNMP Packets Received.
Click the New Series button in the upper right and then click the Add Object button in the center portion.
The Add Object box appears. Enter the IP address of the network device to report on in the Object name box and then click the Search button. The desired network device should appear in the Available items area. Select the device and click the Add button. The device should now appear in the Selected objects section in the lower portion of the Add Object box. Click OK.
Back at the Settings box, click the Browse button next to the Rule item on the lower-right side. The Select rule box will appear. Click the Search by Counter button at the top. In the Performance object dropdown selection list, pick Snmp Performance Object. In the Counter dropdown list, select the 1.3.6.1.2.1.11.1.0 OID (snmp.snmpInPkts). Click the Search button. The object should appear in the Available items list. Select it and click OK.
Repeat steps 5 though 7 for each additional counter you would like displayed on the report. (We are just going to show the one counter on this report.) Figure 17.36 shows the report’s Settings page completed per this procedure.
Click the Run button, and a line-chart graph is generated that shows the selected OID values over the 24-hour period. Below the graph in the Rule, Instance, Object column, you will see a coded rule reference (similar to MomUIGeneratedRule90db33525...). Click that rule to open a detailed version of the graph that includes histogram features such as average and standard deviation. A second smaller chart details the number of performance counter samples making up the report.
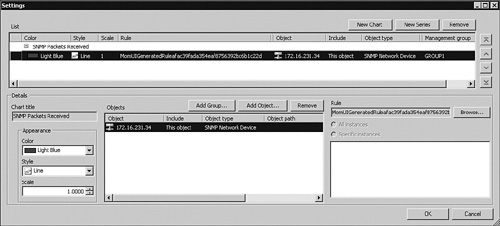
Figure 17.37 shows this detailed chart view. Notice the most recent data values (on the right of the chart) are in the ~30,000 count range, as we expected after validating the current OID value with the SNMPUTIL.exe get command. The chart indicates that the switch was restarted at 11 p.m. the previous evening, which reset the OID value (counter) to zero.

The rules created so far in the chapter that monitor SNMP network devices were mainly about collecting and displaying data. The hardest part about creating these rules was identifying and verifying the OID(s) that represent the value(s) we are interested in. SNMP monitors build on the concepts used by rules—trap based and collection based. Therefore, if you have followed this chapter so far, you understand the fundamentals of SNMP monitors already.
What SNMP monitors do is add some intelligence to the management group, to allow for traps and the output of probes to change the health state of a monitored network device, as well as optionally raise an alert. Using only a rule, you can just see an event, receive an alert, or view a report to learn the value of an OID of interest. Using a monitor, you can focus on the present health state of the device, without having to manually review the historical or real-time output of rules.
Figure 17.38 shows the monitor type selection screen, displayed when you begin to create a custom SNMP monitor. You can see that there are two choices:
Probe Based Detection
Trap Based Detection
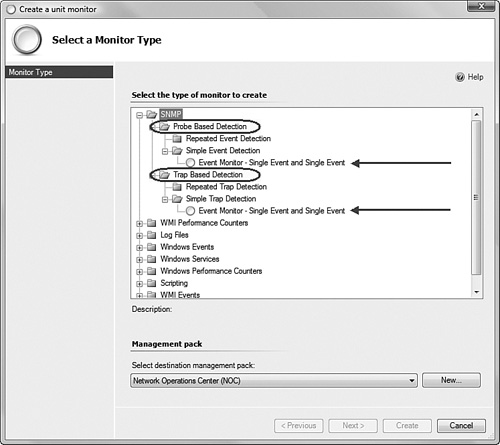
Each type of monitor features Single Event and Single Event simple detection. Other classes of OpsMgr monitors (Windows Events as an example) include complex monitors such as repeated event and missing event detection. SNMP monitors only include the simple detection type.
We will demonstrate creating a SNMP probe-based detection monitor to watch the operational status of the switch port for our VIP user, the same scenario we used in the “Creating an Event-based Collection Rule” section of this chapter. Here are the steps we used to create the monitor:
Navigate to the Authoring space -> Management Pack Objects -> Monitors node and select the action Create a monitor -> Unit monitor.
Select the type of monitor to create at SNMP -> Probe Based Detection -> Simple Event Detection -> Event Monitor – Single Event and Single Event. Remember to select your own custom management pack as the destination. Click Next.
On the General Properties page, enter a meaningful monitor name and description as desired. We used the monitor name VIP Switch Port Monitor. For the monitor target, click the Select button. In the Select a Target Type box, click the View all targets radio button. Locate and select the SNMP Network Device target and click OK.
In the Parent monitor dropdown selection list, select the appropriate type of parent monitor that this monitor’s status should be rolled up with. There are four choices:
Availability
Configuration
Performance
Security
We selected the Availability type because that category is appropriate for this monitor. Also, we unchecked the Monitor is enabled box (we want the monitor disabled upon creation). Click Next.
On the Configure the object identifier settings for SNMP probe module for the First SnmpProbe, we left the default frequency at 2 minutes and entered the OID that represents the operational status of the switch port of the VIP user. Normally you will use the discovery community string for the probe action, although here you can specify an alternative SNMP community string.
The OID we want to poll the switch for is 1.3.6.1.2.1.2.2.1.8.37, which is the MIB-2 interfaces.iftable.ifentry.ifOperStatus OID for port E5, which is interface number 37 on the device. The VIP user’s computer connects to that switch port. Click Next.
On the Build Event Expression page for the First Expression, click Insert -> Expression. In the Parameter Name field, enter SnmpVarBinds/SnmpVarBind[x]/Value, where x is the order of the OID/Value pair that is contained in the event context. We know from examining the event data for this OID in Figure 17.34 that there is only one OID/Value pair, so x=1 in the case of this monitor. We then selected Equals from the drop-down Operator selection list and typed a value of 2, which will indicate that the interface is down. Click Next.
Tip: SNMP Monitors Needed for SNMP Granularity
A big difference between simple SNMP rules and more powerful SNMP monitors is that only monitors can filter one or more of the multiple OID values that may be associated with a SNMP trap or probe response. Only when creating a monitor can you specify SnmpVarBinds/SnmpVarBind[x]/Value, where x is the ordinal sequence of the additional OID in the event details.
Think of this as allowing the monitor to see inside the event details, and then perform an operation on a particular line number of the event details. That makes monitors much more attractive (and logical) to create than rules, which only operate at the device OID level. However, monitors do carry the requirement that you specify a compensating (or self-correcting) action, which can add undesired overhead to your monitoring operation.
Configure the object identifier settings for the SNMP probe module for the Second SnmpProbe, and the Build Event Expression page for the Second Expression, in the same manner as for the first probe and expression pair, except enter the expression value of 1, which will indicate that the interface is back up. Click Next on each page.
On the Configure Health page, confirm that the Second Event Raised indicates a Healthy state, and the First Event Raised indicates a Warning (or Critical) state. Click Next.
On the Configure Alerts page, we selected Generate alerts for this monitor. In the Alert description area, we provided instructions to console operators and alert recipients on how to evaluate this alert. In the sample scenario of monitoring a VIP switch port, we include suggestions to rule out that the VIP computer has malfunctioned or been unplugged from the network. Click Create when done.
Now, we need to enable the monitor for the particular switch the VIP user is connected to. We located the new monitor at the Authoring -> Management Pack Objects -> Monitors node of the console, right-clicked, and selected Overrides -> Override the monitor -> For a specific object of type SNMP Network Device. A selection box popped up listing all the network devices in the management group. We selected the IP address of the network device the monitor is applicable to and clicked OK. On the Override Properties page, we checked the Override box, changed the Override Setting to True, and clicked OK.
Within a few minutes of enabling the monitor for the switch the VIP user computer connects to, the health model of the switch should update in the console to include the VIP Switch Port monitor in a Healthy state. Because it would be prudent to test the new monitor, we unplugged the VIP computer’s network cable from switch port E5. This generated the First Event Raised state change event, properly generated an alert, and changed the health status of the switch to the warning state.
Figure 17.39 shows the switch’s Health Explorer open to show the VIP Switch Port Monitor in a warning state. Plugging the computer back into switch port E5 will generate a Second Event Raised state change event at the next polling interval, automatically clear the alert, and restore the switch to a success health state.

We will now demonstrate the last type of custom SNMP monitor that you can create, which is a SNMP trap-based detection monitor. SNMP trap-based detection monitors have the same features as SNMP probe-based detection monitors, except that received traps provoke the state change events, rather than polling results.
Our sample monitor will track security-related events on the switch. The scenario is that unauthorized attempts to access the switch will create a warning health state and that operators will follow a standard procedure to access the switch’s management interface via Telnet to confirm the switch is secure, which returns the switch’s security monitor to a healthy state. Here are the steps we used to create the monitor:
Navigate to the Authoring space -> Management Pack Objects -> Monitors node and select the action Create a monitor -> Unit monitor.
Select the type of monitor to create at SNMP -> Trap Based Detection -> Simple Event Detection -> Event Monitor – Single Event and Single Event.
Remember to select your own custom management pack as the destination. Click Next.
On the General Properties page, enter a meaningful monitor name and description as desired. We used the monitor name VIP Switch Security Monitor. For the monitor target, click the Select button. In the Select a Target Type box, click the View all targets radio button. Locate and select the SNMP Network Device target and click OK.
In the Parent monitor dropdown selection list, select the appropriate type of parent monitor that this monitor’s status should be rolled up with. Again, the choices are Availability, Configuration, Performance, and Security. We selected the Security type because that category is appropriate for this monitor. Also, we unchecked the Monitor is enabled box (we want the monitor disabled upon creation). Click Next.
On the Configure the trap OIDs to collect for the First SnmpTrapProvider, we left the default frequency at 2 minutes and selected the All Traps option. Normally you will use the discovery community string for the probe action, although here you can specify an alternative SNMP community string. Click Next.
On the Build Event Expression page for the First Expression, click Insert -> Expression. In the Parameter Name field, enter SnmpVarBinds/SnmpVarBind[x]/Value, where x is the order of the OID/Value pair that is contained in the event context. We know from examining the trap event data for this device in Figure 17.29 that the third OID/Value pair (circled) contains the information we are interested in, so x=3 in the case of this monitor. We then selected Contains from the dropdown Operator selection list and typed the string SNMP Security access violation, which will indicate that an unauthorized attempt to access the switch occurred. Click Next.
We configured the trap OIDs to collect for the Second SnmpTrapProvider, as well as the Build Event Expression page for the Second Expression, in the same manner as for the first trap provider and expression pair, except we entered the expression string TELNET Session – MANAGER Mode, which will indicate that the desired operator action has taken place. We learned that this was the correct text string to filter on by examining the details of a trap received from that device for that event. Click Next on each page.
On the Configure Health page, confirm that the Second Event Raised indicates a Healthy state and that the First Event Raised indicates a Warning (or Critical) state. Click Next.
On the Configure Alerts page, we selected Generate alerts for this monitor. In the Alert description area, we provided instructions to console operators and alert recipients on how to evaluate this alert. In the sample scenario of monitoring the switch security, we included directions to the operator to open a Telnet session with the device and confirm that device integrity is not compromised, which can be accomplished by reviewing the device’s internal log of events. Click Create when done.
Now, we need to enable the monitor for the particular switch the VIP user connects to. We located the new monitor at the Authoring -> Management Pack Objects -> Monitors node of the console, right-clicked, and selected Overrides -> Override the monitor -> For a specific object of type SNMP Network Device. A selection box popped up listing all the network devices in the management group. We selected the IP address of the network device the monitor is applicable to and clicked OK. On the Override Properties page, we checked the Override box, changed the Override Setting to True, and clicked OK.
Figure 17.40 points out the location of the custom monitors we have created in the Authoring space of the console. Notice that the monitors we have created are disabled by default and are saved to a custom management pack—both best practices for network device monitors.
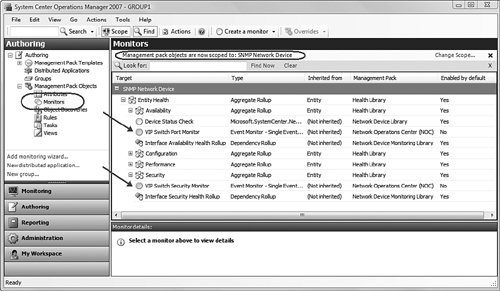
Remember that when you extend the health model of an object class, as we did to the Network Device class, all objects sharing that health model (that is, all network devices) will incorporate the custom monitor and make the monitor visible in the Health Explorer view. It is important to enable custom monitors only for those devices or device groups the monitors were created for.
Within several minutes after enabling the monitor for the switch that the VIP user computer connects to, the health model of the switch should update in the console to include the VIP Switch Security monitor in a Healthy state. To test the new monitor, we attempted to access the switch with an unauthorized community string. This properly generated an alert and changed the health status of the switch to Warning. Then we opened a Telnet session to the switch, which cleared the alert condition and restored the switch to Healthy status. See the switch’s Health Explorer open in Figure 17.41 to show the VIP Switch Security Monitor in a success state, after self-correcting from the warning state.
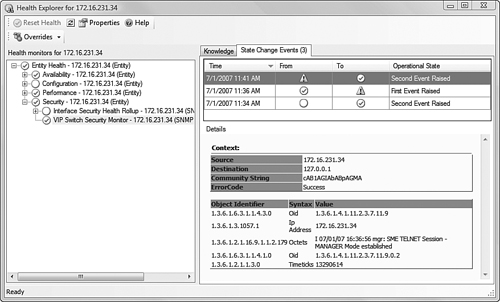
Perhaps you can see that SNMP monitors of both the probe type and the trap type are the stuff hardware management packs are made of. By knowing all the contents of a device’s MIB, you can create a parallel health model of SNMP monitors in OpsMgr. You could apply smart thresholds as additional criteria in the filter expressions of the probe and trap events, and you can add lots of relevant content in the alert descriptions and knowledge pages. You can optionally export the management pack the custom monitors are saved to for backup, sharing, or licensing of the management pack.
We left the comfort zone of the Windows operating system in this chapter, as we extended the scope of our management group to include network devices. We started with a dive into MIBs and OIDs, because the OpsMgr network device monitoring features are wrapped tightly around OIDs. We discovered several SNMP-enabled devices on our managed networks, and added those devices as objects to our management group using the Discovery Wizard and PowerShell. We configured our devices and management group components to receive SNMP traps and view them in the Operations console. We imported some hardware management packs and explored the kinds of features you can add to OpsMgr’s native SNMP monitoring capability. Finally, we created a pair of SNMP monitors that showed how you could extend the health model of network devices.
In the next chapter, we discuss various types of synthetic transactions you can use to monitor your environment.