4.6 Divisive Normalization Model in the Frequency Domain
While there has not been any biological evidence to suggest that cortical neurons are capable of performing a Fourier transform, there has been much evidence suggesting that they are capable of decomposing the visual stimulus into components, which are localized in both space and frequency domain, by using linear filters [56]. Thereby most spatial domain computational models – such as the BS model and its variations, and the AIM model – use linear filters (ICA basis functions or Gabor filters) to approximate the simple cortical response. In the filtering stage, the input image is decomposed into many feature maps. Then, lateral inhibition (centre–surround) – with its well known properties exhibited in simple cells of the V1 – is implemented in these feature maps to emphasize areas with high saliency. Finally, in the spatial domain, all feature maps are combined into a saliency map. Since features extraction in these spatial domain models needs a larger bank of filters, each image channel needs centre–surround processing which results in computational complexity. Contrarily, frequency domain models have very fast computation speed compared to spatial domain models, but in return, there isn't enough biological evidence to explain it. An idea has been proposed in [8, 45] to link the spatial model and the frequency domain model; it derives the frequency domain equivalent to the spatial domain models of biological processes. The initial feature extraction stage can be simplified as a partition of the frequency band in the Fourier transform domain, and the cortical surround inhibition can also be conducted by divisive normalization in the frequency domain. Then, the inverse Fourier transform of the resultant produces the saliency map. This model is biologically plausible in the spectral domain, and is called the frequency divisive normalization (FDN) model. When the frequency-band size reduces to one pixel, the FDN model is equivalent to PFT. However, FDN and other frequency domain models mentioned above are constrained by the global surround since the Fourier coefficients are global in space. In order to solve this constraint, a patch FDN (PFDN) is proposed in [8]. In the PFDN model Laplacian pyramids and overlapping local patches are adopted, so that it becomes more biologically plausible and has better performance than other state-of-the art-methods in both frequency and spatial domains.
4.6.1 Equivalent Processes with a Spatial Model in the Frequency Domain
For the computational models in the spatial model, all the steps are involved in three common stages: the image is decomposed into feature maps in scale, such as orientations and colours, each feature being processed by centre–surround inhibition, and these processed maps are recombined to form the saliency map. Without loss of generality, we take the BS model as an example: the corresponding three stages in the frequency domain are considered as follows.
1. Image decomposed stage
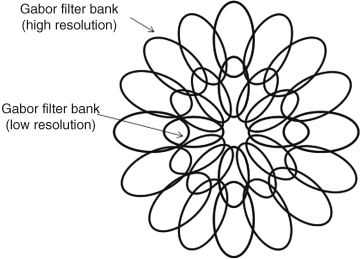
The BS model uses filters to decompose the input image into different feature channels; for instance, orientation features are modelled by convolution with Gabor filters in the intensity channel at different resolutions. In the spectral domain this operation can be regarded as some band-pass regions around different centre frequencies (sub-band) to multiply the 2D-spectrum of the input image. Since the Gabor filters in the BS model are symmetrical (zero phase spectrum in the frequency domain), the filtering in the spectral domain is equivalent to the product of band-pass regions and the amplitude spectrum of the input image. A sketch of the power spectrum for the Gabor filter bank in two resolutions is expressed in
Figure 4.14 (each ellipse represents a frequency band of a Gabor filter) in which the filter bank (filters in different orientations) with high resolution is located in higher-frequency regions and the low-resolution filter bank is distributed in the low-frequency region. Frequency bands of all filters are overlapped, and the band of the higher-resolution filter has larger regions than that of low resolution in the power spectrum. In practice, the number of filters in the high-frequency region is more than that in the low-frequency region in order to depict more details of the input image.
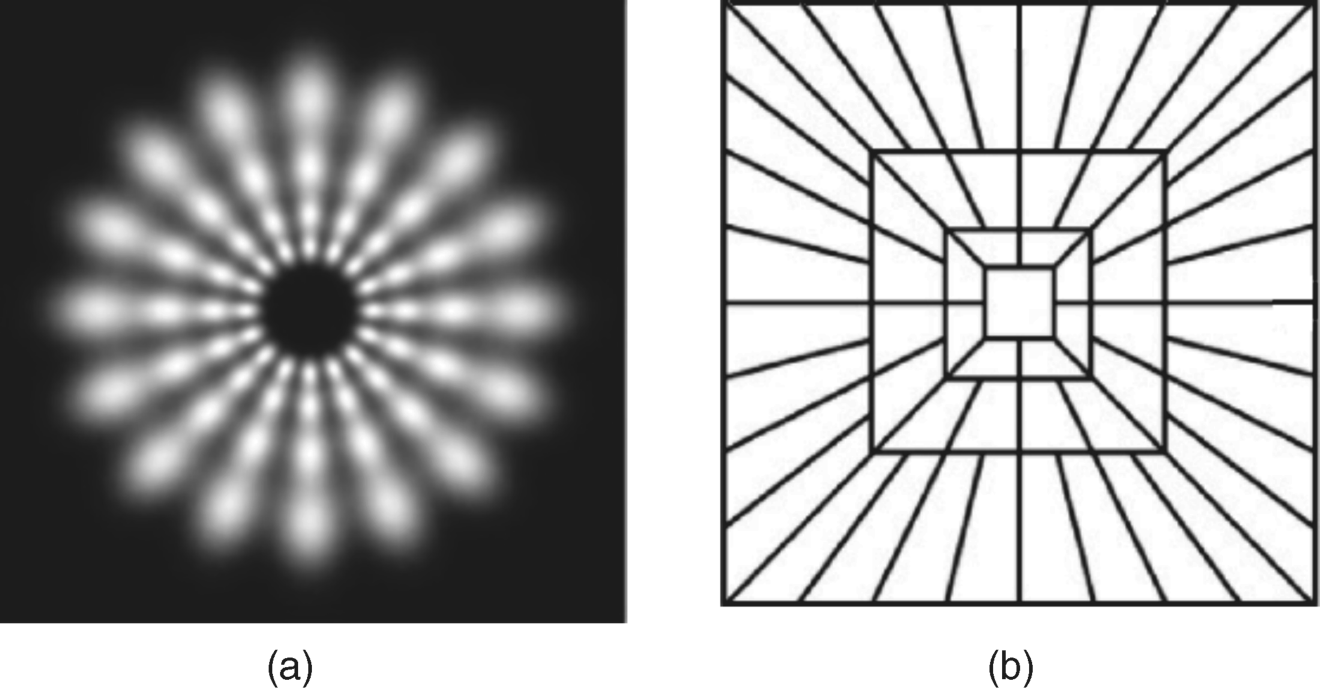
Figure 4.15(a) shows the power spectrum of Gabor filters in eight orientations of four resolutions after Fourier transform. (Note that the places with high luminance are the centres of filters and the overlapping between filters cannot be observed clearly due to low luminance values of the filter band's edges.) In addition, the number of filters should be different in each resolution as shown in
Figure 4.14. It can be seen from
Figure 4.15(a) that each Gabor filter in the spatial domain only occupies a small region of amplitude spectrum (or power spectrum), and therefore the decomposition of the input image can be completed by partitioning the amplitude spectrum of an image. A partitioning strategy is to use contourlet transform of frequency domain, a recent image processing method [57]. The contourlet transform is an orthogonal transform based on a 2D-multiscale directional filter bank, and can be finished by 2D-spectrum decomposition as in
Figure 4.15(b). The decomposition of the 2D-amplitude spectrum in contourlet transform is quite similar to 2D-Gabor filter bank compared to
Figure 4.14 and
4.15(a), but the differences can be stated as (1) the contourlet transform is an orthogonal transform, and therefore it can recover the original image by inverse contourlet transform, and the Garbor filter, as a transform, is not an orthogonal transform, so it cannot recover original image by inverse operation; (2) the shape of the spectrum partition in the contourlet transform is different from the Gabor filter bank, the ellipse for Gabor filter and the quadrilateral for contourlet filter; (3) there are no overlaps between contourlet filters in frequency domain, and each filter is an idea filter; that is the pixel value within frequency band of the filter is one, and out of the frequency band of the filter is zero. In addition, the number of contourlet filters in the higher-frequency region is more than that in the low-frequency region, which is biologically plausible, and the equivalent frequency domain model is referred to as a biologically plausible contourlet-like frequency domain approach [8].
2. Divisive normalization stage
Centre–surround processing in the BS model represents the lateral inhibition effect of cells in the visual cortex. It has been shown that this phenomenon of surround inhibition can be modelled by divisive normalization [58]. Experiments have revealed that the results of using the divisive normalization from Cavanaugh et al. were consistent with recordings from macaque V1 simple cells [59], which were introduced in Section 2.5.2. Divisive normalization means that the linear response of each cell is divided by the total activity from a large number of cortical cells. If the normalization pool is defined as the activity of a group of cells that represent a special feature, the normalization of the cell's response will reflect the inhibition between cells with the same feature.
Considering the divisive normalization in spatial domain first, let
ri(
n) be the coefficient of the
ith feature at location
n and refer to bold-faced
ri as a feature map that is obtained by filter (Garbor filter or contourlet filter in the spatial domain); then the normalization of feature map [58] can be expressed by
(4.55) 
where

is the divisive normalized coefficient of the feature map,
Nn is the neighbour of coefficient

,

is the weights in the neighbour of

and
c is a constant. We can see that each square coefficient of the feature map is divided by its sum of squared surrounding coefficients. The denominator of
Equation 4.55 represents the energy of the neighbour. If the surrounding coefficients (energy) of a feature map (e.g., vertical orientation) are larger – that is, a homologous feature (e.g., many vertical orientation bars) exists in input image – these same features (many vertical bars) will be suppressed by
Equation 4.55. Contrarily, if only one horizontal bar exists in the input image, it will be kept since the energy of the horizontal feature (the denominator of
Equation 4.55) is almost equal to the numerator in
Equation 4.55. Hence, the unique horizontal bar among many vertical bars can pop out.
If the neighbourhood in
Equation 4.55 is a whole feature map, divisive normalization is easy to implement in the frequency domain. Given input image
I, whose
kth coefficients of Fourier transform can be described by
(4.56) 
where

denotes Fourier transform,
R(
k) is the coefficient of Fourier transform at frequency component
k. Since, in the frequency domain, the feature map obtained by the orientation filter is a frequency band with a respective region range as shown in
Figures 4.14 and
4.15, according to Parseval's theorem [60], the squared sum of all coefficients for a feature map in the spatial domain should be proportional to the energy of its corresponding frequency sub-band, which is given by
(4.57) 
where

, (
a* is conjugate complex of
a), and
N is the number of pixels in the sub-band corresponding to the feature
i. For convenience of the inverse Fourier transform, we take the square root on both sides. If the parameters

and
c in
Equation 4.55 are the same for all coefficients, the denominator of
Equation 4.55 in the frequency domain, after taking the square root, can be rewritten as
(4.58) 
which is regarded as the normalization term in the frequency domain. Now the contourlet frequency partition is conducted in the 2D-amplitude spectrum, as shown in
Figure 4.15(b). The decomposition scheme is to separate the amplitude spectrum of the input image into feature maps in four scales with 16, 8, 4, and 1 orientations from the highest scale to the lowest, and we have in total 29 sub-bands corresponding to the 29 feature maps.
After calculating the normalization term for each sub-band,

, the divisive normalization in the frequency domain can be obtained by
(4.59) 
where

is the divisive normalized coefficient of sub-band
i, and

is the equivalent energy in sub-band
i. As with divisive normalization in the spatial domain the frequency sub-bands with higher energy concentration are suppressed.
3. Combination of all feature maps and get final saliency map
In the BS model, the saliency map is the combination of all the feature maps through weighted summation, or the maximum of all the feature maps at each location. In the frequency domain, it is very simple. Since the 29 sub-bands are not overlapped in the contourlet partition scheme, the entire amplitude spectrum of the divisive normalization in the frequency domain is to unite

over all sub-bands as shown in
Equation 4.60.
(4.60) 
The recombination stage is computed by inverse Fourier transform. After filtering the square of the recovered image by filter
G – as other frequency domain models do – the final saliency map is
(4.61) 
where W is constant.
The three essential steps can be summarized as: (1) in the frequency domain, feature extraction is the separation of the 2D-amplitude spectrum into many frequency sub-bands; (2) the divisive normalization is utilized to suppress sub-bands with higher energy concentration; (3) the inverse Fourier transform is used to obtain the spatial domain saliency map. Since the divisive normalization in the biologically plausible contourlet-like frequency domain approach is very important, this model is also called the frequency divisive normalization (FDN) model.
Because each step of the FDN model corresponds to most of the spatial domain models such as the BS model, it might be imagined that the results of the saliency maps would be close to the spatial domain model. However, we notice that the feature extraction in FDN does not need to convolve the input image with different filters, but uses partition of the frequency domain; this can greatly reduce the computational complexity. In addition, when the partition scheme in FDN considers each pixel of the 2D-amplitude spectra as a sub-band, it is simple with divisive normalization to set the value of each amplitude spectrum to one, which just becomes PFT.
FDN gives the biological evidence due to its resemblance of the BS model, which can partly account for the reason why the frequency domain model can achieve better results.
4.6.2 FDN Algorithm
The aforementioned FDN model only considers intensity and orientation features by using the Fourier transform of the intensity image. For the colour image, different colour features may be selected, such as RGB colour space, LAB colour space, broadly tuned colour used in PCT, and the red–green (RG) and blue–yellow (BY) opponent components implemented in the BS model and so on. The complete FDN algorithm from the input colour image to the final saliency map is as follows:
1. Pre-processing of the image: resize the image to a suitable scale and perform a colour space transform; choose one colour space and form several channels.
2. Perform a Fourier transform for each channel by using
Equation 4.56.
3. Group the the Fourier coefficients (amplitude spectrum) using the scheme given in
Figure 4.15(b) while keeping the phase spectrum.
4. Calculate the normalization term for each sub-band using
Equation 4.58; here the parameter weight
w and
c are set to one and zero respectively, for simplicity.
5. Following
Equations 4.59 and
(4.60) obtain the divisive normalization Fourier amplitude coefficients and unite them to the entire amplitude spectrum for each channel.
6. Calculate the inverse Fourier transform for each channel respectively to recover them to the corresponding spatial conspicuity maps.
7. Take the maximum among these spatial conspicuity maps across all channels to obtain one integrated map.
8. Square the integrated map, and then smooth it with low-pass Gaussian filter
G to obtain the final saliency map (
Equation 4.61).
It is worth noting that the conspicuity map of each channel is not directly calculated from Equation 4.61, and the integration of channels is not the summation of all channels' conspicuity results, but the maximum value at each location among the recovered spatial conspicuity maps as suggested in [61].
4.6.3 Patch FDN
It is known that the Fourier transform can only produce global features, even though the computation of divisive normalization in the amplitude spectrum is defined as a local area. Thereby the suppression of the high-energy region is performed for the whole feature map, which is a deficiency of the above frequency domain models. A lot of evidence has suggested that the spatial extent of surround inhibition was limited [62] and the surround size in the feature map should depend on the receptive field size of the V1 simple cells [63]. In order to overcome this global surround constraint, a patch FDN (PFDN) has been proposed [8], which separates the input image into overlapping local patches, and then conducts FDN on every patch. The final saliency map is the combination of all the divisive normalized patches by taking the maximum value as suggested in [61].
The complete PFDN algorithm is described as follows:
1. Perform a colour space transform by choosing one colour space, and form several channels, as FDN does.
2. Decompose the image of each channel into several scales using a Laplacian pyramid. For each scale of each channel, the image is separated into overlapping local patches with a shift size between patches. The size of all the patches is the same for simplicity.
For each patch, calculate steps 2–6 of the aforementioned FDN and obtain the spatial map. It should be noticed that grouping the Fourier coefficients of the patch to sub-bands is not always done by the contourlet scheme; sometimes simple square sub-bands are enough for these small-size patches
3. For each scale and each channel, recombine all the patches as a spatial map by taking the maximum value at each pixel location due to overlapping patches. Then several spatial conspicuity maps for different scales and channels are constituted.
4. Resize all scales to be of equal size and take the maximum across all scales and channels at each location as the value of the integrated map.
5. Square the integrated map, and then smooth it with low-pass Gaussian filter G to obtain final saliency map.
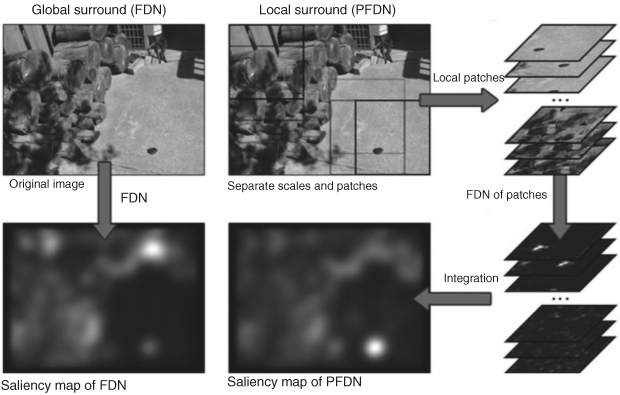
Patch FDN can overcome the global surrounding limitation. Sometimes a feature map may consists of high energy components globally, while including the low energy components related to the local area in the spatial domain. FDN cannot make the object pop out in the local area. Figure 4.16 shows an example in which there is a large empty area of asphalt with a small rubber object in the middle. The rubber object should be salient due to its prominence in the peripheral region, but the feature of the rubber object is similar to other objects located on the left and at the top of the image. In this image, FDN cannot detect the rubber object because the high energy of the global feature suppresses the rubber object, but PFDN with square patches of 24 × 24 pixels, overlapping 8 pixels between two patches, can find the object easily.
PFDN has better performance than FDN and other frequency domain models on some image databases [8], but the partition of scale and patch in PFDN is time consuming; the amount of PFDN computation is six times more than FDN and four times PQFT. Despite being slower than other frequency approaches, PFDN is still faster than spatial domain models.
As with other frequency domain models FDN and PFDN are programmable. MATLAB® code is available in this book.
![]()


