
Credit Derivatives and Hedging Credit Risk
In this entry, we examine practical tools for hedging credit risk at both the transaction level and the portfolio level, focusing on the interaction between the credit modeling technologies and traded instruments that would allow one to mitigate credit risk. We start with a discussion linking credit modeling and credit portfolio management in a practical way. We then turn to the credit default swap market as a potential hedging tool. Finally, the state of the art is discussed: hedging transaction level and portfolio credit risk using hedges that involve macroeconomic factors that are traded in the marketplace.
Figure 1 Cyclical Rise and Fall in 5-Year Reduced Form Default Probabilities: Citigroup and Ford Motor Company, 2006–2011

CREDIT PORTFOLIO MODELING: WHAT’S THE HEDGE?
One of the reasons that the popular value-at-risk (VaR) concept has been regarded as an incomplete risk management tool is that it provides little or no guidance on how to hedge if the VaR indicator of risk levels is regarded as too high. In a more subtle way, the same criticisms apply to many of the key modeling technologies that are popular in financial markets, like the copula approach to the simulation of credit portfolios. In this entry we summarize the virtues and the vices from a hedging perspective of both various credit modeling techniques and credit derivative instruments traded in the marketplace. One of the key issues that requires a lot of attention in credit portfolio modeling is the impact of the business cycle on default probabilities. Default probabilities rise and fall when the economy weakens and strengthens. This is both obvious and so subtle that almost all commercially available modeling technologies ignore it. It’s easy to talk about it and hard to do.
Figures 1 and 2 show the cyclical rise and fall in 5-year reduced-form default probabilities for Citigroup and Ford Motor Company for the periods 1990–2005 and 2006–2011.1 The figures show the obvious correlation in default probabilities for both companies as they rise or fall in the 1990–1991 recession and in the recession spanning 1999–2003, depending on the sector, but the greatest correlation is in the credit crisis period of 2007–2009. Over the full 1990–2011 period, their respective 5-year default probabilities have a simple correlation of 45.2%.
Figure 2 Cyclical Rise and Fall in 5-Year Reduced Form Default Probabilities: Citigroup and Ford Motor Company, 1990–2005

With this common knowledge as background, we begin with the hedging implications of the Merton model at the individual transaction and portfolio level (see Merton, 1974).
THE MERTON MODEL AND ITS VARIANTS: TRANSACTION-LEVEL HEDGING
As of this writing, every publicized commercial implementation of the Merton model or its variants has one principal assumption in common: The only random factor in the model is the “value of company assets.” Regardless of the variety of Merton model used, all models of this type have the following attributes in common when the value of company assets rises:
From a theoretical point of view, there are three obvious ways to think about hedging in the Merton context:
- Hedge a long position in the debt of the firm with a short position in the assets of the company.
- Hedge a long position in the debt of the firm with a short position in the common stock of the company.
- Hedge a long position in the debt of the firm with a short position in another debt instrument of the company.
The first hedging strategy is consistent with the assumptions of the Merton model and all of its commercial variants, because assets of the firm are assumed to be traded in perfectly liquid efficient markets with no transactions costs. Unfortunately, for most industrial companies, this is a very unrealistic assumption. Investors in Ford Motor Company cannot go long or short auto plants in any proportion. The third hedging strategy is also not a strategy that one can use in practice, although the credit derivative instruments we discuss in the next section provide a variation on this theme.
From a practical point of view, shorting the common stock is the most direct hedging route and the one that combines a practical hedge and one consistent with the model theory. Unfortunately, however, even this hedging strategy has severe constraints that restrict its practical use. Specifically, even if the Merton model or its variant is true, mathematically, the first derivative of the common stock price with respect to the value of company assets approaches zero as the company becomes more and more distressed. When the value of company assets is well below the amount of debt due, the common stock will be trading just barely above zero. One would have to short more and more equity to offset further falls in debt prices, and at some point a hedging strategy that shorts even 100% of the company’s equity becomes too small to fully offset the risk still embedded in debt prices. In short, even if the Merton model is literally true, the model fails the hedging test (“What’s the hedge?”) for deeply distressed situations.
What about companies that are not yet severely distressed? Jarrow and van Deventer (1998, 1999), analyzed a 9-year weekly data series of new issue fixed rate bond spreads collected by First Interstate Bancorp, which at the time was the seventh largest bank holding company in the United States. Over the sample period used by Jarrow and van Deventer, First Interstate’s debt ratings varied from AA to BBB. They analyzed the debt and equity hedge ratios produced by the Merton model (and its variants) and tested for biases that would reduce hedging errors. The results of that analysis showed that a common stock hedge in the opposite direction of that indicated by the Merton model (and its variants) would have improved results. That is, one should have gone long the equity even if one is long the debt, not short the equity. Jarrow and van Deventer are careful to point out that this strategy is certainly not recommended. The reason for this finding was simple: During the 9-year weekly data series beginning in 1984, credit spreads and stock price changes move in the direction predicted by the Merton model less than 45% of the time. Van Deventer and Imai (2003) obtain similar results over a much larger sample.
Jarrow and van Deventer make the point that the Merton model is clearly missing key variables that would allow credit spreads and equity prices to move in either the same direction or the opposite direction as these input variables change. None of the Merton models in commercial use have this flexibility and therefore any hedge ratios they imply are quite suspect.
What about companies that are not investment grade but do not yet fall in the “severely distressed” category? It is in this sector that individual transaction hedging using Merton-type intuition is potentially the most useful. Most of the research that has been done in this regard has been done on a proprietary basis on Wall Street. Even if the Merton model hedging is useful for companies in the BB and B ratings grade, how effective can it be in protecting the owner of a bond that once was rated AA but sinks to a distressed CCC? Whether or not hedging errors in the AA to BBB and CCC ratings ranges more than offset hedging benefits in the BB and B range is an important question. Modern corporate governance requires that users of the Merton model have evidence that it works in this situation, rather than relying on a belief that it works. On September 12, 2005, the Wall Street Journal reported on the hundreds of millions of dollars that were lost by arbitrageurs using Merton-type hedges on Ford and General Motors when both firms were downgraded by the major rating agencies.2
There are a few more points that one needs to make about the Merton model and all of its commercial variants when it comes to transaction level hedging:
- The Merton model default probability is not an input in this hedging calculation for the same reason that the return on the common stock is not an input in the Black-Scholes options model. The Merton model and all of its commercial variants incorporate all possible probabilities of default that stem from every possible variation in the value of company assets.
- Loss given default is also not an input in this hedging calculation because all possible loss given defaults (one for each possible ending level of company asset value) are analyzed by the Merton model and in turn have an impact on the calculated hedge ratio.
These insights are not widely recognized by analysts who consider hedging using the Merton technology. Given the value of company assets, we can calculate the Merton hedge ratio directly with no need for a default probability estimate or a loss given default estimate. If instead we are given the Merton (or its variants) default probability, we do not know the hedge ratio without full disclosure of how the default probability was derived. Any failure to make this disclosure is a probable violation of the Basel II capital accords from the Basel Committee on Banking Supervision.
THE MERTON MODEL AND ITS VARIANTS: PORTFOLIO- LEVEL HEDGING
One of the attractive things about the Merton model, in spite of the limitations mentioned above, is its simple intuition. We know that the basic businesses of Ford and General Motors are highly correlated, so it is a small logical step to think about how the assets of the two companies must be closely correlated. One has to make a very substantial set of additional assumptions if one wants to link the macroeconomic factors that drive correlated defaults to the value of company assets in the Merton framework or any of its one-factor commercial variants. Let’s assume away those complexities and assume that we know the returns on the assets of Ford have a 0.25 correlation with the returns on the assets of General Motors. Note that the 0.25 correlation does not refer to
- The correlation in the default probabilities themselves.
- The correlation in the events of default, defined as the vector of 0s and 1s at each time step where 0 denotes no default and 1 denotes default.
These are different and mathematically distinct definitions of correlation. Jarrow and van Deventer (1998, 1999) show some of the mathematical links between these different definitions of correlation. Jarrow and van Deventer (2005) formalize these results.
Once we have the correlation in the returns on the value of company assets, we can simulate correlated default as follows:
- We generate N random paths for the values of company assets of GM and Ford that show the assumed degree of correlation.
- We next calculate the default probability that would prevail, given that level of company assets, at that point in time in the given scenario.
- We then simulate default/no default.
For any commercial variant of the Merton model, an increase in this “asset correlation” results in a greater degree of bunching of defaults from a time perspective. This approach was a common first step for analysts evaluating first-to-default swaps and collateralized debt obligations because they can be done in common spreadsheet software packages with a minimum of difficulty.
There are some common pitfalls to beware of in using this kind of analysis that are directly related to the issues raised about the Merton framework and its commercial variants:
- If one is using the original Merton model of risky debt, default can happen at only one point in time: the maturity date of the debt. This assumption has to be relaxed to allow more realistic modeling.
- If one is using the “down and out option” variation of the Merton model, which dates from 1976, one has to specify the level of the barrier that triggers default at each point in time during the modeling period.
Unless one specifically links the value of company assets to macroeconomic factors, the portfolio simulation has the same limitations from a hedging point of view as a single transaction. As explained earlier, the hedge using a short position in the common stock would not work for deeply troubled companies from a theoretical point of view and it does not work for higher rated credits (BBB and above) from an empirical point of view.
If one does link the value of company assets to macroeconomic factors, there is still another critical and difficult task one has to undertake to answer the key question: “What’s the hedge?” One needs to convert the single-period, constant interest rates Merton model or Merton variant to a full valuation framework for multiperiod fixed-income instruments, many of which contain a multitude of embedded options (like a callable bond or a line of credit). One of the many lessons of the Wall Street Journal article cited above and subsequent experience in 2007–2009 is easy to summarize: This approach to hedging and simulating credit risk (called the “copula approach” as well as the Merton approach) simply did not work. Salmon (2009) called the Merton/copula approach the “formula that killed Wall Street” via the $945 billion in credit losses that resulted from the credit crisis.3
What if we want to use the Merton/copula approach in spite of its role in recent losses? As Lando (2004) discusses, this is a large set of nontrivial analytical issues to deal with. Most importantly, moving to a multiperiod framework with random interest rates leads one immediately to the reduced form model approach, where it is much easier for the default probability models to be completely consistent within the valuation framework. We turn to that task now.
Reduced-Form Models: Transaction-Level Hedging
One of the many virtues of the reduced form modeling approach is that it explicitly links factors driving default probabilities, like interest rates and other macroeconomic factors, to the default probabilities themselves. Just as important, the reduced form framework is a multiperiod, no-arbitrage valuation framework in a random interest rate context. Once we know the default probabilities and the factors driving them, credit spreads follow immediately, as does valuation. Valuation, even when there are embedded options, often comes in the form of analytical closed-form solutions. More complex options require numerical methods that are commonly used on Wall Street. The ability to stress test portfolio values and portfolio losses with respect to macro factor movements is now required by the European Central Bank and by U.S. bank regulators via two programs: the Comprehensive Capital Assessment Review and the Supervisory Capital Assessment Program. The later program, required of the top 19 U.S. financial institutions in 2009, mandated stress tests with respect to changes in home prices, real gross domestic product, and the unemployment rate.
Suffice it to say that for any simulated value of the risk factors driving default, there are two valuations that can be produced in the reduced form framework. The first valuation is the value of the security in the event that the issuer has not defaulted. This value can be stress tested with respect to the risk factors driving default to get hedge ratios with respect to the nondiversifiable risk factors. The second value that is produced is the value of the security given that default has occurred. In the reduced form framework of Duffie and Singleton (1999) and Jarrow (2001), this loss given default can be random and is expressed as a fraction of the defaultable instrument one instant prior to default.
These default-related jumps in value have two components. The first part is the systematic (if any) dependence of the loss given default or recovery rate on macroeconomic factors. The second part is the issuer-specific default event, since (conditional on the current values of the risk factors driving default for all companies) the events of default are independent. At the individual transaction level, this idiosyncratic company-specific component can only be hedged by shorting a defaultable instrument of the same issuer or a credit default swap of that issuer.
At the portfolio level, this is not necessary. We explain why next.
Reduced-Form Models: Portfolio-Level Hedging
One of the key conclusions of a properly specified reduced form model is that the default probabilities of each of N companies at a given point in time are independent, conditional on the values of the macroeconomic factors driving correlated defaults. That is, as long as none of the factors causing correlated default have been left out of the model, then by definition, given the value of these factors, default is independent. This is an insight of Jarrow, Lando, and Yu (2005).
This powerful result means that individual corporate credit risk can be diversified away, leaving only the systematic risk driven by the identified macroeconomic variables. This means that we can hedge the portfolio with respect to changes in these macroeconomic variables just as we do in every hedging exercise: We mark to market the portfolio on a credit-adjusted basis and then stress test with respect to one macroeconomic risk factor. We calculate the change in value that results from the macroeconomic risk factor shift and this gives us the “delta.” We then can calculate the equivalent hedging position to offset this risk. This is a capability that is present in modern enterprise-wide risk management software.4
This exercise needs to be done for a wide range of potential risk factor shifts, recognizing that some of the macroeconomic risk factors are in fact correlated themselves. Van Deventer, Imai, and Mesler (2004) outline procedures for doing this in great detail.
We turn now to commonly used credit-related derivative instruments and discuss what role they can play in a hedging program.
CREDIT DEFAULT SWAPS AND HEDGING
Credit default swaps in their purest form provide specific credit protection on a single issuer. They are particularly attractive when the small size of a portfolio (in terms of issuer names) or extreme concentrations in a portfolio rule out diversification as a vehicle for controlling the idiosyncratic risk associated with one portfolio name.
Generally speaking, credit default swaps should only be used when diversification does not work. As we discuss in a later section, dealing directly in the macroeconomic factors that are driving correlated default is much more efficient both in terms of execution costs and in terms of minimizing counterparty credit risk. An event that causes a large number of corporate defaults over a short time period would also obviously increase the default risk of the financial institutions that both lend to them and act as intermediaries in the credit default swap market. This insight was not widely appreciated as recently as 2006, but it is now. The bankruptcy of Lehman Brothers on September 15, 2008, the March 2008 rescue of Bear Stearns, and the September 2008 rescues of Merrill Lynch (by Bank of America with U.S. government support) and Morgan Stanley (by the Federal Reserve) have convinced any doubters of the importance of counterparty credit risk in the credit default swap market. As of this writing, only 14 dealers are registered to clear credit default swaps with the Depository Trust and Clearing Corporation.5
Many researchers have begun to find that credit spreads and credit default swap quotations are consistently higher than actual credit losses would lead one to expect.6 How can such a “liquidity premium” persist in an efficient market? From the perspective of the insurance provider on the credit default swap, in the words of one market participant, “Why would we even think about providing credit insurance unless the return on that insurance was a lot greater than the average losses we expect to come about?” That preference is simple enough to understand, but why doesn’t the buyer of the credit insurance refuse to buy insurance that is “overpriced”?
One potential explanation is related to the lack of diversification that individual market participants face even if their employers are fully diversified. An individual fund manager may have only 10–20 fixed income exposures and a bonus pool that strictly depends on his or her ability to outperform a specific benchmark index over a specific period of time. One default may devastate the bonus, even if the fund manager in 1 billion repeated trials may in fact outperform the benchmark. The individual has more reason to buy single-name credit insurance than the employer does because (1) his or her work-related portfolio is much less diversified than the entire portfolio of the employer, (2) the potential loss of the bonus makes him or her much more risk averse than the employer, and (3) the employer is much less likely to be aware that the credit insurance is (on average) overpriced than the individual market participant. Jarrow, Li, Mesler, and van Deventer (2007) have quantified the magnitude of this premium and shown that factors as diverse as company size (bigger firms get smaller spreads) and location (Japanese firms get smaller spreads) affect the premium of CDS spreads over default risk. These premiums are available daily via the Thomson Reuters “Credit Views” page.7
A more important concern with credit default swap hedging is the very thin trading volume in the CDS market in the aftermath of the credit crisis. A study8 found the following:
- Only 241 corporate reference names averaged more than 5 trades per day.
- Only 63 reference names averaged more than 10 trades per day.
- Only 14 reference names averaged more than 15 trades per day.
- No reference names averaged more than 23 trades per day.
Given these low volumes, there is a serious risk of market manipulation that should give any potential hedger great concern.
PORTFOLIO- AND TRANSACTION-LEVEL HEDGING USING TRADED MACROECONOMIC INDICES
The instantaneous probability of default can be specified as a linear function of one or more macroeconomic factors. An example is the case where the default intensity is a linear function of the random short-term rate of interest r and a macroeconomic factor with normally distributed return Z:
![]()
The constant term in this expression is an idiosyncratic term that is unique to the company. Random movements in the short rate r and the macroeconomic factor Z will cause correlated movements in the default intensities for all companies whose risk is driven by common factors. The default intensity has a term structure like the term structure of interest rates, and this entire term structure moves up and down with the business cycle as captured by the macroeconomic factors. The parameters of this reduced from model can be derived by observable histories of bond prices of each counterparty or from observable histories of credit derivatives prices using enterprise-wide risk management software.
Alternatively, a historical default database can be used to parameterize the term structure of default probabilities using discrete instead of continuous default probabilities, just as discrete interest rates are used in practice based on yield curve movements in continuous time. The most common approach to historical default probability estimation uses logistic regression. For each company, monthly observations are denoted 0 if the company is not bankrupt in the following month and 1 if the company does go bankrupt in the next month. Explanatory variables Xi are selected and the parameters α and β, which produce the best fitting predictions of the default probability using the following logistic regression formula:
![]()
By fitting this logistic regression for each default probability on the default probability term structure, one can build the entire cumulative and annualized default probability term structures for a large universe of corporations. Figure 28.3 shows the cumulative term structure of default probabilities for Washington Mutual, just prior to its failure in September 2008.
Figure 3 Cumulative Term Structure of Default Probabilities for Washington Mutual: September 2008, One Day Prior to Default

Alternatively, one can annualize the entire term structure of default probabilities for easy comparison with credit spreads and credit default swap quotations. The resulting curve is downward sloping for high-risk credits like Washington Mutual (see Figure 4).
Figure 4 Annualized Term Structure of Default Probabilities for Washington Mutual: September 2008, One Day Prior to Default

The key advantage of the reduced-form approach is that critical macroeconomic factors can be linked explicitly to default probabilities as explanatory variables. The result is a specific mathematical link like the linear function of the pure Jarrow reduced form model or the logistic regression formula used for historical database fitting. The logistic regression formula is very powerful for simulating forward since it always produces default probability values between zero and 100%. These values can then be converted to the linear Jarrow form for closed-form mark-to-market values for every transaction in a portfolio.
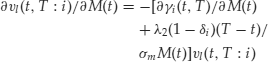
Van Deventer, Imai, and Mesler (2004) then summarize how to calculate the macroeconomic risk factor exposure as follows. The Jarrow model is much better suited to hedging credit risk on a portfolio level than the Merton model because the link between the (N) macro factor(s) M and the default intensity is explicitly incorporated in the model. Take the example of Washington Mutual, whose probability of default is driven by interest rates and home prices, among other things. If M(t) is the macro factor defined as the one-year change in home prices, it can be shown that the size of the hedge that needs to be bought or sold to hedge one dollar of risky debt zero coupon debt with market value v under the Jarrow model is given by
The variable ν is the value of risky zero-coupon debt and γ is the liquidity discount function representing the illiquidities often observed in the debt market. There are similar formulas in the Jarrow model for hedging coupon-bearing bonds, defaultable caps, floors, credit derivatives, and so on.
In practice, these hedge ratios are derived from a sophisticated simulation on “best practice” enterprise-wide risk management software. Van Deventer and Imai (2003) show that the steps in hedging the macro factor risk for any portfolio are identical to the steps that a trader of options has been taking for 30 years (hedging the net position with a long or short position in the common stock underlying the options):
- Calculate the change in the value (including the impact of interest rates on default) of all retail credits with respect to interest rates.
- Calculate the change in the value (including the impact of interest rates on default) of all small business credits with respect to interest rates.
- Calculate the change in the value (including the impact of interest rates on default) of all major corporate credits with respect to interest rates.
- Calculate the change in the value (including the impact of interest rates on default) of all bonds, derivatives, and other instruments.
- Add these “delta” amounts together.
- The result is the global portfolio “delta,” on a default-adjusted basis, of interest rates for the entire portfolio.
- Choose the position in interest rate derivatives with the opposite delta.
- This eliminates interest rate risk from the portfolio on a default-adjusted basis.
We can replicate this process for any macroeconomic factor that impacts default, such as home prices, exchange rates, stock price indices, oil prices, the value of class A office buildings in the central business district of key cities, and so on.
Most importantly,
- We can measure the default-adjusted transaction level and portfolio risk exposure with respect to each macroeconomic factor.
- We can set exposure limits on the default-adjusted transaction level and portfolio risk exposure with respect to each macroeconomic factor.
- We know how much of a hedge would eliminate some or all of this risk.
The reason this analysis is so critical to success in credit risk portfolio management is the all-pervasiveness of correlated risk. Let us put aside the 2007–2009 credit crisis and look at other recent history. Take the Japan scenario. At the end of December 1989, the Nikkei stock price index had reached almost 39,000. Over the course of the next 14 years, it traded as low as 7,000. Commercial real estate prices fell by more than 60%. Single-family home prices fell in many regions for more than 15 consecutive years. More than 135,000 small businesses failed. Six of the 21 largest banks in Japan were nationalized in a span of two years. How would this approach have worked in Japan?
First of all, fitting a logistic regression for small businesses in Japan over this period shows that the properly specified inputs for the Nikkei and the yen/U.S. dollar exchange rates have t-score equivalents of more than 45 standard deviations from zero in a logistic regression. By stress testing a small business loan portfolio with this knowledge, we would have known how many put options on the Nikkei and put options on the yen were necessary to fully or partially offset credit-adjusted mark-to-market loan losses, just as the Federal Deposit Insurance Corporation announced it was doing in its 2003 Loss Distribution Model.9
This same approach works with
- Retail loan portfolios
- Small business loan portfolios
- Large corporate loan, bond, derivative, and other portfolios
- Sovereign and other government exposures
If common factors are found to drive each class of loans, then we have enterprise-wide correlations in defaults. An identical approach in the U.S. market would have spared many financial institutions tens of billions in losses that resulted from an inability to do the stress tests described above and that are now mandated by the U.S. government and the European Central Bank.
The key to success in this analysis is a risk management software package that can handle it.10 What is also important in doing the modeling is to recognize that macroeconomic factors that are exchange traded (such as the S&P 500, home price futures, etc.) are much preferred to similar indicators that are not traded (such as the Conference Board index of leading indicators or the unemployment rate).
If one takes this approach, total balance sheet credit hedging is very practical
- Without using credit derivatives
- Without using first-to-default swaps
- Without using Wall Street as a counterparty from a credit risk point of view
All of these benefits are critical to answer the key question of “What’s the hedge?”
KEY POINTS
- It is not enough to know only the default risk of a counterparty. Over the full portfolio, a financial institution needs to know the answer to the question “What is the hedge?” if the measured credit risk is uncomfortably large.
- The major U.S. (2007–2009) and Japanese (1990–2002) financial institutions required government bailouts in the trillions of dollars because of their inability to measure and hedge macro factor risks like those of home price movements and commercial real estate price movements.
- The Merton model is a logical place to start thinking about how to hedge because of its simple structure and focus on the value of company assets.
- Unfortunately, for theoretical reasons alone, hedging in the Merton framework does not work for a company that is highly distressed. A perfect hedge could easily require a short position of more than 100% of the shares of outstanding common stock.
- The only practical and accurate approach to hedging credit risk is the reduced form modeling approach.
- Hedging with credit default swaps is not practical because of the high degree of counterparty credit risk that is now obvious in the wake of the 2007–2009 credit crisis and the effective failures of investment banking firms like Bear Stearns, Lehman Brothers, Morgan Stanley, and Merrill Lynch. Moreover, trading volume in the credit default swap market is now so thin that large trades cannot be efficiently executed, and the risk of market manipulation is very high.
- The reduced form approach explicitly links macro factors to both observable bond and CDS prices and to a historical default database. A similar approach links macro factors to credit spreads and recovery rates. The recovery on a mortgage that is in default is an example. Obviously, it depends on the value of the house that is collateral.
- Delta hedging of aggregate portfolio exposure to these macro factors that drive credit risk is done in best practice enterprise-wide risk management software.
- This modern application of stress testing, applied to a longer list of macro factors than interest rates alone, is not just theory. It is now mandated by the European Central Bank and U.S. regulatory authorities.
NOTES
1. Default probabilities presented in this chapter are supplied by Kamakura Corporation.
2. See Whitehouse (2005).
3. International Monetary Fund, Global Stability Report, as reported by the Financial Times, April 8, 2008.
4. See “Kamakura Risk Manager In Depth,” July 2011, available on www.kamakuraco.com for an example.
5. See www.dtcc.com for a list of dealers and related CDS trading volume.
6. See Chapter 18 in van Deventer, Imai, and Mesler (2004) for a summary of the research in this area.
7. The credit views page compares credit default swap spreads reported by Markit Partners with default probabilities from Kamakura Risk Information Services.
8. van Deventer (2010).
9. See press release dated December 10, 2003, on www.fdic.gov .
10. See, for example, the Kamakura Risk Manager risk management software system.
REFERENCES
Duffie, D., and Singleton, K. (1999). Modeling term structures of defaultable bonds. Review of Financial Studies 12: 197–226.
Jarrow, R. A. (2001). Default parameter estimation using market prices. Financial Analysts Journal 57: 75–92.
Jarrow, R. A., Lando, D., and Yu, F. (2005). Default risk and diversification: Theory and empirical applications. Mathematical Finance 15: 1–26.
Jarrow, R. A., Li, L., Mesler, M., and van Deventer, D. R. (2007). The determination of corporate credit spreads. Risk Magazine (September).
Jarrow, R. A., and van Deventer, D. R. (1998). Integrating interest rate risk and credit risk in asset and liability management. In Asset and Liability Management: The Synthesis of New Methodologies. London, UK: Risk Publications.
Jarrow, R. A., and van Deventer, D. R. (1999). Practical usage of credit risk models in loan portfolio and counterparty exposure management: An update. In D. Shimko (ed.), Credit Risk Models and Management. London, UK: Risk Publications.
Jarrow, R. A., and van Deventer, D. R. (2005). Estimating default correlations using a reduced form model. Risk Magazine (January).
Lando, D. (2004). Credit Risk Modeling. Princeton, NJ: Princeton University Press.
Merton, R. C. (1974). On the pricing of corporate debt: The risk structure of interest rates. Journal of Finance 29: 449–470.
Salmon, F. (2009). Recipe for disaster: The formula that killed Wall Street. Wired Magazine, February 23.
van Deventer, D. R. (2010). Kamakura Blog: Daily trading volumes in credit default swaps. www.riskcenter.com.
van Deventer, D. R., and Imai, K. (2003). Credit Risk Models and the Basel Accords. Hoboken, NJ: John Wiley & Sons.
van Deventer, D. R., Imai, K., and Mesler, M. (2004). Advanced Financial Risk Management: Tools and Techniques for Integrated Credit Risk and Interest Rate Risk Management. Hoboken, NJ: John Wiley & Sons.
Whitehouse, M. (2005). Slices of risk: How a formula that ignited market burned some big investors. Wall Street Journal, September 12, p. 1.