
Sometimes the data that we will analyze is a variable measured at fixed time intervals; when we have such data, we are talking about a time series. More specifically, at each step of the time series, there is more than one possible outcome and part of the outcome for each step is randomized and might only depend on a few steps back in time. For these reasons, simple linear regression does not work. In time series analysis, we build models to explain the variations in time, which is sometimes referred to as longitudinal analysis.
This chapter covers the following topics in time series analysis:
- Time series modeling, its usefulness, and how Pandas handles data
- Various common patterns in time series
- The concept of stationarity and how to test and make your data stationary
- Resampling, smoothing, and calculating rolling statistics
- How to model the known variations and make short forecasts
We start off with some more information about time series and what insights analyzing it can give.
Time series analysis is important in several types of situations; it can be used, for example, to describe changes of a variable in time, predict or forecast through modeling the known variations, and then extrapolate these forward in time or assess how certain external stimuli affects a certain time series variable.
There are three main types of modeling and forecasting methods:
- Extrapolation, which is the time series analysis we are focusing on in this chapter. This method simply uses historical data from which a model is built and then used to forecast/predict (that is, extrapolate) into the future.
- Judgemental, which is used in, for example, decision making and is common where judgment or beliefs (that is, probabilities) need to be incorporated. This can be the case when no historical time series data exists.
- Econometric, which is a regression-based method and usually tries to quantify how and to what extent certain variables/events affect the outcome of the time series. As the name suggests, this is sometimes used in economy studies.
There are other methods such as the Naïve approach (using the last historical value or values as the forecast); however, we are going to focus on the method most useful for time series analysis in general—the extrapolation method. Most industries use time series analysis at some point in their workflow. Two obvious examples are as follows:
- Retail: How much of a certain product should be kept in stock and how much will be sold?
- Finance: Managing assets, given the stock data of the previous months, will the stock go up or down tomorrow?
A time series dataset can be seen as a series of y values at a fixed interval in time, thus no x axis values are part of the data. This can be expressed as follows:
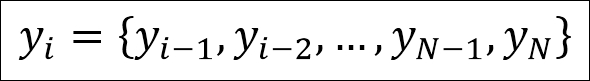
Here, each y in the set is just each value at a certain point in time. With these things covered, you are ready to learn about time series analysis in Python with Pandas and statsmodels.
As usual, open Jupyter, start a new notebook, and type in the default imports. I added a few imports as we will use them throughout the chapter. The extra imports, except the default ones (described in Chapter 1, Tools of the Trade) are as follows:
from pandas.io import data, wb
import scipy.stats as st
from statsmodels.tsa import stattools as stt
from statsmodels import tsa
import statsmodels.api as smapi
Here, just as mentioned before, you have to replace pandas.io with pandas_datareader if you have the Pandas version where it is split into a separate package. Furthermore, I will make use of the despine() function that we defined earlier, so make sure that you have it in a cell. As you can see, the main package that I will use is statsmodels; it has some nice functions to make time series analysis a bit easier. The statsmodels developers are working on upgrading the time series analysis to include more advanced functions, so keep an eye out for updates. To start off the analysis, I will read in the first data and go through some unique methods and characteristics that a Pandas time series object has.