
Consistent with Donald Knuth’s much-ballyhooed quote that “premature optimization is the root of all evil,” I’ve left the topic of optimization until nearly the end of this book. In this chapter we'll optimize our bowling app and go over the precursors to that process, establishing the target performance and measuring the current performance. The project for this chapter on http://learnunity4.com/ contains the optimized scripts and optimization helper scripts developed in this chapter.
There’s a saying, “Fast, good, or cheap. Pick two.” That’s generally the case with optimization. Among quality, space, and speed, you can often at best achieve two of the three, at the expense of the third.
Before you start optimizing, you should establish your target frame rate. iOS devices refresh their screens 60 times per second, but by default, Unity iOS builds attempt to achieve 30 frames per second (fps). Targeting a frame rate at half the device refresh rate is less demanding on the device battery, and 30 fps is a lot easier to achieve than 60 fps. Our bowling game is simple, so you should be able to hit 60 fps if you’re willing to make some compromises.
It might seem obvious to always target the highest possible frame rate, but if a game switches frequently between 30 fps and 60 fps, the discontinuity may be more distracting than just steadily running at 30 fps. Nevertheless, it makes sense to start with a target of 60 fps before profiling, so you can see your peak performance and then lower it later if you need to.
There’s no way to set the target frame rate in the Unity Editor, but fortunately, you can adjust the target frame rate in a script by setting the static variable Application.targetFrameRate. So let’s create a new JavaScript script, place it in the Scripts folder, and name it FuguFrameRate (Figure 16-1).

Figure 16-1. Adding a script in the Scripts folder
This will be a really short script, with one public variable and a Start callback containing just one line of code (Listing 16-1).
Listing 16-1. Complete Script for FuguFrameRate.js
#pragma strict

public var frameRate:int = 60;

function Start() {
        Application.targetFrameRate = frameRate;
}
The script sets the target frame rate by changing the value of the static variable Application.targetFrameRate to the value of frameRate, which is a public variable so it can be adjusted in the Inspector View. Since iOS devices all have a screen refresh rate of 60 fps, that’s the best frame rate you can achieve, and thus a reasonable default value for frameRate.
To utilize the FuguFrameRatescript, it has to be added to a scene so that its Start callback is executed when the game starts. So let’s create an empty GameObject in the bowling scene, name it FrameRate, and drag the FuguFrameRate script onto it (Figure 16-2).

Figure 16-2. Frame rate script included in the bowling scene
This script was added to our bowling scene, but you could just as well have added it to our splash scene instead, since Application.targetFrameRate only needs to be set once and it stays at that value even when a new scene is loaded. Our current splash scene doesn’t really do anything, so running at Unity’s default 30 fps is fine.
However, if the splash scene were to display a cool animation, you might want to set it at 60 fps, and in that case, you would also add the frame rate script to that scene. In fact, if the splash scene looked best at 60 fps and the bowling scene ran more smoothly at 30 fps (rather than jittering between 30 fps and 60 fps), you would add the frame rate script to both scenes, setting the target frame rate to 60 fps in the splash scene and 30 fps in the bowling scene.
Besides frame rate, you should also set a goal for the app size. You have to compete for room on iOS devices with songs, photos, videos, and all the other apps that users install. A smaller footprint makes the decision easier for a user to keep your app.
A smaller app also downloads in less time and loads faster (both the app load and level loads). Especially important, the App Store limits downloads over cellular connections to apps under 50MB in size. You don’t want to miss out on impulse buys, so 50MB is a good app size target. This constraint is much easier to meet than the App Store’s original 20MB limit, but any app with significant content can still easily exceed that size (HyperBowl, with six lanes, is around 40MB).
Before you start optimizing, you need to know what to optimize. That’s where profiling, obtaining performance information about the game, comes in. You have options ranging from statistics displayed in the Editor, to profiling the app itself, and even writing some of your own performance measurement code.
In the Editor, you have immediate access to performance-related information about the scene using the Stats overlay in the Game View (Figure 16-3).
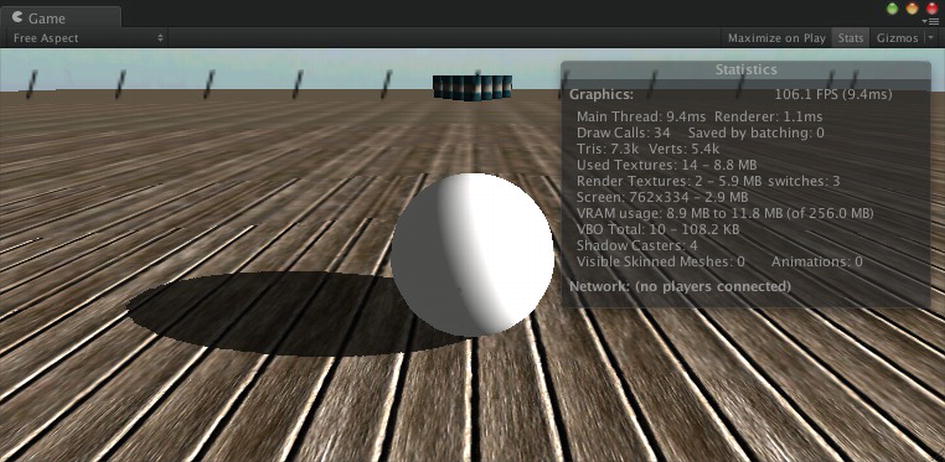
Figure 16-3. The Game View statistics overlay
When you click Play, you’ll see these statistics update while the game is in progress. This information is convenient, but it’s no substitute for profiling the actual app.
The Build Log
Minimizing your app size is not as important as it used to be, when exceeding 20MB meant that an app could only be downloaded onto a device over Wi-Fi, not 3G wireless. Now the limit is a more generous 50MB, but this is still easy to reach if you’ve got a big game, and smaller means faster downloads and more people can fit your app into devices with less free storage (I always fill up my iPads fairly quickly).
You can see a breakdown of assets that went into your app by checking the Editor log after a build, as shown in Listing 16-2.
Listing 16-2. Build information in the Editor Log
Textures      5.2 mb      16.9%
Meshes        17.4 kb     0.1%
Animations    0.0 kb      0.0%
Sounds        21.2 mb     69.1%
Shaders       0.0 kb      0.0%
Other Assets  19.1 kb     0.1%
Levels        10.7 kb     0.0%
Scripts       175.2 kb    0.6%
Included DLLs 4.1 mb      13.3%
File headers  16.6 kb     0.1%
Complete size 30.6 mb     100.0%
Used Assets, sorted by uncompressed size:
 21.1 mb         69.0% Assets/Assets/Free/Assets/Sci-Fi_Ambiences/Sci-fi_AmbienceLoop1.wav
 4.0 mb          13.1% Assets/Textures/LearnUnityCover.jpg
 170.8 kb        0.5% Assets/Standard Assets/Skyboxes/Textures/Sunny3/Sunny3_up.tif
 170.8 kb        0.5% Assets/Standard Assets/Skyboxes/Textures/Sunny3/Sunny3_right.tif
 170.8 kb        0.5% Assets/Standard Assets/Skyboxes/Textures/Sunny3/Sunny3_left.tif
 170.8 kb        0.5% Assets/Standard Assets/Skyboxes/Textures/Sunny3/Sunny3_front.tif
 170.8 kb        0.5% Assets/Standard Assets/Skyboxes/Textures/Sunny3/Sunny3_back.tif
 170.8 kb        0.5% Assets/Standard Assets/Light Flares/Sources/Textures/50mmflare.psd
 170.8 kb        0.5% Assets/Barrel/Barrel_D.tga
 31.2 kb         0.1% Assets/Assets/Free/Assets/8Bit/Coin_Pick_Up_03.wav
 17.4 kb         0.1% Assets/Barrel/Barrel.fbx
 17.3 kb         0.1% Assets/Substances_Free/Wood_Planks_01.sbsar
 10.8 kb         0.0% Assets/Standard Assets/Skyboxes/Textures/Sunny3/Sunny3_down.tif
 1.0 kb          0.0% Assets/Prefabs/BarrelPin.prefab
 0.6 kb          0.0% Assets/Standard Assets/Light Flares/50mm Zoom.flare
 0.3 kb          0.0% Assets/Standard Assets/Skyboxes/Sunny3 Skybox.mat
The log lists a breakdown of your app size by type of asset—textures, audio, meshes, scripts—and a list of the individual assets that went into it. Unfortunately, the size contributions are based on uncompressed sizes and not the final compressed asset sizes, but it still give you an idea of which assets are taking the most space.
The log also provides a way to find out which assets in your project are used or not used, via the handy search field in the Console app. For example, all the textures for Fugu Bowl are in the Textures folder, so to check which of those Textures are used and which ones can be remove from the project, select Editor Log in the Console View menu, which should launch the Console app with the Editor log selected (Figure 16-4).

Figure 16-4. Filtering the build log using the Console app search field
In the search box type “Textures” to filter the display. Then you can compare the resulting list with the Textures folder in the Project View and see if there’s anything in the Project View that didn’t end up in the build.
After the Unity iOS build has generated its Xcode project, you have the option of activating the built-in profiler, which reports information similar to the Stats overlay in the Game View. To activate the built-in profiler, also referred to in the Unity documentation as the internal profiler, select the header file iPhone_Profiler.h in the Xcode project, listed inside the Classes folder, and change the value of ENABLE_INTERNAL_PROFILER from 0 to 1 (Figure 16-5).

Figure 16-5. Built-in profiler switch in the Unity Xcode project
Now when you click Play, the app will recompile with the built-in profiler enabled, and the debug area of Xcode will display statistics, as shown in Listing 16-3, after every 30 frames while the game is running.
Listing 16-3. Built-In Profiler Output on a Fourth-Generation iPod Touch
iPhone Unity internal profiler stats:
cpu-player>    min: 39.8   max: 63.2   avg: 58.0
cpu-ogles-drv> min:  2.1   max:  3.7   avg:  2.4
cpu-present>   min:  0.7   max:  6.6   avg:  1.8
frametime>     min: 47.7   max: 72.2   avg: 64.5
draw-call #>   min:  40    max:  40    avg:  40     | batched:     0
tris #>        min:  5544  max:  5544  avg:  5544   | batched:     0
verts #>       min:  4358  max:  4358  avg:  4358   | batched:     0
player-detail> physx:  0.0 animation:  0.0 culling  0.0 skinning:  0.0 batching:  0.0 render: 58.0 fixed-update-count: 0 .. 0
mono-scripts>  update:  0.2   fixedUpdate:  0.0 coroutines:  0.1
mono-memory>   used heap: 405504 allocated heap: 524288  max number of collections: 0 collection total duration:  0.0
The first number to look at in the profile is the frametime, which is the total amount of time taken by a frame, in milliseconds. If you’re running at 60 fps, you should see an average of around 16.7 ms for the frametime. If the frametime is above 34, then you’re not even getting 30 fps. The line below the frametime is pretty important, too, as it tends to have a big impact on the frametime. Draw calls are distinct drawing operations. Generally, each rendered mesh incurs a draw call, and lighting and shadows on top of that can add more draw calls.
The player-detail breaks down the time listed in the cpu-player line at the top. The player-detail time is apportioned among physx (physics), animation, culling (determining objects that don’t need to be rendered), skinning (updating the skin position on animated characters), batching (combining meshes that have the same materials so they are rendered with a single draw call), rendering, and the fixed update count.
The profile results in Listing 16-3, taken on a fourth-generation iPod touch, show a frametime not even close to 30 fps, much less 16 fps, and the player-detail is dominated by the render time. One thing that is known to have a big performance impact is dynamic shadows, so let’s disable shadows in our Light (Figure 16-6).

Figure 16-6. Disabling shadows from the bowling scene Light
Then Build and Run again to start a new profile session (Listing 16-4).
Listing 16-4. Built-In Profiler Output After Removing Shadows
iPhone Unity internal profiler stats:
cpu-player>    min:  5.0   max:  7.6   avg:  5.7
cpu-ogles-drv> min:  3.1   max:  7.0   avg:  3.7
cpu-present>   min: 14.4   max: 42.9   avg: 28.1
cpu-waits-gpu> min: 14.4   max: 42.9   avg: 28.1
 msaa-resolve> min:  0.0   max:  0.0   avg:  0.0
frametime>     min: 28.5   max: 55.5   avg: 39.5
draw-call #>   min:  29    max:  29    avg:  29     | batched:    10
tris #>        min:  4584  max:  4584  avg:  4584   | batched:  3420
verts #>       min:  3712  max:  3712  avg:  3712   | batched:  2750
player-detail> physx:  0.0 animation:  0.0 culling  0.0 skinning:  0.0 batching:  1.9 render:  3.1 fixed-update-count: 0 .. 0
mono-scripts>  update:  0.2   fixedUpdate:  0.0 coroutines:  0.1
mono-memory>   used heap: 401408 allocated heap: 524288  max number of collections: 0 collection total duration:  0.0
If you’re not running Unity iOS Pro or you turned off shadows earlier for performance reasons, then you’re already here. Anyway, the results are dramatic. Turning off shadows significantly reduces draw calls, and the frametime and render time are lower, although the frame rate is still below 30 fps.
The built-in profiler gives you a general idea of the bottlenecks in your game’s performance—whether it’s draw calls, physics computation, or script execution, for example. But it’s still a bit of a guessing game figuring out exactly what’s taking up the frametime. Unity Pro users have the luxury of using the Profiler included in the Unity Editor. The Profiler can record the performance of a game run in the Editor or profile remotely, capturing performance data from a test device. To profile our bowling game running on a test device, you need to check the Development Build option in the Build Settings, which will enable the Autoconnect Profiler option (Figure 16-7).
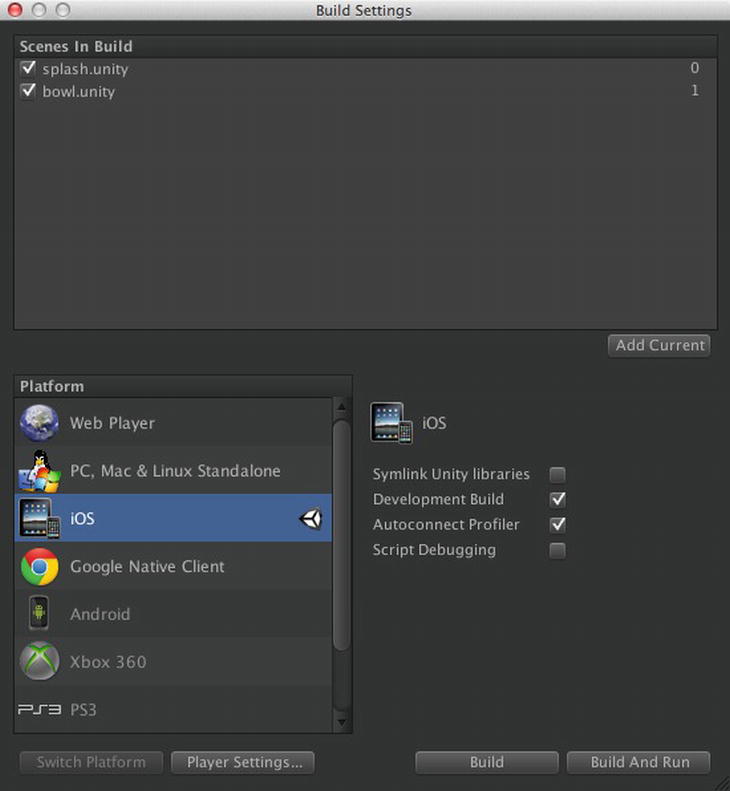
Figure 16-7. Building with Autoconnect Profiler enabled
Perform a Build and Run, and the Profiler window should appear automatically, running a profiling session of the game running on the device (Figure 16-8).
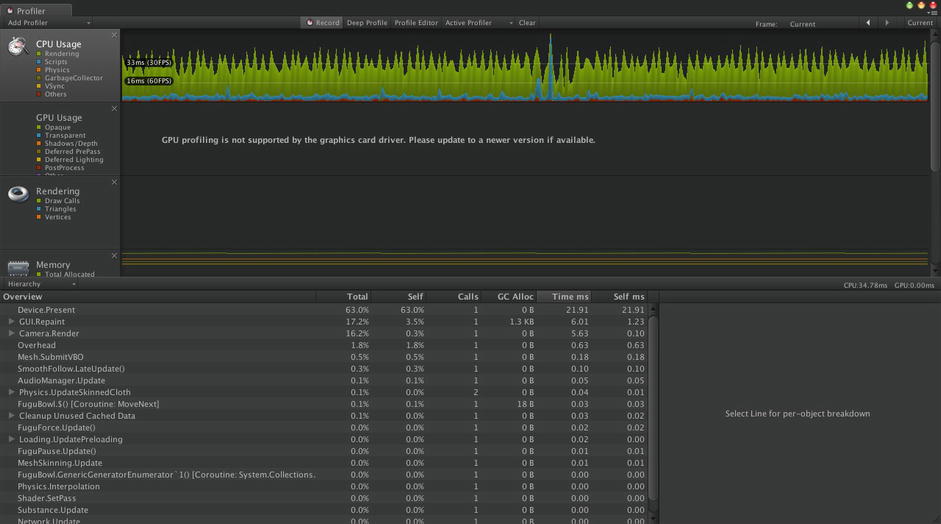
Figure 16-8. The Profiler window
The topmost bar displays the computer processing unit (CPU) usage. This particular profile indicates we’re hovering around 30 fps. The area below shows a breakdown of the CPU usage by function calls (Figure 16-9).

Figure 16-9. The Profiler breakdown of CPU usage
You can expand the items to reveal the nested function calls. Figure 16-9 indicates we’re spending a lot of time in our UnityGUI functions, both the scoreboard and pause menu (this profile is taken with the pause menu up).
If for some reason the profiler doesn’t start automatically, the Profiler can be brought up from the Window menu (Figure 16-10).
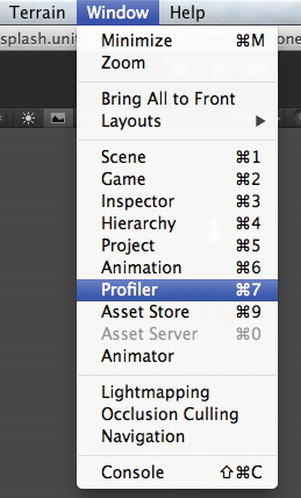
Figure 16-10. The Window menu item to display the Profiler
The Profiler is actually a view, which is why it’s listed among the other views in the Window menu. But, like the Asset Store, the Profiler takes up so much screen space it is best left by itself in a floating window .
Once the Profiler window is up, it will automatically start recording the game in the Editor (even if the game is not actually running), so click the Record button to stop it. Then select your iOS test device in the Active Profiler window (Figure 16-11) and click the Record button again to start profiling.
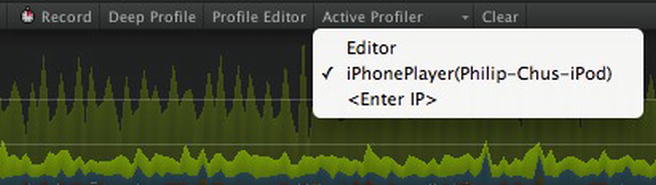
Figure 16-11. Selecting an iOS device as the Active Profiler
Enabling the built-in profiler or attaching to the Editor Profiler over the network is inconvenient just to see the frame rate. That’s where an on-screen frame rate display would come in handy. You could just toggle it on while you’re lying on the sofa watching TV and play testing your game (at least that’s what I do).
For an on-screen frame rate display, you could use a UnityGUI label like we did with the bowling scoreboard. However, there’s another way to display 2D text on screen, using the GUIText Component. You can create a GameObject with a GUIText Component already attached using the GameObject menu on the menu bar, or the Create menu in the Hierarchy View (Figure 16-12).

Figure 16-12. Creating a GUIText GameObject
Let’s go ahead and create that GUIText GameObject and name it FPS (Figure 16-13).

Figure 16-13. The FPS GameObject with a GUIText Component
Like the GUITexture we used for our secondary splash screen, GUIText is positioned on the screen in normalized coordinates, where the bottom left corner is 0,0 and the top right is 1,1, specified in the Transform x and y values of the GameObject. Set the x and y positions of our frame rate display to -.1 each, placing it near the bottom left corner, and change the text value from GUIText to FPS.
Don’t bother customizing the font because the frame rate display is only for development use and you won’t activate it in the released app (although in HyperBowl, the frame rate display can be activated by users so they can report performance issues). The default size value of 0 indicates the font size specified in the font’s import setting is used, but that’s pretty small, so let’s set it to a reasonably large size, 40. All this time, the GUIText is visible in the Game View, so you can see the effect of the size changes (Figure 16-14).

Figure 16-14. The Game View with a GUIText
Just as GUITexture is more convenient for displaying static textures than UnityGUI, requiring no scripting, GUIText is a more straightforward way to display static text on the screen than UnityGUI. But the frame rate display does need to change the text by setting the text variable in the GUIText instance. Let’s implement our frame rate display script now. Create a new script, place it in the Scripts folder, and name it FuguFPS (Figure 16-15).

Figure 16-15. Creating a new FuguFPS.js script
Then add the Update function in Listing 16-5 to the script. The script’s Update callback sets the text variable, of GUIText with the calculated frame rate. The calculation is simplistic, based on Time.delta time, the most recent frametime. Normally, frames per second would be calculated as 1/Time.deltaTime, but since Time.deltaTime is scaled by Time.timeScale, you can easily take that into account by using Time.timeScale/Time.deltaTime.
The text variable in GUIText is a String variable, so you need to convert the frame value to a String by calling the number’s ToString function (every built-in type has a ToString function). And then append the “FPS” so you won’t wonder what those two numbers are on the screen!
Listing 16-5. The Complete Frame Rate Display Script FuguFPS.js
#pragma strict

function Update()
{
        if (Time.deltaTime>0) {
                var fps:float = Time.timeScale/Time.deltaTime;
                guiText.text  = fps.ToString("f0")+"FPS";
        }
}
Now attach the script to the FPS GameObject. When you click Play in the Editor, you should see the frame rate display flicker among different numbers. And when you perform a Build and Run to a test device, you should see the frame rate display correspond to the numbers you got in the built-in and Pro profilers (Figure 16-16).

Figure 16-16. A frame rate display running on a test device
Just remember, you should deactivate the FPS GameObject before you release this app!
The proper way to optimize is to methodically go through the bottlenecks starting with the largest, profiling the improvements at each stage until you achieve your target. But for the purposes of getting through a number of optimization procedures in this chapter, we'll plow through a bunch of them in sequence.
Let’s start by tweaking the global settings that relate to our optimization effort. The settings that are most likely to affect performance are the Quality Settings, which control the visual quality of the game (Figure 16-17).

Figure 16-17. Optimizing the Quality Settings
We’re going for speed, so set the current iOS quality to Fastest and then adjust the settings from there. Zero pixel lights is fine for the lighting set up. If you had a spotlight, then the lack of a pixel light would be obvious.
You don’t want to force all textures to half resolution though. Relying on the Texture Import settings to limit the resolution on a case-by-case basis gives you more flexibility. So let’s set the Texture Quality to Full Res.
Similarly, you'll want to change the setting for Anisotropic Textures from none to per-texture. Anisotropic Texture are textures that compensate for being viewed at an angle, which is appropriate for a texture used for a road in a racing game, for example. Like texture resolution, anisotropy can be adjusted for a Texture in its Import Settings.
Multisample Anti Aliasing (full-screen smoothing) is an expensive operation, as you would expect a full-screen per-pixel operation would be.
You don’t have any particle systems in this game, so the Soft Particles setting doesn’t matter, but it’s another pixel-dominated operation (these types of features are often called fill-rate limited).
Shadows are disabled, so all the shadow parameters below it are irrelevant, but if shadows were enabled, the two key properties are the Shadow Resolution and Shadow Distance. Both properties affect the shadow’s resolution; increasing the Shadow Resolution naturally allows for a more sharply defined shadow at the expense of more memory consumed for a larger shadow map, and much like the improved depth buffer precision of a shortened Camera frustum, a shorter Shadow Distance reduces the need for a large shadow map texture. Reducing the Shadow Resolution saves space while introducing more jaggy shadows, while reducing the Shadow Distance potentially reduces the number of objects involve in the shadows.
Rigidbodies go to sleep when they’re at rest to avoid unnecessary physics computation. “At rest” means the Rigidbody’s motion has stopped moving and rotating. You can specify the threshold for the Sleep Velocity and Sleep Angular Velocity in the Physics Manager (Figure 16-18), available under the Settings portion of the Edit menu.

Figure 16-18. Optimizing the Physics Manager
At the bottom of the Physics Manager, you can also specify which layers of GameObjects can collide with one another. This doesn’t make a difference with our bowling game, because all of our colliding objects are in the Default layer. But to demonstrate this point, let’s modify the collision table to only allow GameObjects in the Default layer to collide with other GameObjects in the Default layer.
Because the physics updates take place at fixed intervals, you can reduce physics computation time by increasing the fixed timestep in the Time Manager (Figure 16-19). Ideally, the fixed timestep should be set as high as possible without degrading the physics simulation. For now, we’ll increase the fixed timestep from 0.02 to 0.03.

Figure 16-19. Optimizing the Time Manager
The property immediately below Fixed Timestep is also related to physics updates: Maximum Allowed Timestep. This value caps how much time can be spent on physics updates in each frame. This prevents the runaway situation where the fixed updates take up a lot of time and increase the frametime, thus including more fixed updates in the next frame and so on. Lowering the Maximum Allowed Timestep minimizes the FixedUpdate impact on the frametime but risks degrading the physics simulation.
There is also an optimization tradeoff in how the audio is played. In the Audio Manager (Figure 16-20), you can specify the audio latency, which is how much delay is allowed before the sound is played.

Figure 16-20. Optimizing the Audio Manager
For games where responsive sound is important (e.g., the collision sounds in our bowling game), selecting Best latency (i.e., lowest latency) is appropriate.
The Player Settings can have a great effect on optimization. In the Resolution and Presentation Settings, we opted for the highest native screen resolution, and we also have the maximum 32-bit per-pixel color resolution selected for the Display Buffer (Figure 16-21). If the box is unchecked, the display buffer uses 16 bits for each pixel, which can result in some color banding. Thus we’re going for more visual fidelity at the expense of taking up more memory.
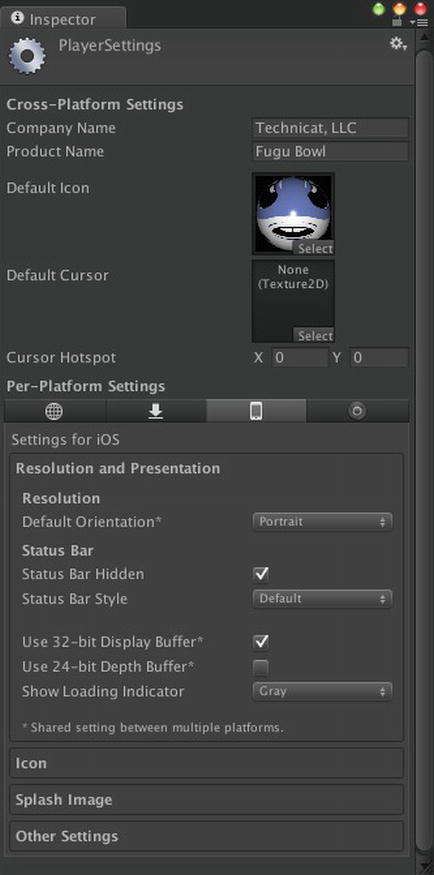
Figure 16-21. Optimizing the Resolution and Presentation in Player Settings
Let’s leave the Depth Buffer at the default 16 bits per pixel, but if that precision is not enough to prevent z-fighting (the case where an object close behind another pokes through), you can raise it to 24 bits per pixel, again improving visual quality but using more memory.
The Other Settings section is filled with optimization options, and not just in the portion labelled Optimization (Figure 16-22).

Figure 16-22. Optimizing Other Settings in Player Settings
As I pointed out in the first profiling session, draw calls tend to have a big impact on performance. Static batching, only available to Unity iOS Pro users, reduces draw calls by combining meshes at build time that can be rendered together in the same draw call. For meshes to be combined, their GameObjects must be marked as static in the Inspector view and they must share the same material or set of materials.
Static batching is a very flexible system; it remembers the distinct identity of each GameObject, so a GameObject with a statically batched mesh can still be deactivated at will and is still subject to culling.
Our bowling game only has one static mesh, the Floor, so enabling static batching won’t make any difference here. In general, static batching provides a good performance boost but at the expense of taking up more memory, because it essentially copies each batched mesh.
The next option, dynamic batching, is available to both Pro and non-Pro users and takes place at runtime. Like static batching, it requires meshes to share materials before they can be combined, but dynamic batching can handle moving objects, because it checks every frame if it needs to rebatch objects. For example, the bowling pins in our game can be batched because they all obviously have the same material. They were instantiated from the same prefab, after all. However, the bowling ball cannot be batched with any of the pins or the bowling surface.
Batching does take some time, which is why it shows up in the built-in profiler, but, like static batching, it generally is a big win for performance.
The Accelerometer Frequency is set to 60 samples per second by default. You can save some processing time by lowering that frequency to 15, which is sufficient for our shake detection code. If you don't use the accelerometer at all in an app, set it to 0.
Unity Pro users have the option to apply iOS Stripping. Three cumulative levels are available: String Assemblies, Strip Bytecode, and Use micro mscorlib. Let’s choose the latter, which is the most aggressive optimization and includes the other two. The micro mscorlib is a custom, slimmed down version of the core Mono library, which may be incompatible with additional .NET libraries you might import, but that's not an issue for this game.
The Script Call Optimization level determines how calls to native code are made. The default setting, Slow and Safe, incurs overhead, so let’s set it to Fast with No Exceptions. As the label signifies, this setting is faster but will fail if the native code throws an exception (essentially, an error that is expected to be handled by calling code).
The Optimize Mesh Data option removes at build time any unnecessary per-vertex mesh information. If a mesh is not using a bump-map shader, then the tangents can be removed, and if the mesh is using an unlit shader, then normals can be removed. This saves space and facilitates batching, since batching copies all of those Mesh data. Of course, if you’re going to change the shader of a Mesh at runtime via script to a shader that requires more per-vertex information than the original shader, you shouldn’t use this option.
After adjusting the Quality Settings, Physics Manager, and Time Manager, we’re ready to tweak individual GameObjects.
Cameras are a focal point (no pun intended) of optimization because they dictate what is rendered and how it is rendered. The Camera frustum automatically provides one source of optimization. Any GameObject that resides entirely outside the frustum is not visible to the Camera, so no attempt is made to render the GameObject. This optimization is called frustum culling and also benefits animation and particle systems. The system has no need to play an animation or simulate particles when there’s no one to see it.
Tip The fastest way to render a GameObject is to not render it all.
Therefore, adjusting the Camera’s frustum so it includes fewer objects in a scene is one source of optimization. You can narrow the frustum by lowering its field of view, and you can shorten the frustum by decreasing the far distance value, bringing the far plane closer to the Camera (Figure 16-23).

Figure 16-23. Optimizing the Main Camera
For example, the default value of 1000 for the far plane value in the Main Camera is overkill, considering the bowling Floor is much smaller. Setting the far value to 100 still leaves everything visible (Unity skyboxes are conveniently visible independent of the frustum).
Minimizing the far plane value has the additional benefit of storing a smaller range of values in the depth buffer when rendering. This avoids the problem of z-fighting, where an object that is barely behind another seems to poke through the one in front because of the limited numerical precision in the depth buffer.
Another way to cull GameObjects from rendering by a Camera is to specify that it renders only GameObjects in a certain set of layers, listed in its Culling mask. This is really a matter of correctness—you want to make sure the Camera is rendering only what it’s supposed to be rendering, and not, say, HUD elements that are already rendered by a separate HUD camera. But it does affect performance. I once had a bug where the Main Camera was unintentionally rendering GUI elements, but far enough in the distance that I didn’t notice it.
Each Camera also has an eventMask variable that is similar to its Culling mask (or, equivalently, its cullingMask variable), but instead of specifying what layers are rendered by the Camera, the eventMask determines what layers receive onMouse events from the Camera. Minimizing the layers present in eventMask can reduce the overhead of onMouse processing, but as it's not visible in the Inspector View, that variable has to be set from a script.
The last Camera optimization to make is to specify the Render Path. There are two render paths available on iOS: Vertex Lit and Forward Rendering (Deferred Rendering is not available for mobile platforms). Forward Rendering is more flexible and powerful than Vertex Lit. For example, the Vertex Lit path won’t display bump-mapping. But in this chapter, we’re aggressively going for a high frame rate, so let’s set the render path to Vertex Lit.
We already disabled shadows on our Light (except for non-Pro users who didn’t have shadows in the first place), which is a big performance improvement because it reduces draw calls. And lighting is already influenced by the Quality Settings, which specify no pixel lights and disabled shadows (Figure 16-24).

Figure 16-24. Optimizing the Light
But we can perform some additional adjustments on the Light similar to our Camera tweaks. Like the Camera, Lights have a specified range, which we can minimize to reduce the number of lit GameObjects. Lights also have a Culling Mask, which, as in the case of the Main Camera, can be set to the Default layer, but with judicious assignment of layers you can reduce unnecessarily lit GameObjects.
In pursuit of speed, we’ve chosen the simplest lighting and the simplest render path. You can also simplify the shaders you’re using for each Mesh. The bowling pins comprise most of the objects in our scene, so let’s modify the BarrelPin prefab first (Figure 16-25).

Figure 16-25. Optimizing the BarrelPin prefab
In the Project View, select the Barrel GameObject in the prefab and click the Shader selector in the Inspector View. There are many simpler shaders than Bumped Specular; anything with less than two materials is likely to be faster, and Vertex Lit will be more efficient than any of the pixel shaders. There is even a set of shaders specifically implemented for mobile devices, including Mobile/Vertex Lit. But there’s one that is even better for our situation, a Mobile/Vertex Lit shader implemented specifically for use only with directional lights. So let’s choose that one, Mobile/Vertex Lit (Only Directional Light).
The Floor GameObject has a few Component properties that can be tweaked for optimization (Figure 16-26). Starting with the MeshRenderer Component, we have the Cast Shadows and Receive Shadows options enabled. Although we have Shadows disabled in the Light and in the Quality Settings, you should pay attention to the per-object settings just in case you enable shadows in the future. If shadows were enabled, you would want shadows cast on the floor, so Receive Shadows should be enabled. But because we don’t expect the Floor to cast a shadow (at least not on anything we can see), let’s disable the Cast Shadows option. For performance, the fewer shadow casters, the better.

Figure 16-26. Optimizing the Floor
Turning to physics, there is another opportunity for optimization. Although we have primitive colliders for the bowling pins and bowling ball, our Floor has a MeshCollider Component. Because the Floor is a flat and square surface, you could use a BoxCollider instead. Replacing it is a simple process: when you add a BoxCollider Component to the Floor, either using the Add Component button in the Inspector View or the Component menu on the menu bar, Unity asks if you want to replace the existing MeshCollider (say yes), and the new BoxCollider Component will automatically be sized to fit the Floor mesh.
As with the bowling pins, you could also change the shader from the fairly complex Bumped Specular shader to Mobile/VertexLit (Only Directional Lights), as we did with our bowling pin prefab. But the floor is a special case because it’s flat. The lighting across its surface is uniform. So you can use the Unlit Texture shader and avoid any lighting calculations at all.
The last GameObject we will optimize is the Ball. It’s already using a SphereCollider Component, so the one thing we’ll change is the shader. Like the bowling pins, the Ball is going to move, so let’s use a lit shader, in particular the same Mobile/VertexLit (Only Directional Light) shader that we selected for the pins. However, the Ball is currently using the default diffuse Material that was automatically assigned when you created the Ball, and you can’t change the shader on that Material. So you’ll need to assign a different Material to the Ball.
You can create a new Material in the same way you created the other types of assets. In the Project View, bring up the Create menu and select Material (Figure 16-27).

Figure 16-27. Creating a new Material
Place the new Material in the Materials folder and name it Ball. Select it (Figure 16-28), and in the Inspector View you can adjust its shader, selecting Mobile/VertexLit (Directional Light).

Figure 16-28. Setting the shader for a new Material
Then drag the Ball material onto the Ball GameObject, and you’re all set (Figure 16-29).

Figure 16-29. Optimizing the Ball
Both of the Mobile/VertexLit shaders will display a white color if no texture is supplied. If you want the ball to have a color other than white, you would use the standard Vertex Lit shader, which allows you to specify a Main Color and Specular (shininess) Color.
It’s easy to overlook the fact that a lot of optimization can take place when the asset is imported, and you have control over this in the Import Settings for each asset.
Our textures are already imported with reasonable default settings, but let’s look at a couple of textures so we can understand those settings. In the Project View, let’s look in the Textures folder and compare the cat texture we used for the example scene in Chapter 3 (Figure 16-30) and the texture we used for the secondary splash screen in Chapter 12 (Figure 16-31). The cat texture used the Import Settings corresponding to the Texture preset, while the splash texture used the Import Settings of the GUI preset. In both cases, switching from the preset to Advanced reveals the specific settings of the preset.
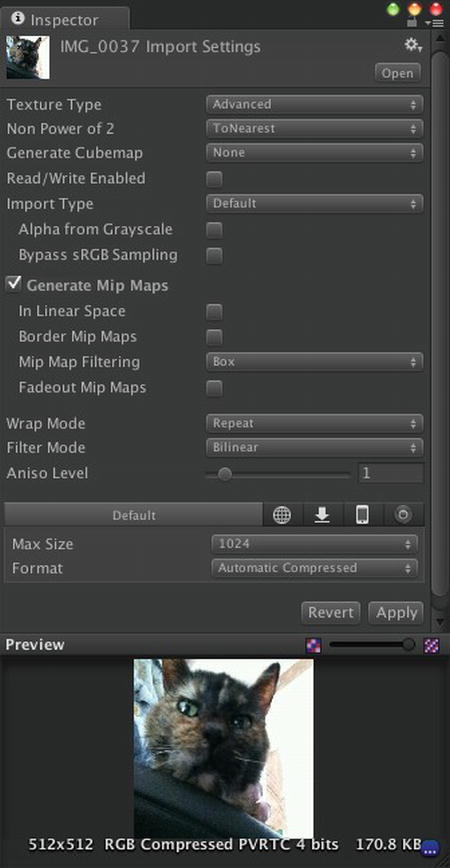
Figure 16-30. Import Settings for a texture
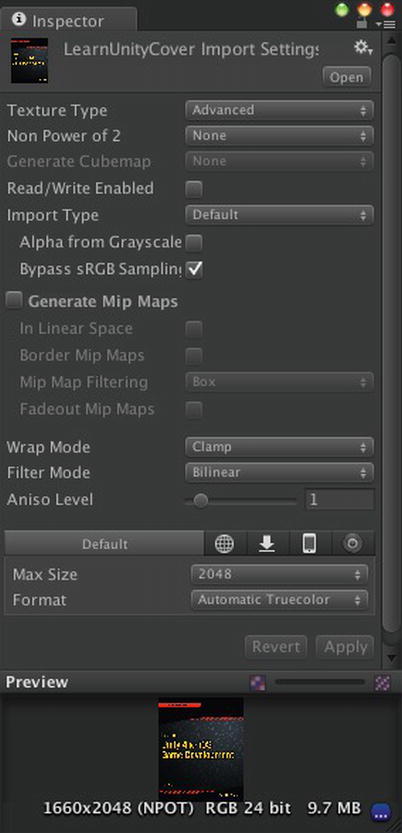
Figure 16-31. Import Settings for a GUITexture
There are two major differences between the Texture and GUI presets: Texture has Mip Mapping enabled, while GUI has the sRGB bypass option enabled. The mip in mipmapping stands for the phrase multim in parvo, meaning “many in little.” Mipmaps are precomputed smaller versions of the texture that provide a smoother visual quality and transition as the texture comes nearer or farther away from the Camera.
The filter type determines how a pixel from the texture (or texel) is calculated for rendering purposes. For point filtering, the texel is chosen from the mip map closest to the desired size. Bilinear filtering averages the surrounding texels from the closest smaller mipmap, while trilinear filtering combines the bilinear filtering results from the closest larger mipmap and the closest smaller mipmap. Point sampling is the simplest and fastest filter, while trilinear filtering is the most expensive. Bilinear filtering is the middle ground and a reasonable default.
Mipmapping is usually appropriate, despite the increased memory usage. Besides improving the texture display, mipmapping allows the graphics processor to work with a smaller version of the texture, which can improve performance. For a texture used in a GUI (e.g., UnityGUI or GUITexture), you’ll typically view the texture at just one size, and ideally at the texture’s original size, so mipmapping is unnecessary. That’s certainly true for the splash screen, especially when it isn’t even loaded into a scene.
Tip For a texture with sharp details (e.g., one use as a street sign), it may be better to use point sampling or even disable mipmapping entirely to avoid blurring the texture.
The anisotropic (directionally dependent) filtering level compensates for the case where a texture is tilted with respect to the Camera, such as the road surface in a racing game. In those cases, filtering uniformly across a texture in both directions may not look right. For regular textures in a scene, the anisotropic level should be chosen on a case-by-case basis. For GUI textures, which are viewed face on from the Camera, no anisotropic filtering is required.
Normally, textures are imported taking into account gamma space, the nonlinear color space of screens. In general, this isn’t necessary for GUI textures, so in those cases, the bypass sRGB option is selected. If it doesn’t look quite right, try both options.
For mipmapping, textures need to be square and have dimensions that are a power of two (POT), because mip maps are generated at successively halved dimensions. For example, a 256 × 256 texture would have mip maps at 128 × 128, 64 × 64, and so on. Even a non-mipmapped texture benefits from POT dimensions, because that’s what the graphics hardware ultimately uses. Most textures designed for games have POT dimensions, but if they don’t, the Texture imports settings can automatically size the texture to the nearest POT.
For GUI textures, you usually don’t want this. Our splash screen has None set for its POT scaling, and the resulting preview displays its original dimensions and NPOT (Non-Power of Two). If you try to use it as a regular texture in the scene, Unity will issue a warning in the Console View that you’re using a NPOT texture in a non-GUI way and will incur a performance penalty.
The max texture size and compression level of the texture are listed in the preset settings and are specified independently of the presets. For regular textures, the default Max Size of 1024 is reasonable (2048 × 2048 is the maximum supported by all devices), but it should be chosen on a case-by-case basis. For example, if a large texture has just one color, you might as well make it a 2 × 2 texture. And if a texture is only used on a Mesh that is small or far away on screen, then there’s no reason to make it a big texture. For the splash screen, we set the Max Size to 2048 so we don’t scale the texture to be smaller than the iPad Retina screen.
Tip Setting the max scale to the maximum allowable and the compression level to TrueColor allows you to see the original format of the texture in the preview area of the Import settings.
For a regular texture, the default compression level, 4-bit PVRTC (PowerVR Texture Compression), is reasonable. A texture with less detail may work with the more aggressive 2-bit PVRTC. As with mipmapping, texture compression reduces the memory taken by texture mapping, and the graphics processor support for PVRTC provides an additional performance advantage. And as with mipmapping, particularly detailed textures may be degraded too much by compression, in which case leaving the texture at uncompressed 16-bit or uncompressed TrueColor (24-bit) may be better. For GUI textures, you might not want to compress the texture for that reason, or in the case of the splash screen that we assign in the player settings, you should leave it alone in its native format.
We adjusted the DSP Buffer Size in the Audio Manager for more responsive collision sounds, lowering the latency at some processing expense. As with textures, you can also adjust the Import Settings for AudioClips. Analogous with having two general categories of texture usage, for 3D and GUI, you also have 2D and 3D sounds, where 3D sounds are associated with GameObjects, or at least a position in the 3D world, while 2D sounds are used for ambient audio or music (like the song we added to our dance scene in Chapter 5).
Let’s compare a couple of our bowling sounds: the pin collision sound (Figure 16-32) and the ball rolling sound (Figure 16-33). They’re both sounds that emanate from a position in the world and even move with respect to the Main Camera (or rather, more precisely, they move with respect to the AudioListener Component attached to the Main Camera). Thus, they’re both marked as 3D sounds in their Import Settings. 3D sounds should be mono, not stereo. Fortunately, the original audio files for both of these sounds are mono, so you don’t have to select Force to mono.

Figure 16-32. Optimizing Import Settings for the pin collision sound

Figure 16-33. Optimizing Import Settings for the ball rolling sound
The collision sound is fairly small, so let’s leave it uncompressed to avoid the processing involved in uncompressing the sound and to maximize the quality of the playback. The rolling sound is a larger sound file, so let’s compress it and leave it compressed in memory. Because this is the only compressed sound, and iOS has hardware support for decoding one compressed sound at any time, you’re not incurring any software decoding overhead. However, if you also had ambient sound or music playing in the scene, chances are that would be a much larger sound file and you would want to compress that instead.
Tip Import uncompressed sounds to allow flexibility in deciding which sounds to compress in the Editor. There’s no reason to import compressed audio unless you’ve found a compression tool that gives you better quality than Unity’s compression.
With compression selected, the gapless looping option becomes available. That forces the compression to process the end of the audio clip so it can loop seamlessly, which is what you want, since you’re playing this sound in a loop.
For compressed audio, there is one other load option besides Uncompress on load and Compressed in memory: Stream from disc. There is some additional overhead in streaming from disc, but that’s a good option for a scene that plays multiple songs in succession, in which case it would be prohibitive to keep all of those songs in memory.
Most of the Mesh Import Settings (Figure 16-34) that affect optimization have an impact principally on memory usage.

Figure 16-34. Optimizing Import Settings for a Mesh
The first is Mesh Compression, which reduces the amount of space and memory used for a mesh by reducing the numerical precision (i.e., number of bits used to represent the vertices, normals, texture coordinates, and tangents). This can also reduce the visual quality, so it’s best to experiment and find the maximum compression level that doesn’t degrade the appearance. The available levels are low, medium, high, and none. The default is none.
Listed below Mesh Compression is Read/Write Enabled. This is by default on, creating a copy of the Mesh that can be modified. But if you don’t have any scripts that read or write Mesh variables, such as vertices and normals, and you usually don’t need any, then you can leave this option off.
Optimize Mesh, not to be confused with the Mesh Optimization option in the Player Settings, offers some performance improvement by optimizing the arrangement of the Mesh’s triangle list.
Leave Generate Colliders off if you’re not going to use a Mesh Collider. In fact, it’s not a bad idea to leave this option off as a rule, because you can always add a Mesh Collider manually if you need one, but it’s often preferable to add one or more primitive Colliders instead.
If you know the shader for this Mesh will not require normals or tangents, you can set the Normals and Tangents options, respectively, to none. But if you have Mesh Optimization selected in the Player Settings, unused vertex data will be removed at build time anyway.
The usual tips for optimizing code apply to scripting in Unity. For example, we’ve already made a point of calling the magnitudeSquared function of Vector3 instead of magnitude to avoid its internal square root operation. But I’ll describe some of the less obvious ways to improve script performance or use scripts to improve performance in the following sections.
In general, it’s a good idea to assign a value to a variable if you’re going to calculate that value more than once, whether it’s a math expression, the result of a function call, or even accessing the value of an instance or static variable, which might in fact be internally performing a function call.
This is the case with the component shortcut variables we’ve been accessing in our scripts like transform, audio, and rigidbody, each of which results in a call to GetComponent that searches among all the Components attached to the GameObject for a Component with the matching type.
So any time you’re going to reference a Component shortcut variable more than once in a script, whether it’s listed more than once in the script or referenced repeatedly in callback like Update, or especially if the shortcut is referenced in a loop with many iterations, you should assign the Component to a variable early on. Listing 16-6 shows how to apply this optimization to our FuguReset script.
Listing 16-6. Caching Component Shortcuts in FuguReset.js
#pragma strict

private var startPos:Vector3;
private var startRot:Vector3;

// for performance
private var trans:Transform = null;
private var body:Rigidbody = null;

function Awake() {
        // cache the Transform reference
        trans = transform;
        body = rigidbody;
        // save the initial position and rotation of this GameObject
        startPos = trans.localPosition;
        startRot = trans.localEulerAngles;
}

function ResetPosition() {
        // set back to initial position
        trans.localPosition = startPos;
        trans.localEulerAngles = startRot;
        // make sure we stop all physics movement
        if (body != null) {
                body.velocity = Vector3.zero;
                body.angularVelocity = Vector3.zero;
        }
}
The original version of FuguReset.js referenced two Component shortcut variables: transform and rigidbody. So we add two private variables, named trans and body, to reference those Components and initialize trans and body in the Awake callback.
This cleanup is applicable to many of our scripts, because we commonly reference transform, rigidbody, and audio. I won’t list all of the revised code, but the updated scripts are available in the project files for this chapter on http://learnunity4.com/.
The detailed profile results indicate that UnityGUI takes up a significant portion of our frametime. One source of slowdown in UnityGUI is the overhead of using GUILayout to automatically place GUI elements. We don’t use GUILayout in the scoreboard, so you can add an Awake callback which sets useGUILayout to false in the FuguBowlScoreboard script (Listing 16-7).
Listing 16-7. Setting useGUILayout to False in FuguBowlScoreboard.js
function Awake() {
        useGUILayout = false;
}
The pause menu still uses GUILayout, but because the menu is only up when the game is paused and won’t affect gameplay, its performance is less of a concern.
Dynamic batching can combine similar meshes that weren’t candidates for static batching at build time because they’re moving or happened to be created during the game. But dynamic batching has to constantly update the batching, which is why the batching time is listed in the profile results. This rebatching seems like a waste if the batched objects are moving together or if they are not moving but were instantiated at runtime. Also, since batching takes memory, there is an upper limit on the amount of dynamic batching that will occur (the Unity documentation currently says 30,000 vertices, but that is subject to change).
Fortunately, there is a class called StaticBatchingUtility (in Unity Pro and Unity iOS Pro) that allows you to perform static batching at runtime by calling a Combine function. Listing 16-8 shows a really simple script that just calls StaticBatchingUtility.Combine on the script’s GameObject.
Listing 16-8. Script for Statically Batching an Object Hierarchy
#pragma strict

function Start() {
        StaticBatchingUtility.Combine(gameObject);
}
Although simple, the script is fully functional. For example, in the rotating cube scene, if we dragged this script onto the main rotating Cube that has two child cubes (and disabled the individual rotation scripts of the child cubes), all three cubes would be statically batched together when the scene starts playing. The batched GameObjects don’t have to be in a hierarchy together. StaticBatchingUtility.Combine is an overloaded function, and with another version it takes two arguments: an array of GameObjects to batch together and a GameObject designated as the parent.
For batching to take place, whether statically, dynamically, or through a call to StaticBatchingUtility.Combine, the Meshes to be batched must share the same Material or set of Materials. But for dynamic batching in particular, you need to be careful that you don’t break that sharing if you modify the Material.
For example, the script in Listing 16-9 animates the texture of a Material by constantly changing its texture offsets. This provides a scrolling texture effect; in HyperBowl, this script is used to animate textures for scrolling neon signs, drifting clouds in the sky, and flowing water. However, when the script modifies the Material by calling its SetTextureOffset function, a new Material is created if the original Material happens to be shared.
Listing 16-9. Script That Animates the Texture Coordinate Offsets of a Material
#pragma strict

var speed:Vector2;
var materialIndex:int=0;

private var offset:Vector2;
private var material:Material;

function Start() {
        offset=new Vector2(0,0);
        material = renderer.materials[materialIndex];
}

function Update () {
        var dtime:float = Time.deltaTime;
        offset.x=(offset.x+speed.x*dtime)%1.0f;
        offset.y=(offset.y+speed.y*dtime)%1.0f;
        material.SetTextureOffset("_MainTex",offset);
}
This makes sense, of course. If you create two GameObjects with the same Material and decide you want to alter the appearance of one by modifying its Material, you don’t necessarily want to make the same change to the other GameObject.
However, if you’re going to apply the same animation to all the GameObjects that are sharing the Material, then there’s no reason to stop sharing the Material. So you can modify the script to access the sharedMaterials variable of the MeshRenderer instead of the materials variable. Accessing sharedMaterials (or sharedMaterial if you assume only one Material on the GameObject) means you really do want to change the shared Material and avoids creating a new one, thus preserving eligibility for batching. To handle both shared and nonshared Material cases, let’s add a public variable that allows you to specify whether the animation breaks Material sharing, and let’s use that value to determine whether to modify renderer.materials or renderer.sharedMaterials (Listing 16-10).
Listing 16-10. Texture Animation Script with Option to Share Material
#pragma strict

var speed:Vector2;
var materialIndex:int=0;

var shared:boolean = true;

private var offset:Vector2;
private var material:Material;

function Start() {
        offset=new Vector2(0,0);
        if (shared) {
                material = renderer.sharedMaterials[materialIndex];
        } else {
                material = renderer.materials[materialIndex];
        }
}

function Update () {
        var dtime:float = Time.deltaTime;
        offset.x=(offset.x+speed.x*dtime)%1.0f;
        offset.y=(offset.y+speed.y*dtime)%1.0f;
        material.SetTextureOffset("_MainTex",offset);
}
An additional, although less significant, optimization is available when using this script to animate a shared Material. It would be redundant for every GameObject with the same Material to run the same texture animation script; just one instance of the script is sufficient to drive the animation for everyone.
I alluded to automatic memory management when we developed our iAd banner script in the previous chapter, noting that you have to keep a reference to the ad object to keep it from getting garbage collected, and you should remove the reference to allow the garbage collector to reclaim the space used by the object. In the worst case, if you’re constantly creating objects and never allowing them to be garbage collected (let’s say you’ve added the objects to an Array and never remove them, so they’re always referenced), you’ll eventually run out of memory.
Garbage collections can introduce noticeable pauses into a game. The most effective way to minimize those pauses is to minimize the necessity for garbage collection, and that can be accomplished by minimizing the number of objects that are eventually reclaimed by the collector. One technique is to keep objects in a pool so they can be reused, instead of letting them get garbage collected.
You can also explicitly invoke the collector by calling System.GC.Collect. For example, you can add that call to the Awake callback in our bowling game controller to make sure a garbage collection takes place before the game starts, which will immediately clean up any unused objects left over from the previous scene (Listing 16-11).
Listing 16-11. Adding a Call to the Garbage Collector in FuguBowl.js
function Awake() {
        player = new FuguBowlPlayer();
        CreatePins();
        System.GC.Collect();
}
All of the changes we’ve made so far are quick optimizations that you can immediately try out with a test run and profile to see their effect. Unity also integrates some commercial scene preprocessing tools that can greatly improve performance: Beast and Umbra. These won’t be used in this chapter because they can take quite a while to set up and run, and frankly, they won’t do much for our simple scene. But I’ll describe them briefly in the following sections.
It’s difficult to add high-quality, real-time lighting without a heavy performance penalty. Each additional pixel light generates more draw calls, shadows are expensive, and the resulting visual quality is not as good as on the desktop much less a computer-generated scene that has been rendered offline. Beast solves both problems by generating lightmaps, which is precalculated lighting that is “baked” into textures. Of course, nothing is free—besides the set up and baking time, the lightmapped scene ends up with additional large textures that take up more memory, increase the app size, and lengthen the scene loading time.
To generate lightmaps for the current scene, you would first have to mark all the nonmoving GameObjects, including Lights, as static, because you can only precalculate lighting for fixed lights and surfaces. A lightmap is layered as a second texture over the mesh, so most likely, you would have to reimport your static meshes with the Generate Lightmap UVs option selected to create that second set of texture coordinates. Then you would bring up the Lightmapping window from the Window menu on the Editor menu bar (Figure 16-35).

Figure 16-35. Lightmapping window
In that window, you can adjust the lightmapping properties for each object in the Object pane, then switch to the Bake pane to set the lightmapping properties and initiate the lightmapping.
Note that dual lightmaps are unavailable on Unity iOS, because that feature requires deferred lighting, so single lightmaps is the only option and dynamic and static lighting won’t mix as well, especially with shadows.
I mentioned how each Camera performs frustum culling, ignoring any GameObject that lies outside the Camera’s view volume. Those not familiar with real-time computer graphics might assume that an obscured object (i.e., blocked from view by another) is also culled, but that’s not the case. All objects within the frustum are rendered, and the depth buffer is used to determine on a pixel-by-pixel basis which object is in front of another. Determining whether an object is positioned outside the frustum is a relatively straightforward calculation, but determining which objects are occluded requires some preprocessing. That’s where Unity’s integrating of Umbra as an occlusion culling tool comes in.
Adding occlusion culling to the scene is similar to the process of lightmapping the scene. You would mark nonmoving objects as static and then bring up the Occlusion Culling window from the Window menu on the Unity Editor menu bar (Figure 16-36).

Figure 16-36. Occlusion Culling window
From there, you can adjust per-object occlusion culling settings in the Object tab, and then in the Bake tab specify the occlusion culling settings and then bake the occlusion culling data.
Final Profile
Now that you’ve completed an optimization pass through our project, it’s time to profile the game again (Listing 16-12), although if you want to be methodical, you should run a profile after each change to see its effect.
Listing 16-12. Built-In Profile Results After Optimizations
iPhone Unity internal profiler stats:
cpu-player>    min:  5.0   max:  9.7   avg:  6.1
cpu-ogles-drv> min:  3.4   max:  7.4   avg:  4.2
cpu-present>   min:  0.9   max: 10.5   avg:  4.2
cpu-waits-gpu> min:  0.9   max: 10.5   avg:  4.2
 msaa-resolve> min:  0.0   max:  0.0   avg:  0.0
frametime>     min: 13.5   max: 22.1   avg: 16.6
draw-call #>   min:  30    max:  30    avg:  30     | batched:    10
tris #>        min:  4592  max:  4592  avg:  4592   | batched:  3420
verts #>       min:  3728  max:  3728  avg:  3728   | batched:  2750
player-detail> physx:  0.0 animation:  0.0 culling  0.0 skinning:  0.0 batching:  2.2 render:  3.4 fixed-update-count: 0 .. 0
mono-scripts>  update:  0.1   fixedUpdate:  0.0 coroutines:  0.0
mono-memory>   used heap: 389120 allocated heap: 524288  max number of collections: 0 collection total duration:  0.0
The profile lists an average frametime of 16.6 ms, which is just about 60 fps. Target achieved! This profile was run on a fourth-generation iPod touch (equivalent to an iPhone 4), so depending on your device, your mileage may vary.
The player-detail line indicates the frametime is dominated by batching and rendering, so graphics is the remaining bottleneck and any more time spent on script optimization would not be time well spent. And if you decided that 30 fps isn’t so bad, then you’re in a good situation to add more content and features.
Explore Further
I began this chapter by citing the perils of optimizing too early, at the risk of complicating things before you even got something working. But you should keep your performance target in mind from the very beginning of development. Start simple (the Unity documentation recommends rendering no more than 40,000 vertices on the iPhone 3GS), get something working, optimize enough to meet your performance target, continue adding content and functionality, and stop and optimize every time the game’s performance falls below your target. And remember to profile and optimize the bottlenecks. It will do you no good to optimize something that’s taking 10% of your frametime and leave alone something else that’s taking 50%.
In the Unity Manual, the section “Getting Started with iOS Development” has several pages on “Optimizing Performance in iOS,” covering the “Player Settings” we adjusted to optimize builds, description of the built-in profiler, and optimizing the build size.
The “Advanced” section documents the Profiler available with Unity Pro and also the offline optimization features mentioned: lightmapping and occlusion culling. The “Advanced” section includes many other pages related to optimization: “Optimizing Graphics Performance,” “Reducing File Size,” “Automatic Memory Management” (garbage collection), and “Shadows” (in particular, “Shadow Performance”). The pages on “Asset Bundles” and “Loading Resources” explain how assets can be downloaded and brought into a scene on demand, which is a technique that can be used to manage the installed app size.
The Reference Manual describes all the Components and Asset types we optimized. Among those Components, we tweaked the “Camera” frustum and visibility mask, also adjusted the culling mask and distance for the Light in addition to disabling its shadow, minimized the number of shadow casters and receivers per “MeshFilter”, simplified the shaders for each “MeshRenderer”, and replaced a “MeshCollider” with a “BoxCollider”. We looked over the Import Settings for the various Asset types referenced by the Components: “Texture2D”, “AudioClip”, and “Mesh”. The Reference Manual also documents the Settings Managers we customized, including the “QualitySettings”, “PhysicsManager”, “TimeManager”, and “AudioManager”. We also used the “GUIText” Component, sibling of the “GUITexture” we use for a splash screen, for our frame rate display.
The “Scripting Overview” section of the Scripting Reference has a “Performance Optimization” page with some tips on how to write faster scripts. The one new function we learned in this chapter is the static function “Combine” in the “StaticBatchingUtility” class (Combine is the only function in that class), which we called to batch a hierarchy of GameObjects at runtime. The one new variable we learned in this chapter is the “useGUILayout” variable in the “MonoBehaviour” class, which when set to true provides a performance increase by telling the UnityGUI system that the current “OnGUI” callback will not be performing any automatic layout using the “GUILayout” functions.
The Settings Managers all have corresponding classes so that their settings can be queried and set with scripts. Even though all of the Settings Managers except Render Settings are active for the entire game and not per scene, script access allows us to adjust settings for each scene. For example, we might define a Quality Level for each scene and add a script to each scene that loads the appropriate Quality Level. The classes corresponding to the Settings Managers discussed in this chapter include QualitySettings, AudioSettings, PhysicsManager, and Timemanager.
We also used the “Time” class, evaluating its “timeScale” and “deltaTime” variables and setting the “text” variable of a “GUIText” for our rudimentary frame rate display.
The Asset Store lists a few profiling systems (search for “profiler”) and some object pooling systems (search for “pool”), such as PoolManager, Smart Pool and Pooling Manager. That last one, from DFT Games, is free.
The Unity wiki at http://wiki.unity3d.com/ has some performance tips under its “Tips, Tricks and Tools” section and several performance-related scripts. In particular, the “FramesPerSecond” page lists several frame-rate display scripts more sophisticated than the one we created in this chapter (for example, they calculate the frame rate from a series of frames for a steadier display).
The Umbra occlusion culling system is developed by Umbra Software at http://umbrasoftware.com/. The Beast lightmapping system is an Autodesk product with a product page at http://gameware.autodesk.com/beast.
Books
I've mentioned Real-Time Rendering (http://realtimerendering.com) a couple of times, already, but it's really really relevant to the graphics optimizations in this chapter. Just the treatment on mipmapping is a good read.